Challenge

File Parsing - NASA thermodynamics data

Objective

To write a function/program that extracts the 14 co-efficients and calculates the enthalpy, entropy and specific heats for all the species in the data file.

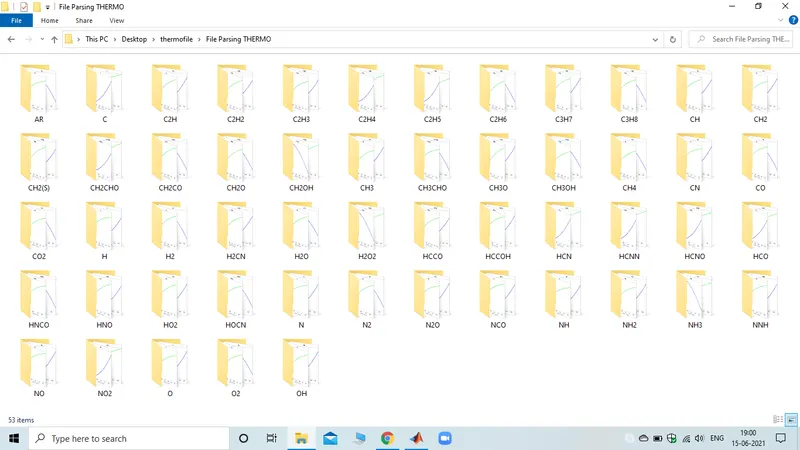
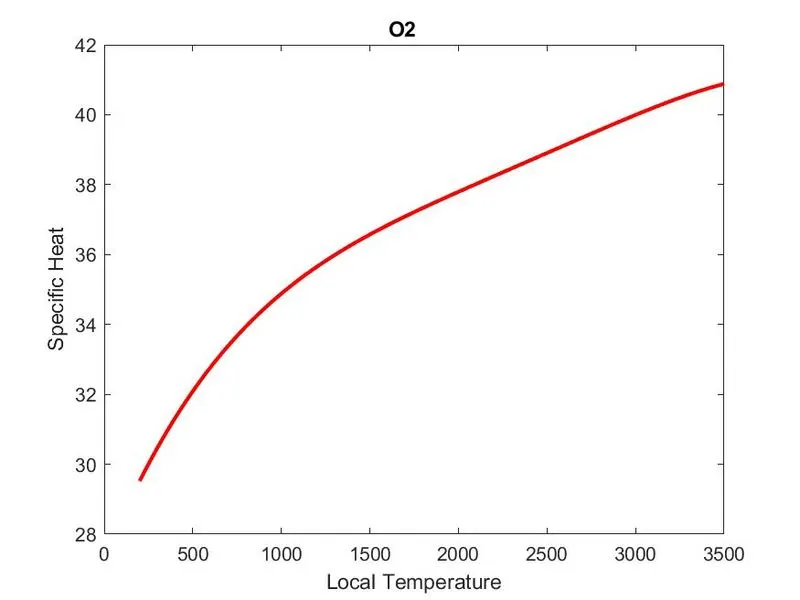
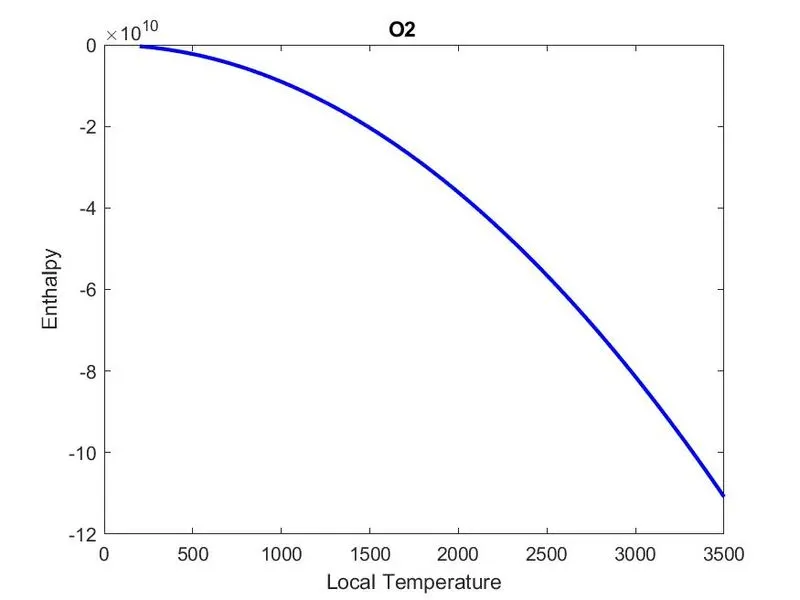
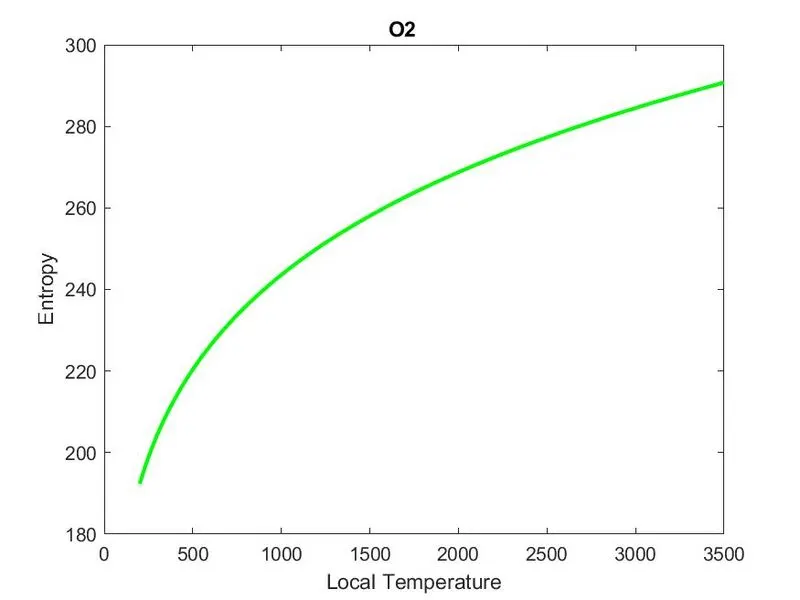
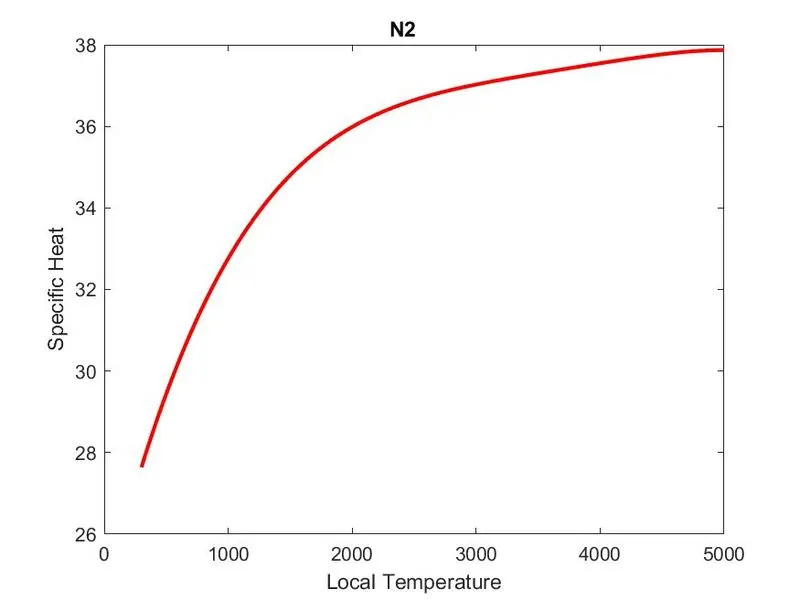
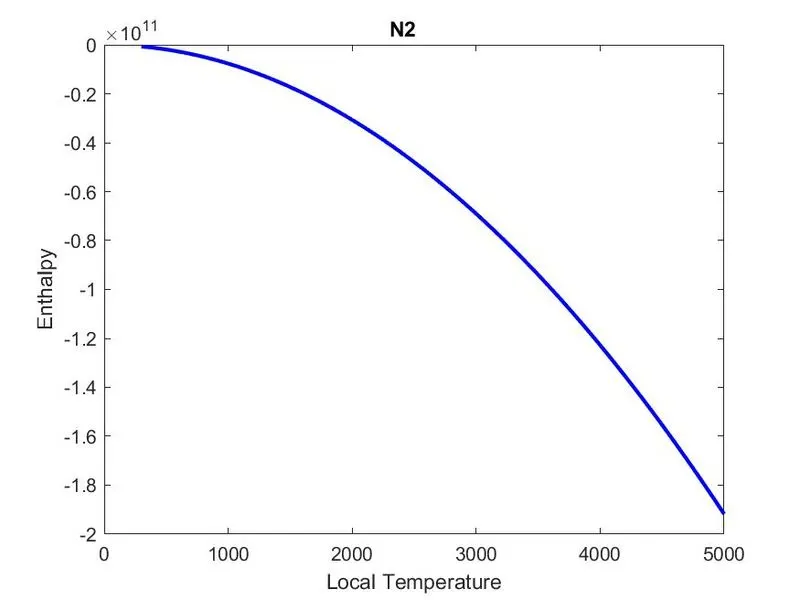
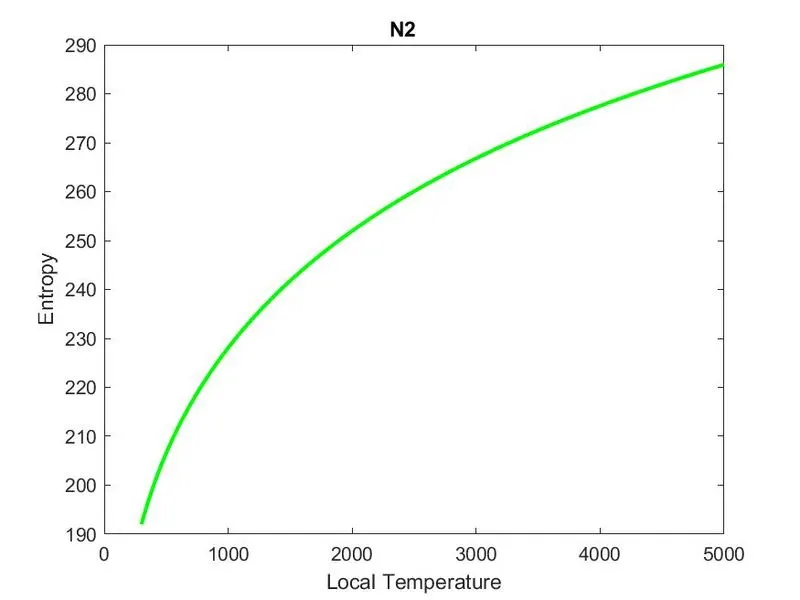
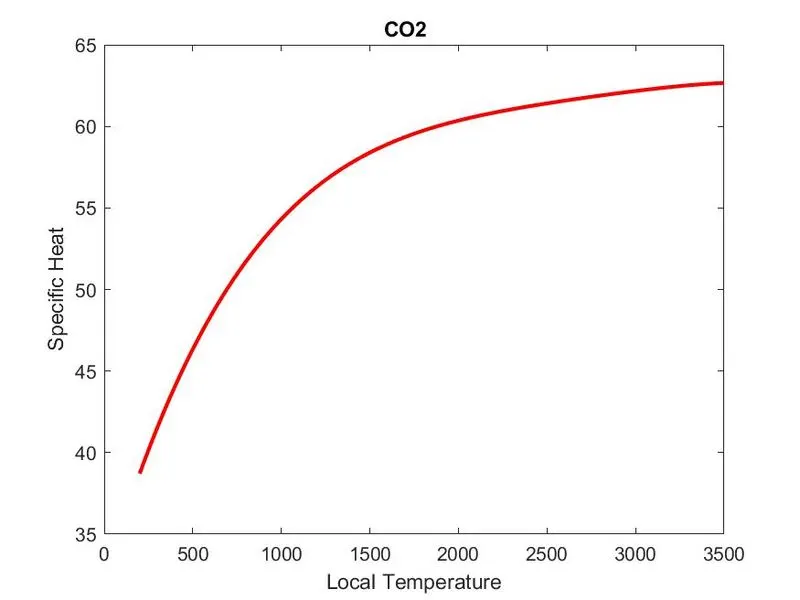
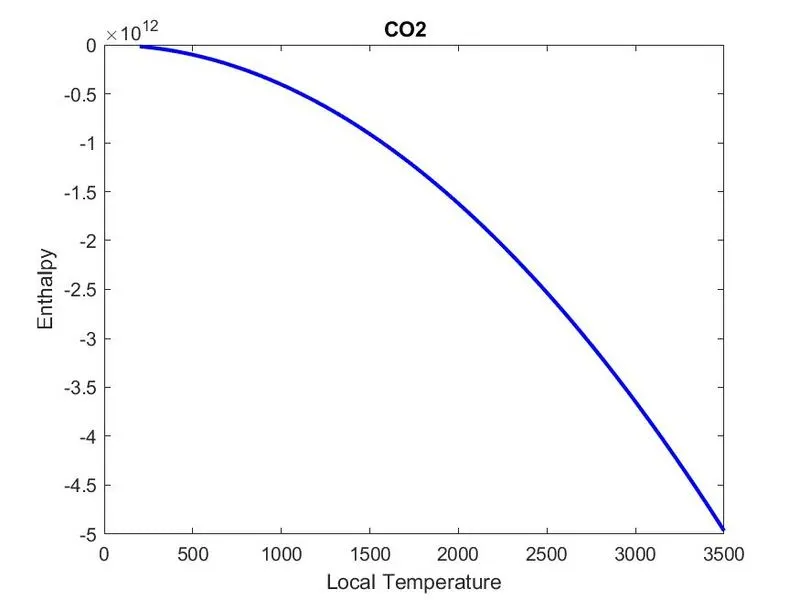
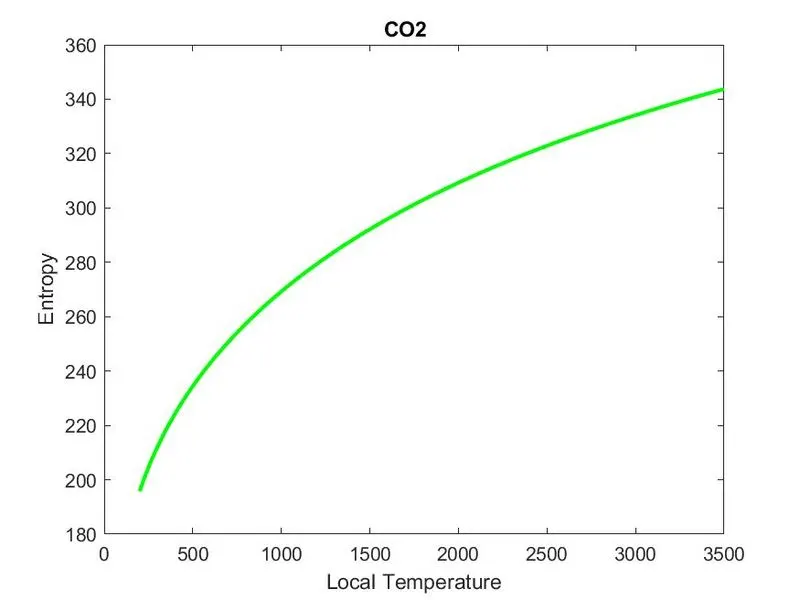
Plot the graphs of Cp vs Temperature, H vs Temperature and S vs Temperature also save these plots in specific folders automatically.

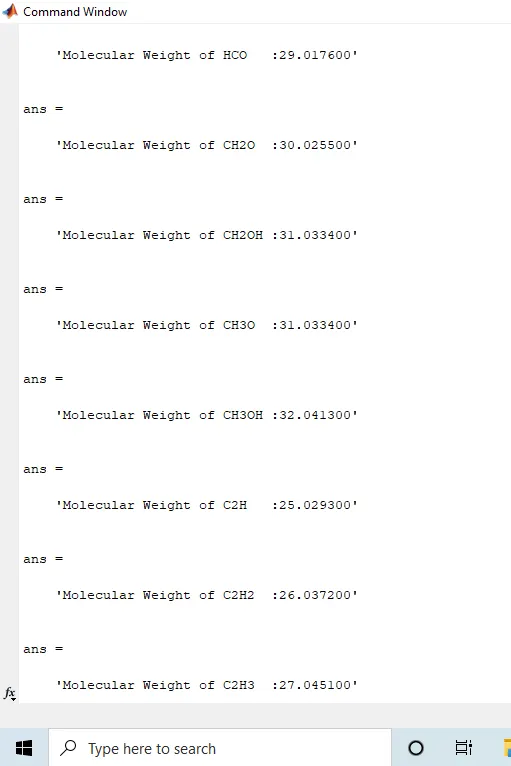
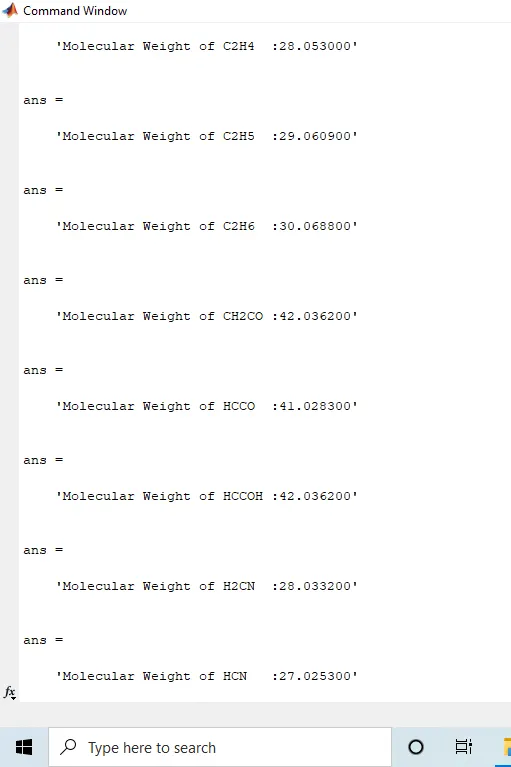
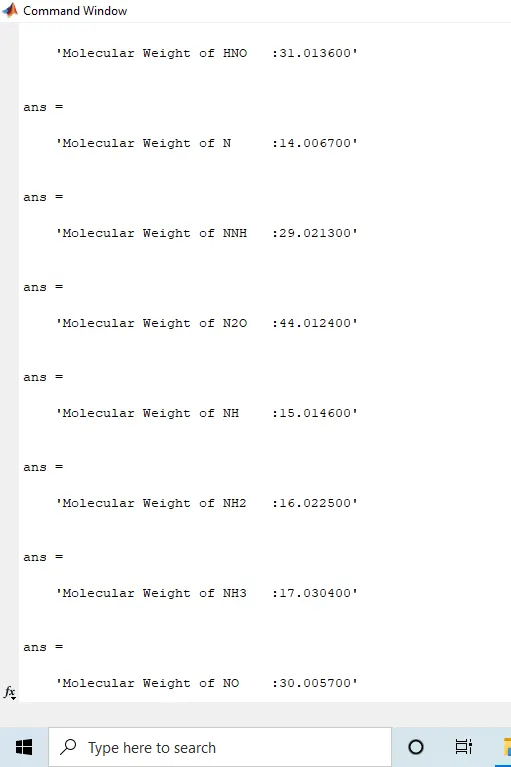
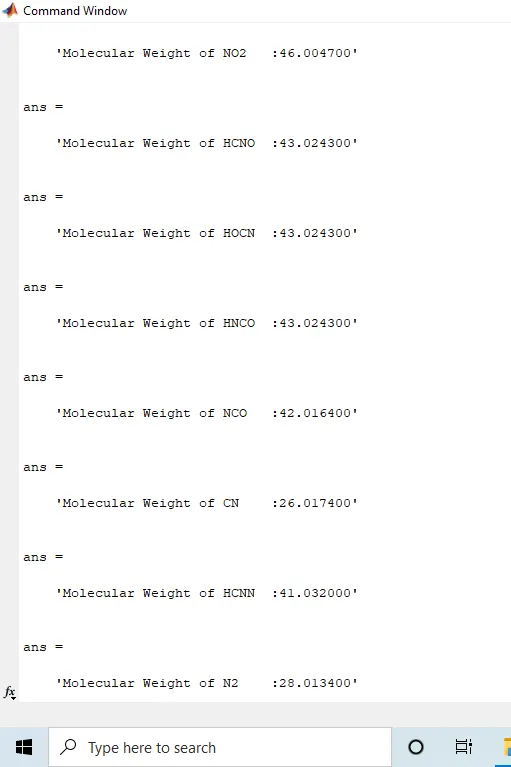
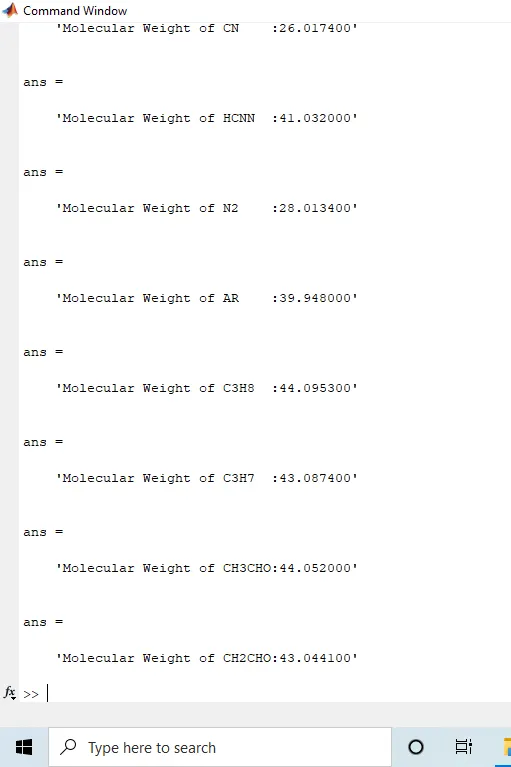
To calculate and display the molecular weight of all the species.

Data

`(Cp)/R = a1 + a2*T+ a3 *T^2+ a4*T^3 + a5*T^5`

`H/(R*T) = a1 + (a2*T)/2 + (a3*T^2)/3 + (a4*T^3)/4 + (a5*T^4)/5 + (a6)/T`

`S/R = a1*log(T) + a2*T + (a3*T^2)/2 + (a4*T^3)/3 + (a5*T^4)/4 + a7`

Theory

In the data each species has 14 temperature coefficients. The first seven are the high temperature coefficient and the next seven are low temperature coefficient. Also for each specie there is unique temperate range known as the local temperature range.

Molecular Weight - The sum of atomic masses of all the atoms in the molecule is known as the molecular mass or molecular weight. E.g. Hydrogen(H) atomic weight = 1.008 and Carbon(C) atomic weight = 12.0107. CH2 is a molecule which consists 1 Carbon atom and 2 Hydrogen atom, therefore its molecular weight is (12.0107)+(1.0008)*2 = 14.0123. Its SI unit is dalton named after John Dalton.

Specific Heat - the quantity of heat required to raise the temperature of one gram of a substance by one Celsius degree is known as the Specific Heat. It is denoted by Cp. The units of specific heat are usually Calories or Joules per gram per Celsius degree.

Enthalpy - When a process occurs at constant pressure, the heat evolved (either released or absorbed) is equal to the change in enthalpy. Enthalpy is the sum of the internal energy and the product of pressure and volume. It is denoted by H. SI unit of enthalpy is Joules per Kilogram.

Entropy - It is a thermodynamic quantity representing the unavailability of a system's thermal energy for conversion into mechanical work, often interpreted as the degree of disorder or randomness in the system. It is denoted by S. Its SI unit is Joule per Kelvin.

Program

Main Program

clear all 
close all
clc

% Opening the file
f = fopen('THERMO.dat','r');

% File Heading
heading = fgetl(f);

% Getting the Global Temperature
global_temp = fgetl(f);
global_temperature = strsplit(global_temp,' ');
% The global temperature array is a string and we need to convert it into
% numbers
global_low_temperature = str2double(global_temperature{2});
global_mid_temperature = str2double(global_temperature{3});
global_high_temperature = str2double(global_temperature{4});

% Skipping the next 3 comment lines
for i = 1:3
    comment = fgetl(f);
end

% Getting the species
% There are total of 53 species in the data, each having 14 temperature
% coefficients and specific local temperature.

for j = 1:53
    species = fgetl(f);
    
    % Getting the species names
    species_name = species(1:6);
    
    % Getting the local temperatures
    species_rows = strfind(species,'G');
    % Finding G to know the positions of the temperatures   
    local_low_temp = str2double(species(46:55));
    local_high_temp = str2double(species(56:65));
    local_mid_temp = str2double(species(66:75));
    
    % Getting the 14 temperature coefficients
    line1 = fgetl(f);
    row1 = strfind(line1,'E');
    a1 = str2double(line1(1:row1(1)+3));
    a2 = str2double(line1(row1(1)+4:row1(2)+3));
    a3 = str2double(line1(row1(2)+4:row1(3)+3));
    a4 = str2double(line1(row1(3)+4:row1(4)+3));
    a5 = str2double(line1(row1(4)+4:row1(5)+3));

    line2 = fgetl(f);
    a6 = str2double(line2(1:row1(1)+3));
    a7 = str2double(line2(row1(1)+4:row1(2)+3));
    a8 = str2double(line2(row1(2)+4:row1(3)+3));
    a9 = str2double(line2(row1(3)+4:row1(4)+3));
    a10 = str2double(line2(row1(4)+4:row1(5)+3));

    line3 = fgetl(f);
    a11 = str2double(line3(1:row1(1)+3));
    a12 = str2double(line3(row1(1)+4:row1(2)+3));
    a13 = str2double(line3(row1(2)+4:row1(3)+3));
    a14 = str2double(line3(row1(3)+4:row1(4)+3));
    
    % Creating new folder to save species data 
    mkdir(['C:UsersaddypDesktopthermofileFile Parsing THERMO',species_name])
    
    % R is universal gas constant
    R = 8.314;
    
    % Creating local temperature matrix for ploting the graphs
    T = linspace(local_low_temp,local_high_temp,100);
    
    % Function for Specific Heat
    Specific_Heat = specific_heat(a1,a2,a3,a4,a5,a8,a9,a10,a11,a12,local_mid_temp,R,T);
    
    % Function for Enthalpy
    Enthalpy = enthalpy(a1,a2,a3,a4,a5,a6,a8,a9,a10,a11,a12,a13,local_mid_temp,R,T);
    
    % Function for Entropy
    Entropy = entropy(a1,a2,a3,a4,a5,a7,a8,a9,a10,a11,a12,a14,local_mid_temp,R,T);
    
    % Plotting the graphs
    
    % Specific Heat vs Local Temperature
    figure(1)
    plot(T,Specific_Heat,'linewidth',2,'color','r')
    title(species_name)
    xlabel('Local Temperature')
    ylabel('Specific Heat')
    
    % Enthalpy vs Local Temperature
    figure(2)
    plot(T,Enthalpy,'linewidth',2,'color','b')
    title(species_name)
    xlabel('Local Temperature')
    ylabel('Enthalpy')
    
    % Entropy vs Local Temperature
    figure(3)
    plot(T,Entropy,'linewidth',2,'color','g')
    title(species_name)
    xlabel('Local Temperature')
    ylabel('Entropy')
    
    % Changing the directory to save the plots in the specific folder
    cd(['C:UsersaddypDesktopthermofileFile Parsing THERMO',species_name])

    saveas(1,'Specific Heat.jpg')
    saveas(2,'Enthalpy.jpg')
    saveas(3,'Entropy.jpg')
    
    % Redirecting the directory where the code is saved.
    % If this step is not done our code will not run.
    cd(['C:UsersaddypDesktopthermofile'])
    
    
    % Function for molecular weight
    Molecular_Weight = molecular_weight(species_name);


end
Explainantion of program
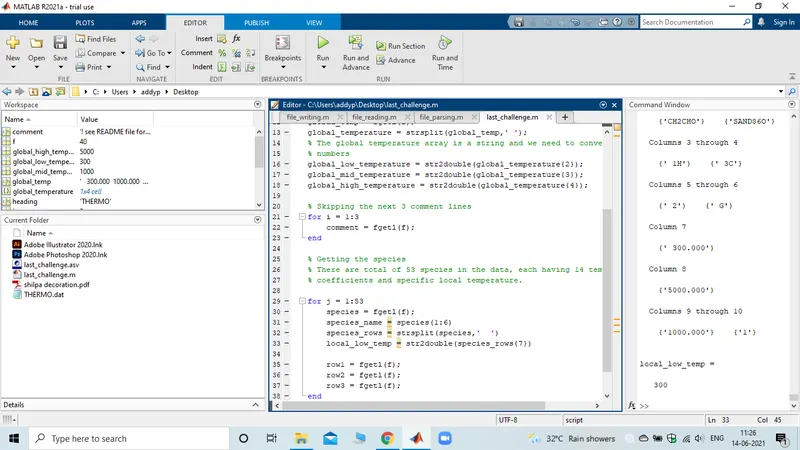
A file named 'THERMO.dat' is provided to us. Before starting the code we need to save this file in the same directory/Location where we are going to save the code.
Command fopen is used to open the file. Here in permission we are giving permission only to read the file by using 'r' in the syntax.
After opening the file for reading only we can get each row from the data by using 'fgetl' command. So here we use fgetl to get the Heading of the file.
After using fgetl another we notice the Global Temperature. This whole line is a string and needs to be sperated. We split the string using 'strsplit' command and sperate the three global temperatures. The string we just spearated cannot be used for futher processing. Hence we convert the splitted string into number. This can be done using 'str2num' or 'str2double' command.
The next 3 lines in the data are comments which can be ignored. Hence for loop is use along with fgetl command to move further.
From here onwards in the data there is a pattern. Every 4 lines contains data of a single species. Hence to iterate further we use a for loop with fgetl command from 1 to 53 as there are total 53 species in the data. But this will not iterate the whole data hence we need to use fgetl 3 more times in the for loop to get the whole data of all the species.
The first fgetl command gives us the first line which has the species name and its local temperature range. The first six columns has the species name which we store in species_name variable. The Local Temperature Range is present after an alphabet G in the string. Hence first we find the position of G in the string using strfind command. After getting the position we can now get the temperatures and convert them into numbers using str2double or str2num command.
In second, third and fourth fgetl command there are temperature coefficients present. Each coefficient has E in it. Using this information we can separate and display each coefficient. First we find for E using strfind then after analyzing we can get the coefficient and convert it into number using str2num or str2double command. This way we can get all the 14 coefficients.
For saving the species data we create a new folder using mkdir command (make directory). After doing this a folder is created which has species_name variable data in it.
Universal Gas constant R is mentioned.
A temperature array T is created using linspace command having 100 intervals which has local temperature of species from low to high.
Specific Heat, Enthalpy and Entropy are found by calling their respective functions.
Graphs of Specific Heat vs Temperature, Enthalpy vs Temperature and Entropy vs Temperature are plotted. It is important to mention a seperate figure for each plot.
All the plots we have made need to be stored in the folder we created before. Hence changing the directory to the folder we created using cd command (change directory). Saving each plot in the specific folder using saveas command.
Since we have changed the directory the code will not execute as the code is saved in different location. We need to change the directory to where the code is saved which can be done using cd command.
Getting the Molecular weight of each species by calling the molecular weight function.
Specific Heat Function
function Cp = specific_heat(a1,a2,a3,a4,a5,a8,a9,a10,a11,a12,local_mid_temp,R,T)

for j = 1:length(T)
    if T(j) > local_mid_temp
        Cp = (a1 + a2*T + a3*T.^2 + a4*T.^3 + a5*T.^4)*R;
    else
        Cp = (a8 + a9*T + a10*T.^2 + a11*T.^3 + a12*T.^4)*R;
    end
end
end
The formula for Cp is written. To plot we need to find the Cp for all values of Temperature (T), this is done using for loop. The only condition here is if the T value is greater than local mid temperature then amongst the 14 coefficient first 7 are to be considered in the formula and if the T value is lower than local mid temperature then the second seven coefficients are to be considered. This is done using if else command. Similar condition and alogirthim is used for the Enthalpy function and Entropy function.
Enthalpy Function
function H = enthalpy(a1,a2,a3,a4,a5,a6,a8,a9,a10,a11,a12,a13,local_mid_temp,R,T)

for j = 1:length(T)
       if T(j) > local_mid_temp
           H = (a1 + (a2*T)/2 + (a3*T.^2)/3 + (a4*T.^3)/4 + (a5*T.^4)/5 + a6*T)*R.*T;
       else
           H = (a8 + (a9*T)/2 + (a10*T.^2)/3 + (a11*T.^3)/4 + (a12*T.^4)/5 + a13*T)*R.*T;
       end
end
Entropy Function
function S = entropy(a1,a2,a3,a4,a5,a7,a8,a9,a10,a11,a12,a14,local_mid_temp,R,T)
 
for j = 1:length(T)
       if T(j) > local_mid_temp
              S = (a1*log(T) + a2*T + (a3*T.^2)/2 + (a4*T.^3)/3 + (a5*T.^4)/4 + a7)*R;
       else
              S = (a8*log(T) + a9*T + (a10*T.^2)/2 + (a11*T.^3)/3 + (a12*T.^4)/4 + a14)*R;
       end
end
end

Function for Molecular Weight
function mm = molecular_weight(species_name)

elements = ['H','C','O','N','A'];
atomic_weight = [1.0079, 12.0107, 15.999, 14.0067, 39.948];

% Considering intial molecular mass = 0
mm = 0;

for x = 1:length(species_name)
    for y = 1:length(atomic_weight)
        if strcmp(species_name(x),elements(y))
           mm = mm + atomic_weight(y) ; 
            position = y;
        end
    end
    n = str2double(species_name(x));
    if n > 1
        mm = mm + atomic_weight(position)*(n-1);
    end
end

sprintf('Molecular Weight of %s:%f',species_name,mm)

end
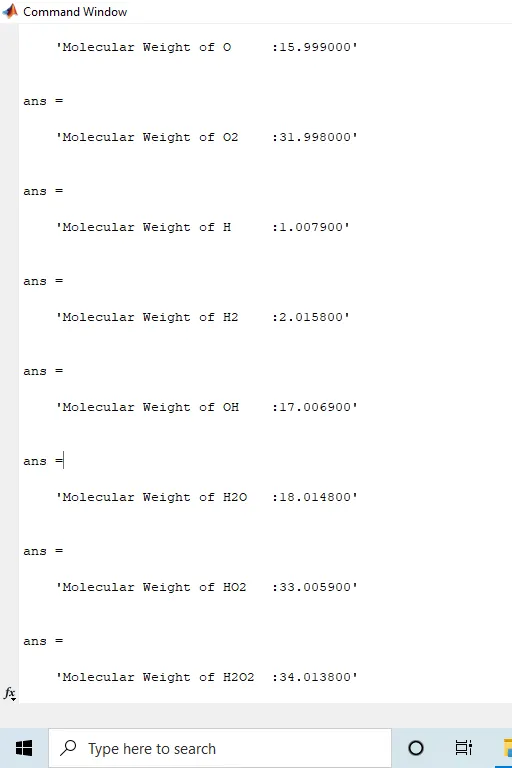
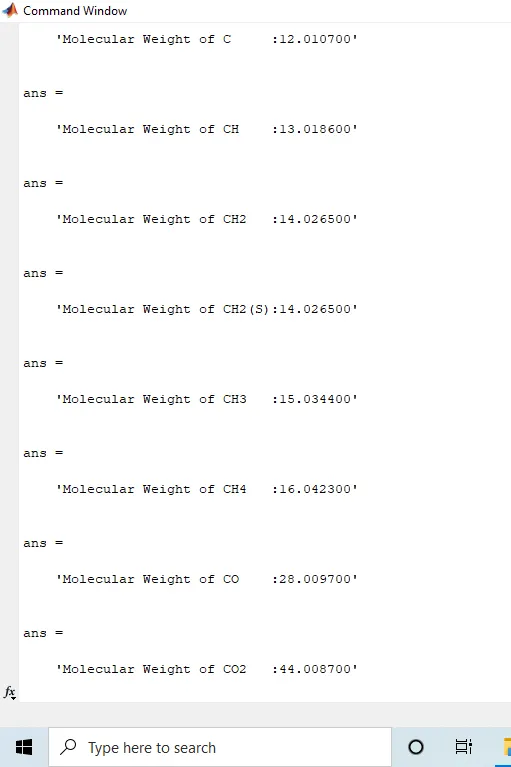
In the function for molecular weight the molecular weight of the species is calculated. By analyzing the data all the atoms in the data are mentioned in an array know as elements. Another array named atomic_weight is created which has corresponding atomic weights of the atoms in the elements array.
Intially considering molecular mass equal to 0. Using for loop to get each column of the species name. Inside this another for loop is introduced which runs till the length of atomic_weight array. Comapring the species_name and elements array using strcmp command. Since we have used nested for loop the loop will end when all columns from the species_name array are compared. Using if command, if the values are matched then the new molecular weight is euqal to the initial molecular weight plus the atomic_weight array value corresponding to the elements array value. The position of the string compared is saved in the position variable.
This deals with the alphabets present in the Species name but in some cases numbers are also present.
To deal with the numbers present. The species_name value(string) is converted to number using str2num or str2double command. This converts only the number present in the string. Since for single atom no number is used. Numbers are only used if a Molecule has more than 2 atoms of same kind. Hence using if command, if n > 1 then the new molecular weight is equal to the previous molecular weight plus atomic weight of position variable value multiply by (n-1)
E.g. Consider H2O
Initial molecular weight = 0
The first part will give the atomic weight value of H, i.e. 1 and stop now molecular weight = previous + atomic weight of Hydrogen = 0 + 1 = 1
Since the second string is number it will be evaluated in the second part of the function where it first is converted from string to number. This is the second string hence n =2 which is greater than 1. This satisfies the if condition. Therefore new molecular weight = previous + hydrogen atomic weight*(n-1) = 1+1(2-1) = 2.
The third string is an alphabet hence it will be evaluated in the 1st part and now molecular weight = previous + atomic weight of oxygen = 2 + 16 = 18
This was the last string hence the loop will stop after this.
Output
Molecular weight of all tge species
Directory where all the plots are saved
Plots of O2
Specific Heat
Enthalpy
Entropy
Plots of N2
Specific Heat
Enthalpy
Entropy
Plots of CO2
Specific Heat
Enthalpy
Entropy
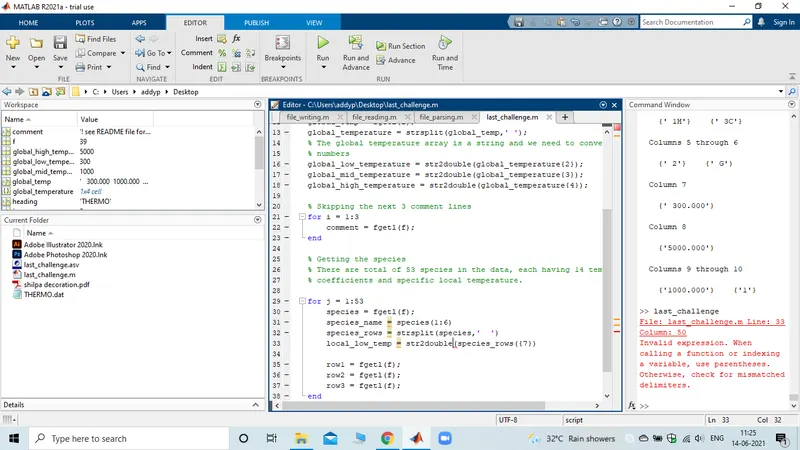
Errors Faced
Parentheses error
Error fixed
Conclusion
Hence we have parse the data file given to us.
We have found all the temperature coefficents for all the species.
We have created plots for Cp vs T, H vs T and S vs T as well as saved the plots in the specific named folders
We have also calculated and displayed molecular weight of all the species.
Refrences
https://www.britannica.com/science/specific-heat
https://chem.libretexts.org/Bookshelves/Physical_and_Theoretical_Chemistry_Textbook_Maps/Supplemental_Modules_(Physical_and_Theoretical_Chemistry)/Thermodynamics/Energies_and_Potentials/Enthalpy#:~:text=Enthalpy%20(H)%20is%20the%20sum,to%20the%20change%20in%20enthalpy.
https://skill-lync.com/projects/NASA-FILE-PARSING-82795
https://www.mathworks.com/help/matlab/ref/mkdir.html
https://www.mathworks.com/help/matlab/ref/cd.html
Your portfolio, next

Ship work like this
in your own course.

Talk to a career counsellor

Free 20-minute call. We'll map the right course to where you want to work.

By submitting you agree to our Terms and Privacy Policy.

Talk to a career counsellor

Free 20-minute call. We'll map the right course to where you want to work.

By submitting you agree to our Terms and Privacy Policy.