Project 1 - Parsing NASA thermodynamic data
A. OBJECTIVE:
- Read the file ‘Thermo.dat’ and retrieve the required inputssuch as temperature and coefficient values to calculate Specific Heat(Cp) , Enthalpy (H), Entropy (S).
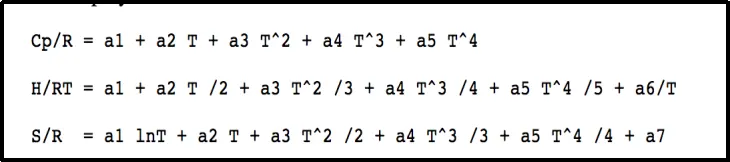
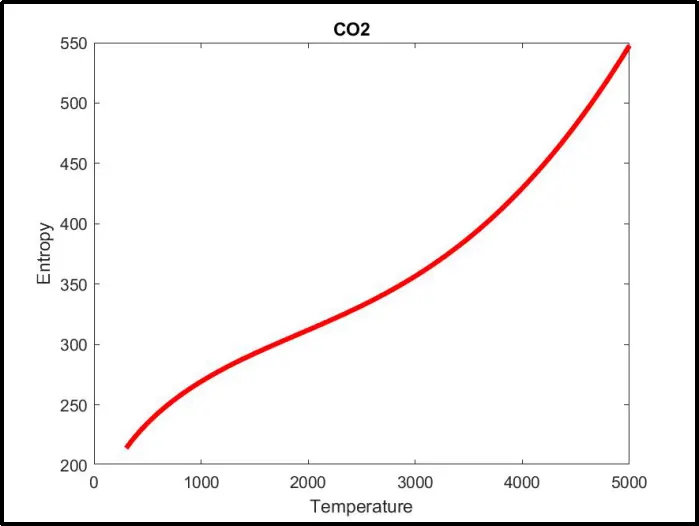
- Plot Cp,H,S vs temperature for each species and save them in dedicated folders for each species.
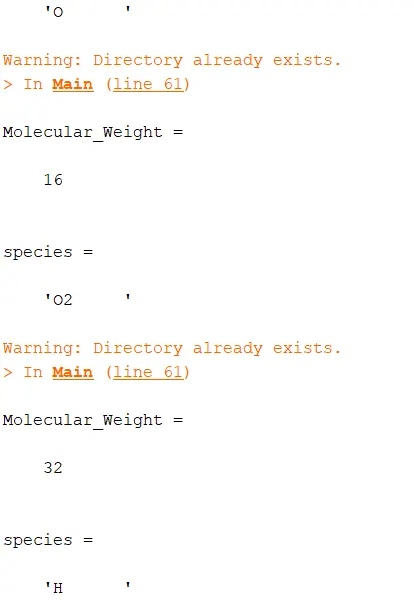
- Calculate molecular weight of each species and display it in command window.
B. TERMINOLOGIES:
File Parsing
Parsing in computer languages refers to syntactic analysis of the input code into its components parts in order to facilitate the writing of compilers and interpreters. It can be used to describe split or separation.
What does it mean to parse a file?
Parsing a file means reading in a data stream of some sort and building an in memory model of the semantic content of that data. This aims at facilitating performing some kind of transformation on the data
C. FLOWCHART
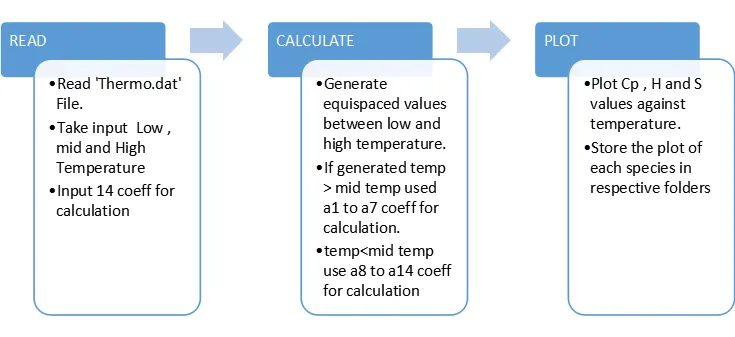
From the given above problem statement and expected outcome the logic can be divided into two phase.
Step 1 : Calculating Values of Cp,H and S
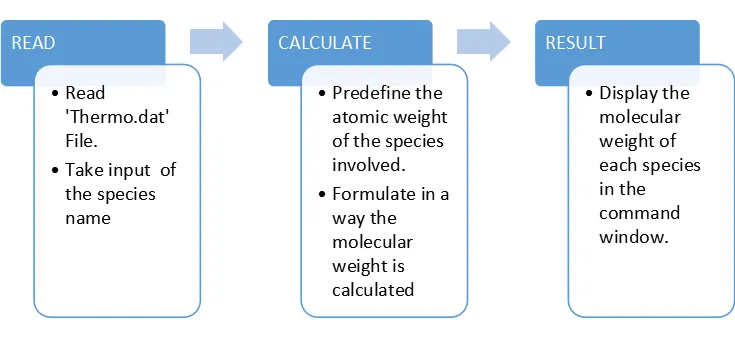
Step 2 : Calculate the Molecular Weight
D. PROGRAMMING IN MATLAB
Part 1
- Clear all,close all,clc command is used to clear data stored in workspace,close plot and figures and clear the command window respectively.
- fopen command was used to open TERMO.dat file in read mode saved in the same directory as the source code.
- The value was then stored in a variable f1.
- temp variable was created to store an array of temperature read using fscanf command from the given file.
- three temperatures the global low,mid and high temperature were then stored in their respective variables.
- The next few lines had to be skipped as the data was not important. This was achieved by a for lop running the command fgetl for 4 times.
clear all
close all
clc

R = 8.314;

f1 = fopen('THERMO.dat','r');
fgetl(f1);
temp = fscanf(f1,'%f',[1 3]);

global_low_temp = temp(1);
global_mid_temp = temp(2);
global_hig_temp = temp(3);

for i=1:4;
    fgetl(f1);
end
Part 2
- For loop was created to run 53 times (the total number of species given is 53)
- Species variable was created to store the species name that took the first 7 characters from the start of a line.
- strfind command was used to find the string 'E' from the values and include the next 3 values succeding it.
- the value was stored in variable A.
- the next 14 individual values are stored in a1,a2.....a14 respectively.
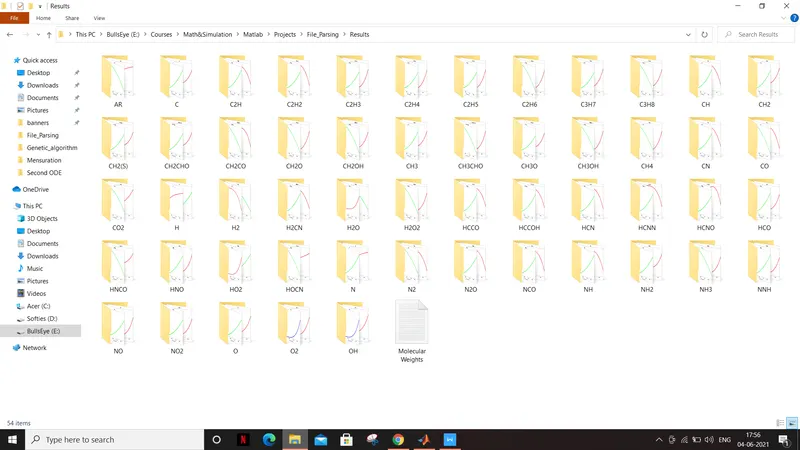
- mkdir command was used to define the path directory to create a folder with the species name for each iteration.
- A variable T was created to store a set of values generated using linspace command ranging from local low and high temperatures.
for i=1:53;
    tline=fgetl(f1);

    species = tline(1:7)

    line1 = fgetl(f1);
    A = strfind(line1,'E');

    a1=line1(1:A(1)+3);
    a1=str2num(a1);
    a2=line1(A(1)+4:A(2)+3);
    a2=str2num(a2);
    a3=line1(A(2)+4:A(3)+3);
    a3=str2num(a3);
    a4=line1(A(3)+4:A(4)+3);
    a4=str2num(a4);
    a5=line1(A(4)+4:A(5)+3);
    a5=str2num(a5);

    line2 = fgetl(f1);
    a6=line2(1:A(1)+3);
    a6=str2num(a6);
    a7=line2(A(1)+4:A(2)+3);
    a7=str2num(a7);
    a8=line2(A(2)+4:A(3)+3);
    a8=str2num(a8);
    a9=line2(A(3)+4:A(4)+3);
    a9=str2num(a9);
    a10=line2(A(4)+4:A(5)+3);
    a10=str2num(a10);

    line3 = fgetl(f1);
    a11=line3(1:A(1)+3);
    a11=str2num(a11);
    a12=line3(A(1)+4:A(2)+3);
    a12=str2num(a12);
    a13=line3(A(2)+4:A(3)+3);
    a13=str2num(a13);
    a14=line3(A(3)+4:A(4)+3);
    a14=str2num(a14);

    subfolder_name = species;
    mkdir(['E:\Courses\Math&Simulation\Matlab\Projects\File_Parsing\Results\',subfolder_name]);

    T = linspace(global_low_temp,global_hig_temp,100);
Part 3
- For the number of equispaced temperature values generated a for loop was created.
- A if and else condition was set if the T variable value is less than or higher than the Global mid temperature.
- for the former a1 to a7 values were used for calculation and for the latter a8 to a14.
for j=1:length(T);
        if T(j) < global_mid_temp

            Cp = R*(a1+(a2.*T)+a3.*(T.^2)+a4.*(T.^3)+a5.*(T.^4));
            H = R*T.*((a1+(a2.*T)/2)+(a3.*T.^2)/3+(a4.*T.^3)/4+(a5.*T.^4)/5+a6.*T);
            S = R*(a1*log(T)+a2.*T+(a3.*T.^2)/2+(a4.*T.^3)/3+(a5.*(T.^4)/4)+a7);

        else
            Cp = R*(a8+(a9.*T)+a10.*(T.^2)+a11.*(T.^3)+a12.*(T.^4));
            H = R*T.*((a8+(a9.*T)/2)+(a10.*T.^2)/3+(a11.*T.^3)/4+(a12.*T.^4)/5+a13.*T);
            S = R*(a8*log(T)+a9.*T+(a10.*T.^2)/2+(a11.*T.^3)/3+(a12.*(T.^4)/4)+a14);
        end
    end
Part 4
- For each of the result generated a plot was drawn between
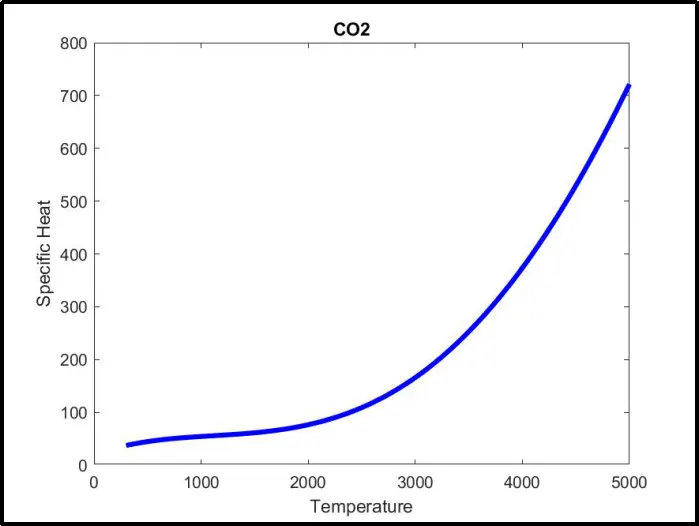
- Temperature and Specific Heat
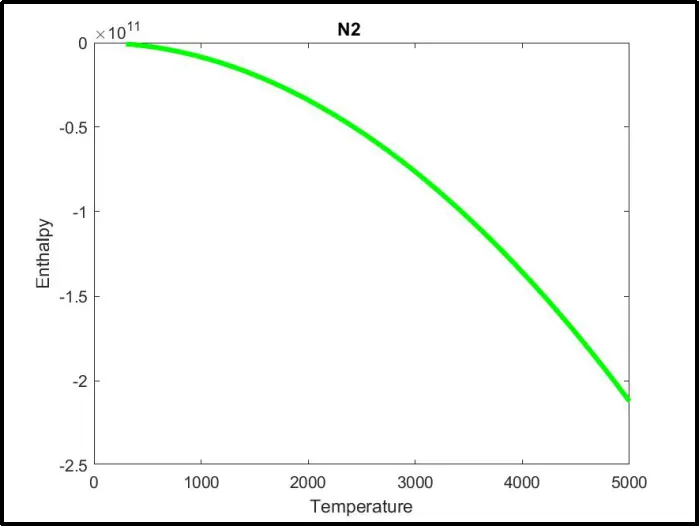
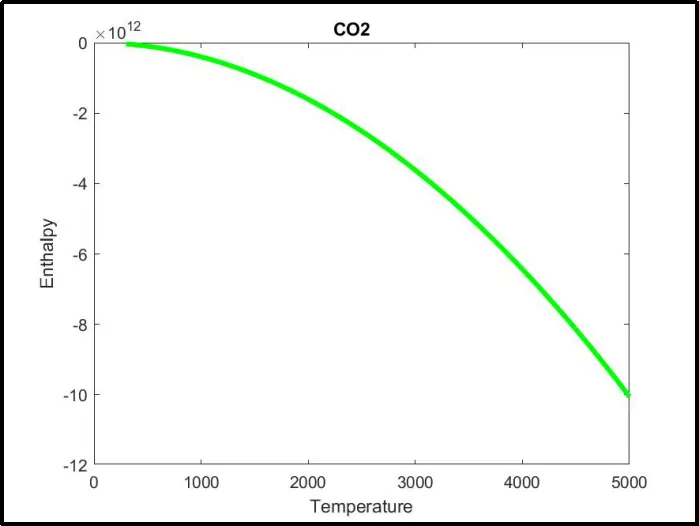
- Temperature and Enthalpy
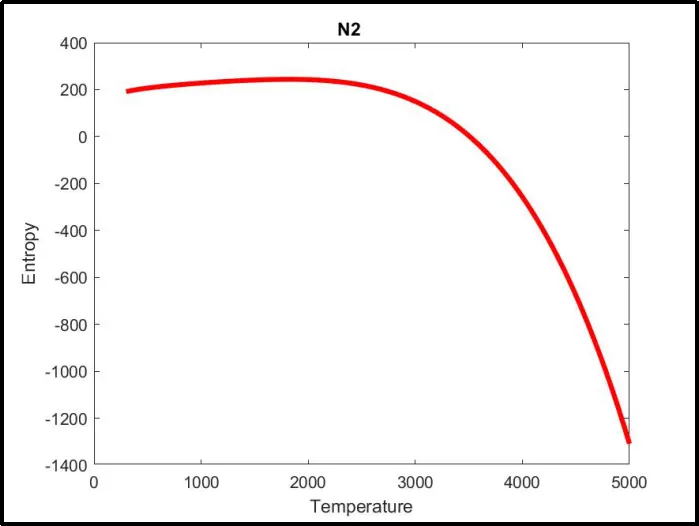
- Temperature and Entropy
- The plotted graph was then saved as picture with .jpeg file extension in the respective species folder.
- Function molecular_weight was called to calculate the weight taking the value stored in species as the input
- the result was genereated on the command window.
 figure(1)
    grid on
    plot(T,Cp,'linewidth',3,'color','b')
    title(species)
    xlabel('Temperature')
    ylabel('Specific Heat')


    figure(2)
    grid on
    plot(T,H,'linewidth',3,'color','g')
    title(species)
    xlabel('Temperature')
    ylabel('Enthalpy')

    figure(3)
    grid on
    plot(T,S,'linewidth',3,'color','r')
    title(species)
    xlabel('Temperature')
    ylabel('Entropy')

    filepath=(['E:\Courses\Math&Simulation\Matlab\Projects\File_Parsing\Results\',subfolder_name]);
    cd(filepath)
    saveas(1,'Graph T vs Cp.jpg')
    saveas(2,'Graph T vs H.jpg')
    saveas(3,'Graph T vs S.jpg')

    cd('E:\Courses\Math&Simulation\Matlab\Projects\File_Parsing\Results\');
    Molecular_Weight = molecular_weight(species)

    f2 = fopen('Molecular Weights.txt','a+');
    fprintf(f2,'Molecular Weight of %s is %f n',species,Molecular_Weight);


end
    fclose(f1)
Part 5
- A function with the name molecular_weight was created to calculate the molecular weight of each species.
- The individual elements and their atomic weight were stored in the spec and atomic_weight array respectively.
- A nested for loop was initiated to calculate the weight based on the individual element and the number of times they repeat in the name
function [Molecular_Weight] = molecular_weight(species)

spec = {'H' 'C' 'N' 'O' 'AR'};

atomic_weight = [1 12 14 16 40];

Molecular_Weight = 0;

for i = 1: length(species)
    for j = 1:length(spec)
        if strcmp(species(i),spec(j))
            Molecular_Weight = Molecular_Weight+atomic_weight(j);
            position = j;
        end
    end
    n = str2double(species(i));
    if n>1
        Molecular_Weight = Molecular_Weight + atomic_weight(position)*(n-1);
    end
end
F. RESULTS
- Screenshot of directory
- Plots
- O2
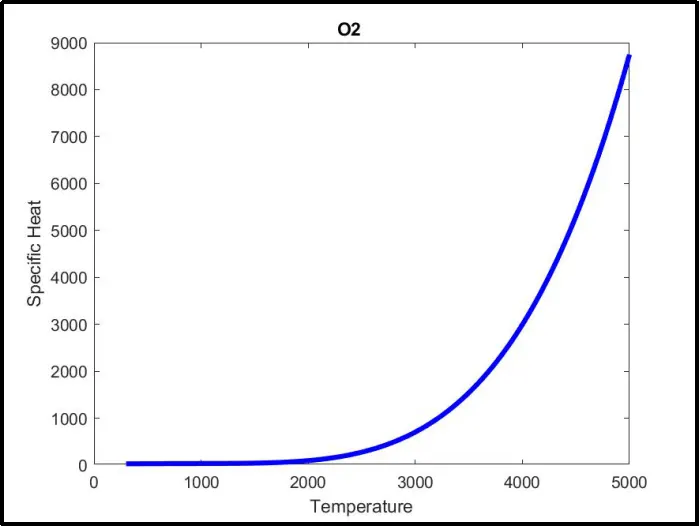
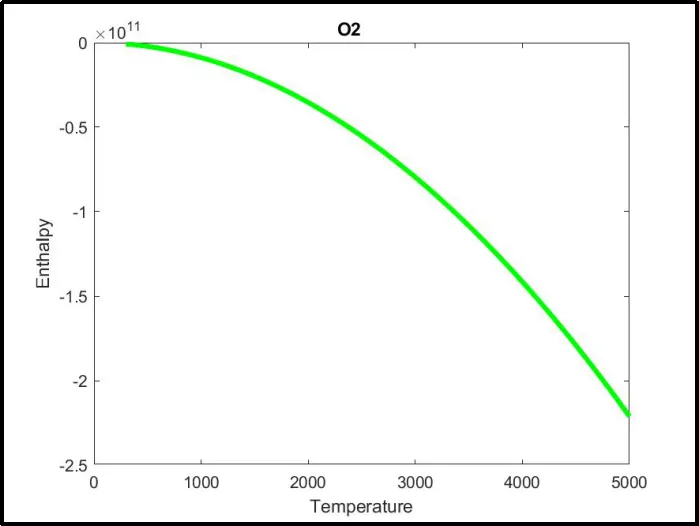
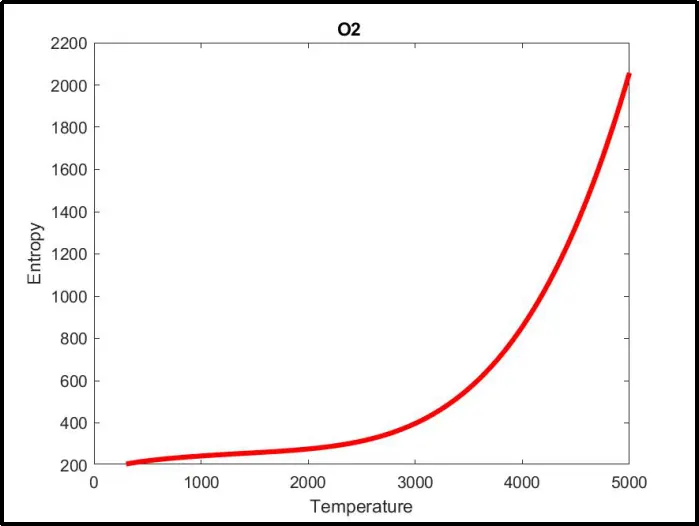
2. N2
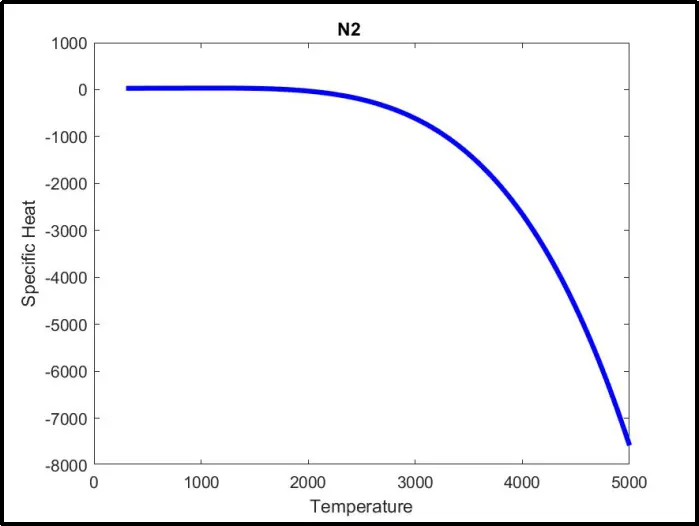
3. CO2
- Molecular weight
G. ERRORS
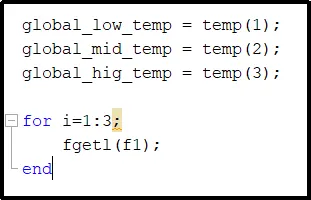
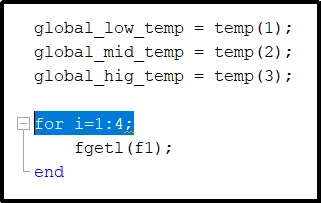
- The loop was to run for 4 times to skip the three lines.
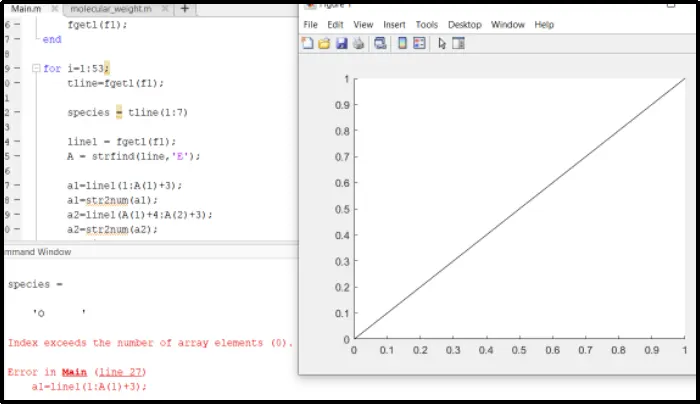
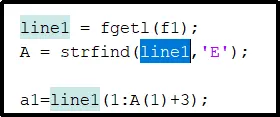
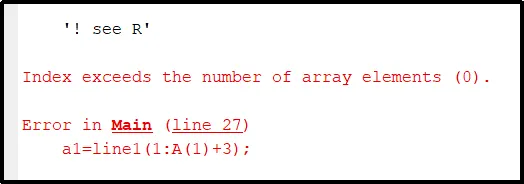
- variable name was entered as 'line' instead of 'line1'
- Few other errors raised while creating a directory which was solved by defining the file path properly.
H. CONCLUSION
- Clear undersatnding of file parsing was achieved
- Use of strfind and other string related command were understood
- Knowledge of loops and function were put to test to attain the desired result.
I. REFERENCE