Project 1 - Parsing NASA thermodynamic data
PROJECT 1 - PARSING NASA THERMODYNAMIC DATA
AIM:
Parsing NASA thermodynamic data, to calculate entropy,enthalpy and the specific heat for all the species in the given file.
OBJECTIVE:
1.Write a code to calculate the cp,S ,H of all the species in the given data file by usung the 14 co-efficient,like for first 7 co-efficient are high-temperature coefficient and the second 7 coefficient are low -tempearture coefficient.use local temperature for every species.
2. Calculate the molecular weight of each species.
3. Plot the Cp, Enthalpy and Entropy for the local temperature range (low temperature : high temperature) specific for each species.
4. Save the plots as images with appropriate names and dump them in separate folders for each species with suitable name. All these should be generated automatically.
5. The main program that you will submit will just take the "THERMO.dat" file as an input and generate Cp, H and S plots.
THEORY:
PARSING:
Parse essentially means to ''resolve (a sentence) into its component parts and describe their syntactic roles''. In computing, parsing is 'an act of parsing a string or a text'. File parsing in computer language means to give a meaning to the characters of a text file as per the formal grammar
The term is used in the analysis of the computer language, refeering to the syntactic analysis of the input code into its component parts in order to faciliate the order of the compilers and interpreters.
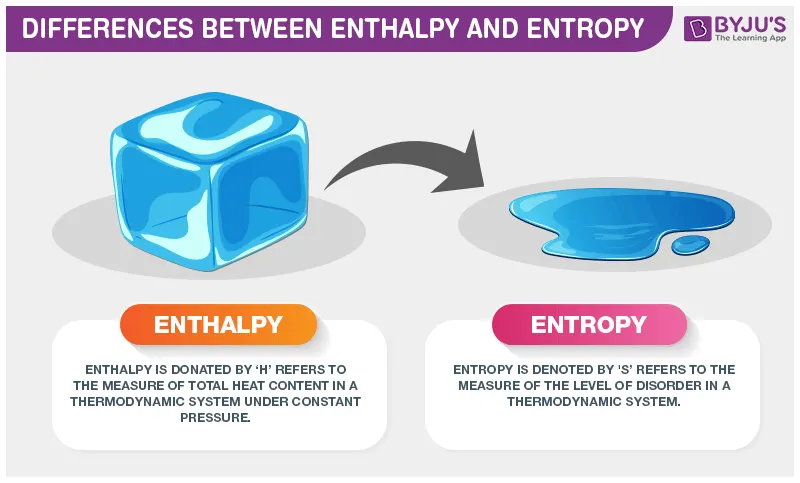
Here with the given gata we are just finding out the enthalpy, entropy,and the speciifc heat.
The above equations gives the value of the specific_heat , enthapy, entropy.
Here R - Universal gas constant;
T - temperature;
a1,a2,a3,a4,a5 are the co-efficients of tempearture.
PROGRAM/CODE:
%Parsing the NASA thermodymanic data.
clear all
close all
clc
%opening the data file
data = fopen('THERMO.dat','r'); %to read the data file.
%to eliminate the first five lines.
fgetl(data);
fgetl(data);
fgetl(data);
fgetl(data);
fgetl(data);

for k=1:53
%extracting the name and Temperature
cp = 0;
H = 0;
S = 0;
tline = fgetl(data); %starts initiatinfg from the 6 line
species = strsplit(tline,' ');  %splits the line with the character
species_name= species{1};   %giving the species name
%local temperature of the species
t_low= str2double(species{end-3});
t_mid= str2double(species{end-1});
t_high= str2double(species{end-2});
Temperature = (t_low:t_high);

   %R is the universal gas constant expressed in (j-k-1mol-1)
   R = 8.314;

   %extracting the Co-Efficients
tline1 = fgetl(data);
a_coeff = strfind(tline1,'E'); %this will seperate the number with letter 'E'
a1 = tline1(1:a_coeff(1)+3); %adding +3 after the letter E
a1 = str2double(a1); %converting string to double
%As the code follows for the other Co_efficients
a2 = tline1(a_coeff(1)+4:a_coeff(2)+3);
a2 = str2double(a2);
a3 = tline1(a_coeff(2)+4:a_coeff(3)+3);
a3 = str2double(a3);
a4 = tline1(a_coeff(3)+4:a_coeff(4)+3);
a4 = str2double(a4);
a5 = tline1(a_coeff(4)+4:a_coeff(5)+3);
a5 = str2double(a5);

tline2 = fgetl(data);%goes for the 8 line and take next 5 coefficients values
a2_coeff= strfind(tline2,'E');
a6 = tline2(1:a2_coeff(1)+3);
a6 = str2double(a6);
a7 = tline2(a2_coeff(1)+4:a2_coeff(2)+3);
a7= str2double(a7);
a8 = tline2(a2_coeff(2)+4:a2_coeff(3)+3);
a8= str2double(a8);
a9 = tline2(a2_coeff(3)+4:a2_coeff(4)+3);
a9= str2double(a9);
a10 = tline2(a2_coeff(4)+4:a2_coeff(5)+3);
a10= str2double(a10);

%taking the 9 line and take next4 coefficients values
tline3 = fgetl(data);
a3_coeff = strfind(tline3,'E');
a11 = tline3(1:a3_coeff(1)+3);
a11 = str2double(a11);
a12 = tline3(a3_coeff(1)+4:a3_coeff(2)+3);
a12 = str2double(a12);
a13 = tline3(a3_coeff(2)+4:a3_coeff(3)+3);
a13 = str2double(a13);
a14 = tline3(a3_coeff(3)+4:a3_coeff(4)+3);
a14 = str2double(a14);


a =[a1 a2 a3 a4 a5 a6 a7 a8 a9 a10 a11 a12 a13 a14]; %assigning all the co-efficient in to the variable a and storing it in an array
i = 1;
for T = (t_low:t_high)  %used to five the local_temperature range

    if T <= t_mid   %first 7 high temp and the next 7 are low temp.
        %if condition is used to specify this.
        a1=a(8);
        a2=a(9);
        a3=a(10);
        a4=a(11);
        a5=a(12);
        a6=a(13);
        a7=a(14);

    else
        a1=a(1);
        a2=a(2);
        a3=a(3);
        a4=a(4);
        a5=a(5);
        a6=a(6);
        a7=a(7);
    end
  %equations to calculate the specific heat,enthalpy,entropy
cp(i) = (a1+(a2*T)+(a3*T^2)+(a4*T^3)+(a5*T^4))*R;
H(i) = (a1+(a2*(T/2))+(a3*((T^2)/3))+(a4*((T^3)/4))+(a5*((T^4)/5))+(a6/T))*(R*T);
S(i) = ((a1*log(T))+(a2*T)+(a3*(T^2)/2)+(a4*(T^3)/3)+(a5*(T^4)/4)+a7)*R;

i = i+1;
end

%finding the molecular weight
elems = ["H","C","N","O","S","A"]; %naming the each species
atomic_masses = [1.00797,12.001,14.0067,15.9994,32.06,39.948]; %coressponding atomic masses
molecular_weight = 0;
for i = 1:length(species_name) %checking the each letters.
    [num ,status] = str2num(species_name(i)); %if the species name has the number then it will be saved in num and the status will be 1 or else 0
    if (status)
        molecular_weight = molecular_weight+(atomic_masses(n)*(num-1));
    else
        for k = 1:length(elems) %(if the species name is a letter)
            if species_name(i)==elems(k)
                molecular_weight = molecular_weight+atomic_masses(k);
                n=k;
            end
        end
    end
end
M_weight = molecular_weight;
fprintf('molecular_weight of %s : %f/n',species_name,M_weight)%prints in the command window
%saving the plot
mkdir(char(species_name)) %command used to craete a new folder with the species name
figure()    %seperate figure window
plot(Temperature,cp,'linewidth',4)
title('Temperatute vs cp')
xlabel('Temperature')
ylabel('cp')
url1 = sprintf('C:/skill_lync/Documents/MATLAB/Project1.1/%s/Temperature vs cp.jpg',species_name);
saveas(gcf,url1) %saves in above mentioned url

figure()
title('Temperatute vs Enthalpy')
xlabel('Temperature')
ylabel('Enthalpy')
url2 = sprintf('C:/skill_lync/Documents/MATLAB/Project1.1/%s/Temperature vs enthalpy.jpg',species_name);
saveas(gcf,url2)


figure()
title('Temperatute vs Entropy')
xlabel('Temperature')
ylabel('Entropy')
url3 = sprintf('C:/skill_lync/Documents/MATLAB/Project1.1%s/Temperature vs entropy .jpg',species_name);
saveas(gcf,url3)

k = k+4;%moving to the next species


end
PROGRAM LOGIC:
- 'THERMO.dat' file is imported to the program by using the 'fopen' command and the each and every line is read by using the 'fgetl' command.
- Inorder to get the header information we are using the 'strsplit' and the global temperature are fetched.
- Next statement are unneccesary, so we skip these lines by using fgetl command.
- Now the species data is read, hence there are 53 species we are declaring it inside the for loop.
- The species first line contains the species name,and the local temperature and the next 3 lines are the co-efficients
- Hence by using the 'strsplit' command the species name and the temperatures are obtained and the function is well-explained in the code.
- Inorder to get the coefficients we are using 'strfind' where it finds the variable 'E',using this aa a reference we can able to obtain the co-efficients.
- Therefore we are converting the obtained string to double. This logic is explained in the above respective code.
- Next we are storing all the values of the coefficients in the array called 'a'.
- Hence this in accordance that first 7 are high-temperature and the next 7 as the low-temperature ranges,we are using the if-else condition to specify this.
- The values of the cp,H,S are obtained by using the above mentioned equations.
- Next we need to find the 'molecular weight'of the each species and the procedure as follows;
- elems = ["H","C","N","O","S","A"]; %naming the each species
atomic_masses = [1.00797,12.001,14.0067,15.9994,32.06,39.948]; %coressponding atomic masses
molecular_weight = 0;
for i = 1:length(species_name) %checking the each letters.
[num ,status] = str2num(species_name(i)); %if the species name has the number then it will be saved in num and the status will be 1 or else 0
if (status)
molecular_weight = molecular_weight+(atomic_masses(n)*(num-1));
else
for k = 1:length(elems) %(if the species name is a letter)
if species_name(i)==elems(k)
molecular_weight = molecular_weight+atomic_masses(k);
n=k;
end - The above mentioned code is used to calculate the molecular weight of the each species and thus it prints it in the command window.
- 'mkdir' command is used to create the folder and it saves the plot of species automatically.
- Next it plots the graph tempearute vs enthalpy,entropy, and the specific heat.
- Therefore we are giving the directory to save the plots
- Next the increment is given to read the next species.
- (end).
RESULTS:
The molecular weight of the each species as follows;
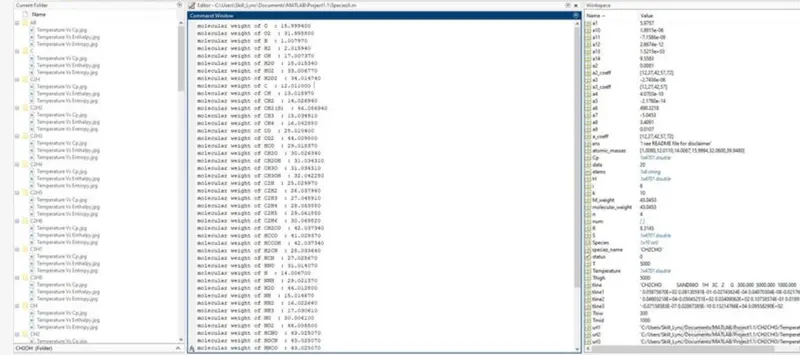
FOLDER HAVING THE PLOT OF EACH SPECIES:

CONCLUSION:
Hence to sum up with all the explanations stated above, the file parsing has been done and the molecular weight has been calculated for the each species and the plots hhave been saved in the seperate folder.