Project 1 - Parsing NASA thermodynamic data
OBJECTIVE:
1. Write a function that extracts the 14 coefficients and calculates the enthalpy, entropy, and specific heats for all the species in the data file. You will be reading this file NASA thermodynamic data(Tip: use fopen and fgetl). The formulae are shown below.
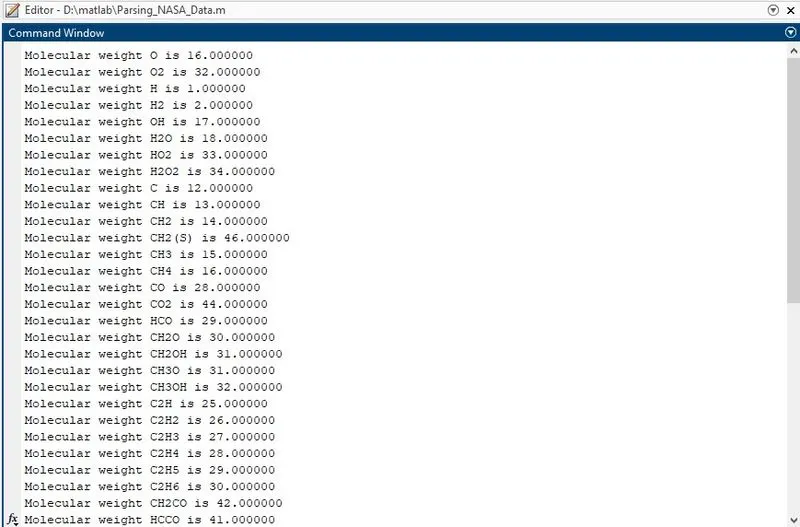
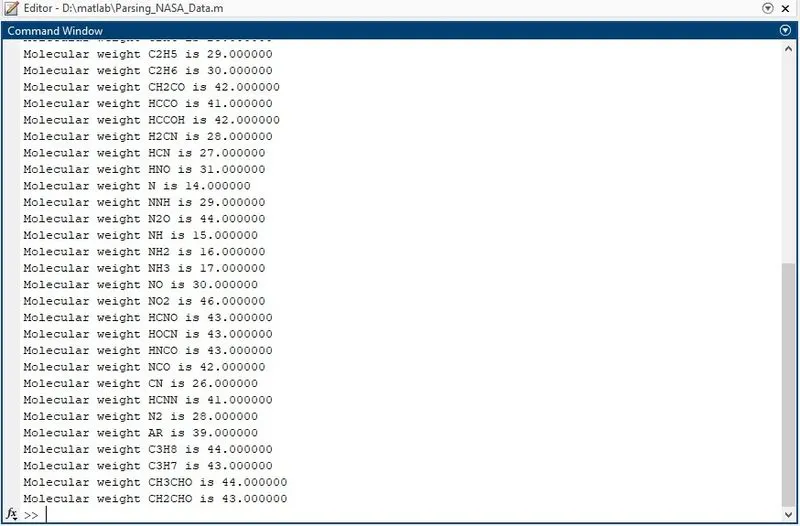
2. Calculate the molecular weight of each species and display it in the command window.
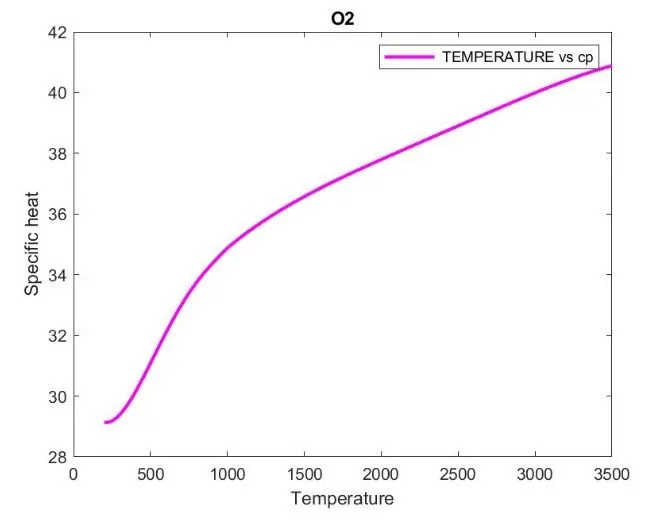
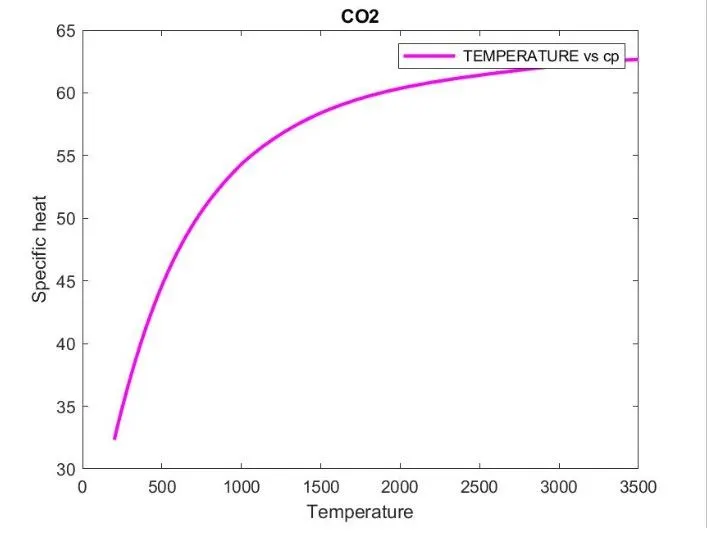
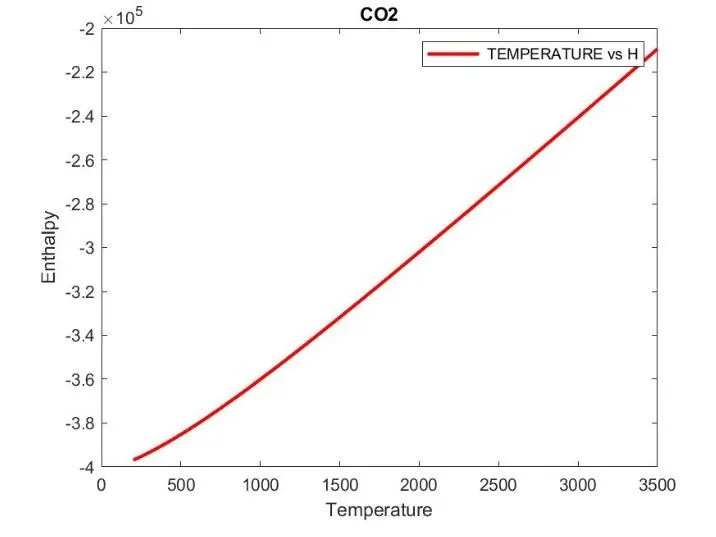
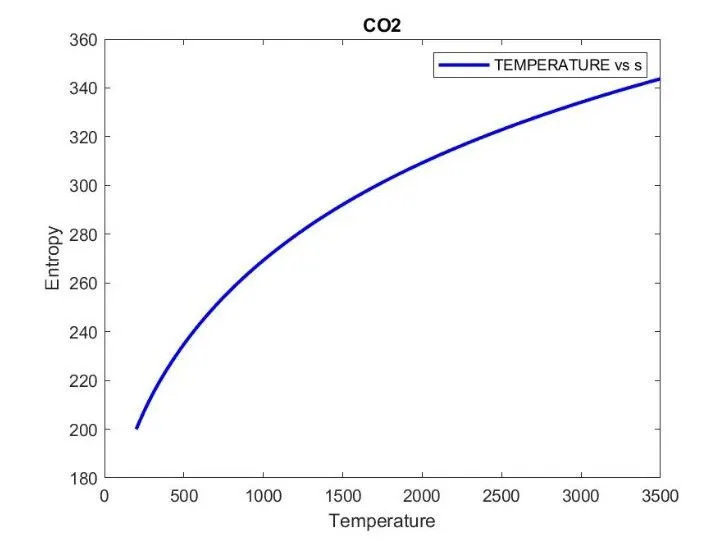
3. Plot the Cp, Enthalpy, and Entropy for the local temperature range (low temperature: high temperature) specific for each species.
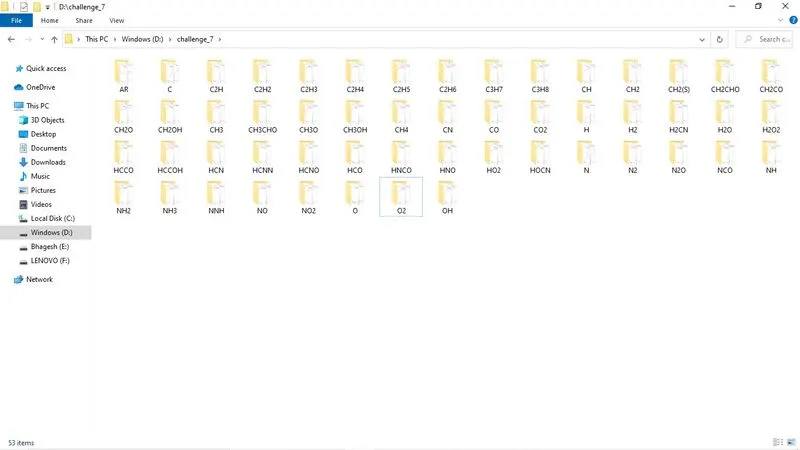
4. Save the plots as images with appropriate names and dump them in separate folders for each species with a suitable name. All these should be generated automatically.
5. The main program that you will submit will just take the "THERMO.dat" file as an input and generate Cp, H, and S plots.
SOLUTION :
- NASA came up with polynomials that can be used to evaluate thermodynamic properties such as Cp, H, and S. They have also documented the coefficients that are required to evaluate these polynomials for 1000+ species.
- we have been provided with the Cp, H, and S formulas

what is File Parsing?
`->` Parse essentially means to ''resolve (a sentence) into its component parts and describe their syntactic roles''. In computing, parsing is 'an act of parsing a string or a text'. [Google Dictionary]File parsing in computer language means to give a meaning to the characters of a text file as per the formal grammar. ''Within computational linguistics the term is used to refer to the formal analysis by a computer of a sentence or other string of words into its constituents, resulting in a parse tree showing their syntactic relation to each other, which may also contain semantic and other information.'' (Wikipedia). A parser is a program that parses the text files.
So let's start the coding for the problem
- Main code
clear
close all
clc

% Opening the NASA Thermo data
fd = fopen('THERMO.dat','r');
line_1 = fgetl(fd);

% Now getting the Global temperature range
global_temp = fgetl(fd);
gt = strsplit(global_temp,' ');
global_low_temp =str2double(gt{2});
global_mid_temp =str2double(gt{3});
global_high_temp =str2double(gt{4});

% Now skipping the next 3 lines
skip_line_3 = fgetl(fd);
skip_line_4 = fgetl(fd);
skip_line_5 = fgetl(fd);

 for i = 1:53
% Parsing the species block

 line_2 = fgetl(fd);
 l2 = strsplit(line_2,' ');
 species_name = (l2{1});
 z = length(l2);
 LOCAL_LOW_TEMP = str2double(l2{z-3});
 LOCAL_HIGH_TEMP = str2double(l2{z-2});
 LOCAL_MID_TEMP = str2double(l2{z-1});


% Universal gas constant(R) & Temeprature(T)
 R = 8.314;
 T = linspace(LOCAL_HIGH_TEMP,LOCAL_LOW_TEMP,1500);

% Extracting HIGH-temperature and LOW-temperature coefficients

line_3 = fgetl(fd);
a = strfind(line_3,'E');
A1 = (line_3(1:a(1)+3));
A1 = str2double(A1);
A2 = str2double(line_3((a(1)+4):(a(2)+3)));
A3 = str2double(line_3((a(2)+4):(a(3)+3)));
A4 = str2double(line_3((a(3)+4):(a(4)+3)));
A5 = str2double(line_3((a(4)+4):(a(5)+3)));

line_4 = fgetl(fd);
b = strfind(line_4,'E');
A6 = str2double(line_4(1:b(1)+3));
A7 = str2double(line_4((b(1)+4):(b(2)+3)));
A8 = str2double(line_4((b(2)+4):(b(3)+3)));
A9 = str2double(line_4((b(3)+4):(b(4)+3)));
A10 = str2double(line_4((b(4)+4):(b(5)+3)));

line_5 = fgetl(fd);
c = strfind(line_5,'E');
A11 = str2double(line_5(1:c(1)+3));
A12 = str2double(line_5((c(1)+4):(c(2)+3)));
A13 = str2double(line_5((c(2)+4):(c(3)+3)));
A14 = str2double(line_5((c(3)+4):(c(4)+3)));

 % Calculation
 for j = 1:length(T)
     if T(j) > LOCAL_MID_TEMP
  Cp(j) = (A1 + A2*T(j) + A3*T(j)^2 + A4*T(j)^3 + A5*T(j)^4)*R;
  H(j) = (A1 + (A2*T(j))/2 + (A3*T(j)^2)/3 + (A4*T(j)^3)/4 + (A5*T(j)^4)/5 + (A6/T(j)))*R*T(j);
  s(j) = (A1*log(T(j)) + A2*T(j) + (A3*T(j)^2)/2 + (A4*T(j)^3)/3 + (A5*T(j)^4)/4 + A7)*R;
     else
  Cp(j) = (A8 + A9*T(j) + A10*T(j)^2 + A11*T(j)^3 + A12*T(j)^4)*R;
  H(j) = (A8 + (A9*T(j))/2 + (A10*T(j)^2)/3 + (A11*T(j)^3)/4 + (A12*T(j)^4)/5 + A13/T(j))*R*T(j);
  s(j) = (A8*log(T(j)) + A9*T(j) + (A10*T(j)^2)/2 + (A11*T(j)^3)/3 + (A12*T(j)^4)/4 + A14)*R;
     end
 end

  mkdir(['D:\challenge_7\',species_name])
   cd(['D:\challenge_7\',species_name])

  % Plotting
 figure(1)
 plot(T,Cp,'linewidth',2,'color','m');
 title(species_name);
 legend(' TEMPERATURE vs cp');
 xlabel('Temperature');
 ylabel('Specific heat');
 saveas(figure(1),'specific heat.jpg');

 figure(2)
 plot(T,H,'linewidth',2,'color','r');
 title(species_name);
 legend(' TEMPERATURE vs H');
 xlabel('Temperature');
 ylabel('Enthalpy');
 saveas(figure(2),'Enathalpy.jpg');

 figure(3)
 plot(T,s,'linewidth',2,'color','b');
 title(species_name);
 legend('TEMPERATURE vs s');
 xlabel('Temperature');
 ylabel('Entropy');
 saveas(figure(3),'Entropy.jpg');

% calculation of molecular wgt

elements = ['H' 'C' 'N' 'O' 'S' 'A'];
atomic_mass = [1, 12, 14, 16, 32, 39];
mw = 0;
       for k = 1: length(species_name)
           for  p = 1: length(elements)
               if strcmp(species_name(k),elements(p))
                   mw = mw + atomic_mass(p);
                    pos = p;
               end
           end
           K = str2double(species_name(k));
               if K>1
                   mw = mw + atomic_mass(pos)*(K-1);
               end

       end
        fprintf('Molecular weight %s is %f \n',species_name,mw)
 end

              fclose(fd);
Code Overview
- Starting with our usual lines clear, close all and clc, to clear the command window, close plots, graphs which were open using the previous code, and to clear the system memory.
- onto next line, we use the 'fopen' command to open the 'Thermo. data' file which is provided to us. to store the data of the file we give it a name and to read from the file we use 'r' and write to file we use 'w', as seen in the code.
- Now using the 'fgetl' command we can get the first line of the file and using the same command we get the other lines of code as well, here the second line is of the global temperature limits, the global high temp, global mid temp, and the global low-temperature limits.
- In the second line, we are using the 'strsplit' command to Split the string or character vector at a specified delimiter and taking the useful information from the line, and using the 'str2double' command to Convert strings into precision values for better processing of the code.
- Now for skipping the 3, 4, and 5 lines using the 'fgetl' command, as they are comments we can just ignore these lines.
- Now the next lines are the lines of the species block which are important to us there total of 53 species blocks present in the data file so we will be using the 'FOR LOOP' and inside this 'for loop' all the data given below is used inside this 'for loop'.
- The next line is the species data line it has the species name and the local temperature limit, so to call it we use 'fgetl' command, and to split the line we use the 'strsplit' command and take the wanted information out of the line like the species name and the local high temp, local mid temp, and the local low-temperature limits.
- Now giving the Universal gas constant(R) & Temperature(T) to the code and creating a temperature array of the local high temp and low temperature for 1001 values.
- Next, Extracting HIGH-temperature and LOW-temperature coefficients from the species block data to do that first we call the line using the 'fgetl' command, and to extract the co-eff from the file we use 'strfind' command, what 'Strfind' does is it find strings within other strings using the delimiter given to it. Here in this case is the 'E' so when using this we the position of 'E' at a certain number in that line.Using this logic "A1 = (line_3(1:a(1)+3))", "A2 = str2double(line_3((a(1)+4):(a(2)+3)))" ,we calculate the coefficients.As we are doing this in the 'For loop' so a total of 53 species block coefficients are been calculated at a time. We will be getting from A1 - A14 coefficients for a single species block.
- After finding the co-eff. from the line, we try to collect the 14 co-eff from the line in this 7 co-eff are higher temp and the other 7 co-eff are low temp coefficients.
- After finding the co-eff. from the line, we move on to calculate the specific heat(Cp), Enthalpy(H), and Entropy(S), we already have the formula with us so we just have to put the coefficients into that formula. For doing that we use a "For loop" for the length of T which temperature limit which is 1500 times the loop will run. In that loop, we will be using the 'if' and 'else' conditions to differentiate between the higher and lower values if the temperature limit is above the local mid-temperature limit.
- Now after calculating the specific heat(Cp), Enthalpy(H), and Entropy(S). They have asked us to save all the plots into a different folder named species block so to do that we have to create a new folder first so we use the "mkdir" command and to change the folder we use the "cd" command by specifying the path and species data to it.
- The next part is of plotting part for that we provide the figure number to the plot and then by using plot command plotting the data and also we are adding additional data into the plotting area like the title, x-label, y-label and legends, etc. Then we have to save the plot we can do that by using the 'saveas' command.
- Now we have to calculate the molecular weight of the elements present in this species block, to do that first we create an array of elements and atomic mass respectively. As shown in the code, then assigning molecular mass= 0 doing this is very important, then creating the for loop for performing the task. Then comparing the values using the 'strcmp'. To print the molecular weight we use 'fprintf' command.
- After that using "fclose" to close the file
Code Explanation by parts.
- Opening the NASA Thermo data
- 'fopen' command to open the file by entering the file-name in the brackets, to store the data of the file we give it a name handle and to read from the file we use 'r' and write to file we use 'w', as seen in the code.
- Then using 'fgetl' to get the lines from the file, so to get the first line we use fgetl.
- Now getting the Global temperature range
- Now getting the second line with 'fgetl' and naming it Global temp as they are the Global temp limits.
- Now that we have an array of the global temps we used 'strsplit' command to split the string or character vector at a specified delimiter and naming it 'gt'
- After splitting the array we can take out the wanted information from that line like the global low temp, global high temp, and global mid temp.
- 'str2double' command to Convert strings into precision values for better processing of the code.
- Now skipping the next 3 lines
- For skipping the next 3 lines we'll just use 'fgetl' 3 times.
- Parsing the species block
- To get all the species block by just running the code single time we'll be using the 'for loop'
- As we start the 'for loop' we use 'fgetl' to get the next line which is the species line and then using the 'strsplit' to split the line into meaningful arrays and taking out the species name and the local temp limits from that line using the logic.
- Now we have to create the temperature array of 1500 values of local low temp and local high temp limits for doing that we have used the 'linspace' command.
- The next step is 'Extracting HIGH-temperature and LOW-temperature coefficients' from the file, so for doing that we'll first call the line by using the 'fgetl' and use the 'strfind' command doing this will gives the position of the pat which we want and then we can use this position number to find the coefficients of the species block E.g "A1 = (line_3(1:a(1)+3))" by using this logic we can find the other co-efficient easily. As we are coding in the for loop we'll getting the 14 coefficients of each species block.
- The first 7 coefficients are the HIGH-temperature coefficients and the next 7 coefficients are Low-temperature coefficients.
- Calculation of specific heat(Cp), Enthalpy(H), and Entropy(S) is the next step, we have created the 'for loop' which will run for the local temperature limits. We already have the formulas of the Specific heat(Cp), Enthalpy(H), and Entropy(S), Now we have to create a 'if' and 'else' conditions to differentiate between the higher and lower values if the temperature limit is above the local mid-temperature limit, we say that if T is greater than local mid temp then run the formulas which contain the HIGH-temperature coefficients or run the Low-temperature coefficients. Then end the loop.
- Creating a new folder to dump the plots.
- 'mkdir' command is used to create a new folder and 'cd' is used for changing the directory
- Plotting of specific heat(Cp), Enthalpy(H), and Entropy(S)
- Plot 1 is for temperature vs Specific heat, where 'figure(1)' command is used to Create a figure window, then by using the 'plot' command, we can plot the temperature vs Specific heat and then adding the X-label and y-label which is used for labeling the x-axis and y-axis.' Title' command to give a title to the plot. 'Saveas' is used to save the plot as jpg in the folder.
- Plot 2 is for temperature vs Enthalpy, where 'figure(2)' command is used to Create a figure window, then by using the 'plot' command, we can plot the temperature vs Specific heat and then adding the X-label and y-label which is used for labeling the x-axis and y-axis.' Title' command to give a title to the plot. 'Saveas' is used to save the plot as jpg in the folder.
- And the same goes for plot 3 which is temperature vs Entropy.
- As we are running this in the loop, we'll get 3 plots of every species block
- calculation of molecular wgt
- First creating a array of elements = ['H' 'C' 'N' 'O' 'S' 'A'] and array of atomic_mass = [1, 12, 14, 16, 32, 39], then assigning the mol mass=0.
- Then creating a two 'for loop' on which will run for species name and the second one will run for elements, and in the second 'for loop' we have to create a 'if' condition where we'll be comparing the values of species and elements array using the 'strcmp' command. After that, we have to perform molecular calculation "mw = mw + atomic_mass(p)"
- Then storing the position with 'pos=p' and then ending the loops.
- Now we have to convert the array of species so that be readable means strings into no. and storing it in "k". ["K = str2double(species_name(k))"]
- Then we'll create one more 'if' condition where if k is greater than 1 then calculate the molecular mass this formula [mw = mw + atomic_mass(pos)*(K-1)], and then ending the loop.
- To print the molecular weight we use 'fprintf' command to print the molecular weight in the command window.
After that using "fclose" to close the file
Output Attachments :
created folder
PLOTS :
1] O2
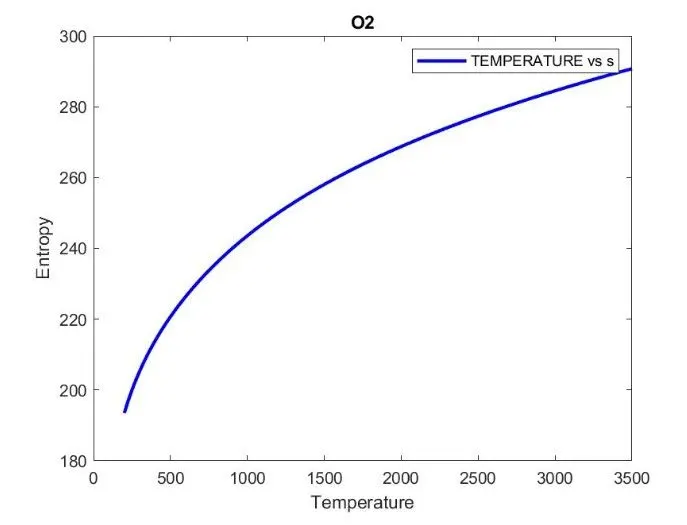
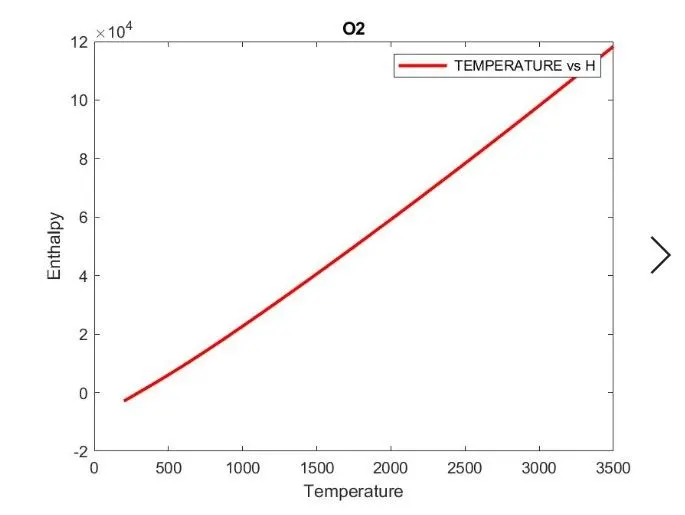
2] N2
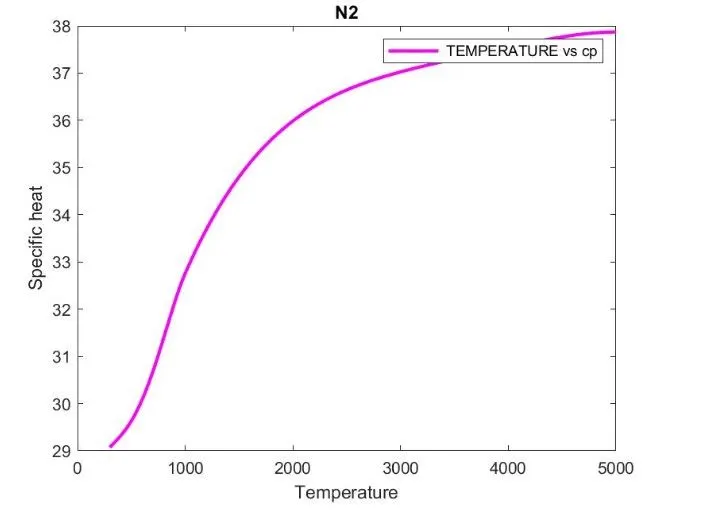
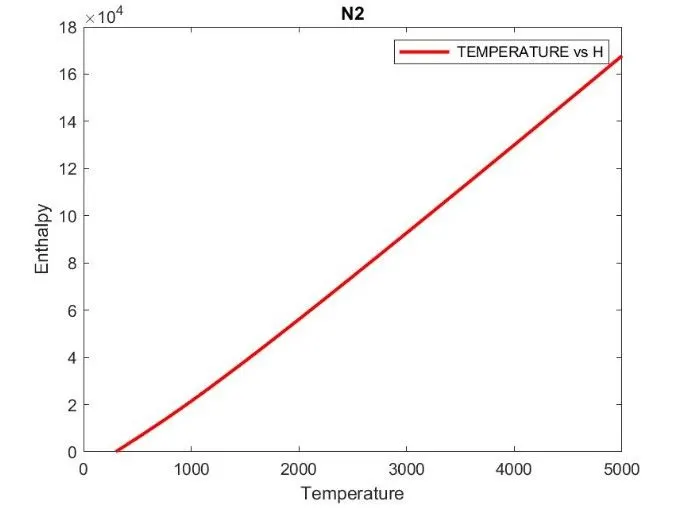
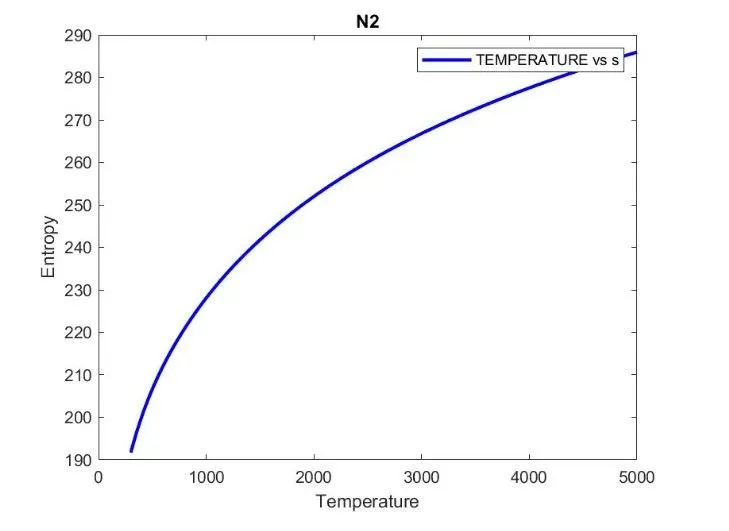
3]Co2
Errors faced while programming:
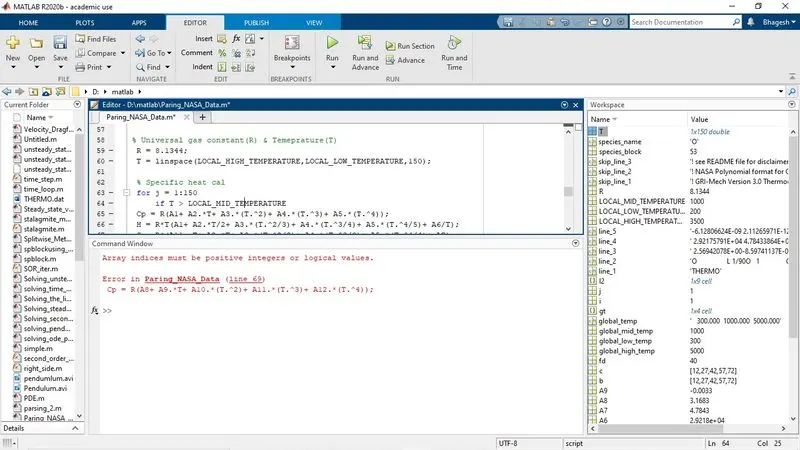
1] In this error says the indices must be positive integers or logical values.
- This error occurred because there was a typing mistake in the formula as well as the brackets and dot operator were not used properly
`->` To overcome this error, I deleted the formula and typed it neatly and used the brackets properly, and then the error was solved.
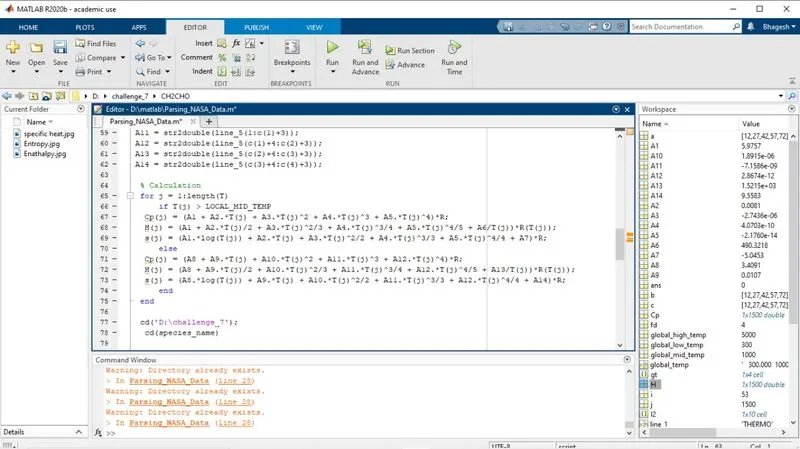
2] This error said that the directory already exists
`->` To overcome this error I just changed the directory to where the code was saved and the code ran successfully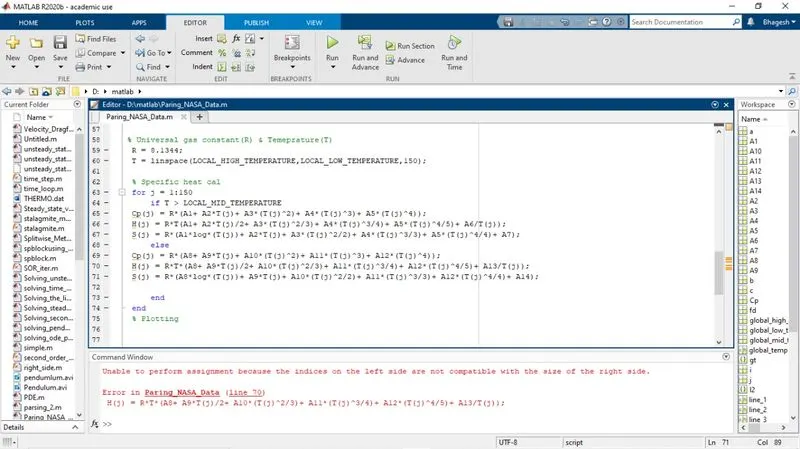 .
.
3] This error said that the left and right indices are not matching
`->` There was a small mistake in the brackets used inside the temperature variables, so to overcome this, the code was properly written checking all the brackets are properly closed.
Displaying molecular weight in the command window