Project 1 - Parsing NASA thermodynamic data
AIM:
To write a MATLAB program to parse NASA thermodynamic data to plot the graphs of Specific heat, Enthalpy and Entropy v/s Temperature of different molecules and also to calculate their molecular mass.
THEORY:
File Parsing:
File parsing is a method used to converting a string of data into other categories of data based on the user’s choice. Parsing helps the data to be converted to different forms for the convenient use of data. Parsing permits to transmute data in a way that can be acknowledged by a particular software. File parsing include file reading in which a predefined data is read into the program and also file writing in which a new data is written into the program.
In this project, NASA thermodynamic file named THERMO.dat containing 1 coefficients of 53 different elements is read into the program to calculate the specific heat, enthalpy ad entropy of each elements at different temperatures.
Specific Heat:
It is the amount of heat per unit mass required to raise the temperature of a substance by one degree. It is expressed in J/kgK.
`Cp=(a_1+a_2 T+a_3 T^2+a_4 T^3+a_5 T^4 )R`
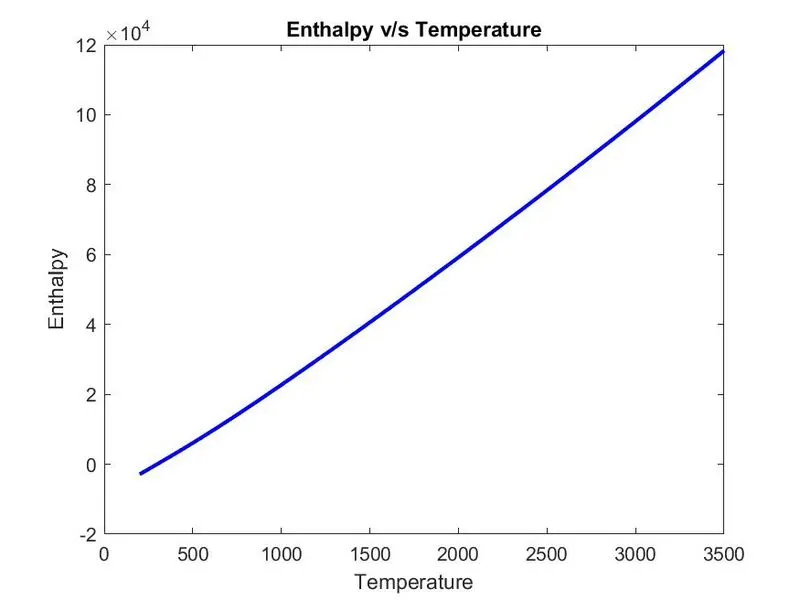
Enthalpy:
Enthalpy is the sum of the internal energy and the product of pressure and volume of a thermodynamic system. It’s value is determined by temperature, pressure and composition of the system and is generally expressed in J/kg.
`H=(a_1+(a_2 T)/2+(a_3 T^2)/3+(a_4 T^3)/4+(a_5 T^4)/5+a_6/T)RT`
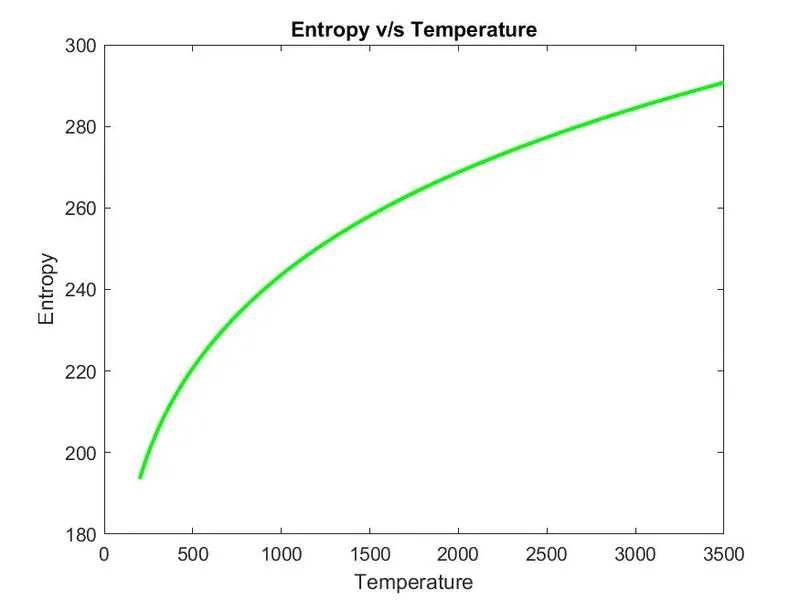
Entropy:
It is a measure of system’s thermal energy per unit temperature that is unavailable for doing useful work. Since it is the number of possible arrangement of the atoms in a system, it is also a measure of the molecular disorder or randomness of the system. It is expressed in J/K.
`S=(a_1 ln(T)+a_2 T+(a_3 T^2)/2+(a_4 T^3)/3+(a_5 T^4)/4+ a_7 )R`
OBJECTIVE:
- To write a function that extracts 14 coefficients for a given species from the given data.
- To write a function to calculate the specific heat, enthalpy and entropy using NASA polynomial data for the given species.
- To write a function to plot Specific heat, Enthalpy and Entropy v/s Temperature for the given species.
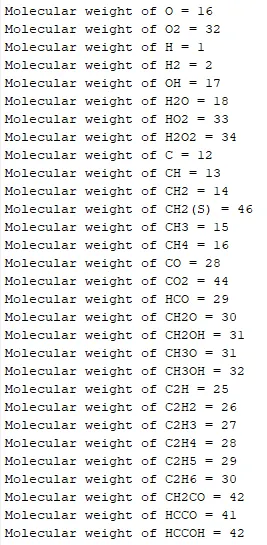
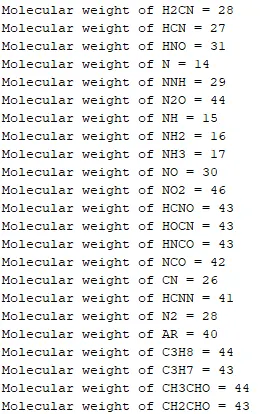
- To write a function to calculate the molecular weight of each species.
PROCEDURE:
- The data from the NASA thermodynamic file is loaded into the program.
- All the 14 coefficients of 1st element are extracted from the data.
- The Cp, H and S are calculated for different temperature in the range of local low temperature and local high temperature.
- The plot of Cp, H and S v/s temperature ids plotted and molecular weight is calculated.
- The same procedure is repeated for all the 53 species.
CODE:
clear all
close all
clc

% Load file
f1 = fopen('THERMO.dat','r');

% Skip first line
fgetl(f1);

% Split the string
b1 = strsplit(fgetl(f1));

% Dtermine global tempratures
global_low_temp = str2num(b1{2});
global_mid_temp = str2num(b1{3});
global_high_temp = str2num(b1{4});
fgetl(f1);

% Skip rhe comments
fgetl(f1);
fgetl(f1);

% Loop to run the program for all variables
for j = 1:53
line1 = fgetl(f1);

%Extract species name
b2 = strsplit(line1);
species_name = b2{1};
m = length(b2);

% Determine local temperature
low_temp = str2num(b2{m-3});
mid_temp = str2num(b2{m-1});
high_temp = str2num(b2{m-2});

% Extract all the coefficients
line2 = fgetl(f1);
b3 = strfind(line2,'E');
a1 = str2num(line2(1:b3(1)+3));
a2 = str2num(line2(b3(1)+4:b3(2)+3));
a3 = str2num(line2(b3(2)+4:b3(3)+3));
a4 = str2num(line2(b3(3)+4:b3(4)+3));
a5 = str2num(line2(b3(4)+4:b3(5)+3));

line3 = fgetl(f1);
b4 = strfind(line3,'E');
a6 = str2num(line3(1:b4(1)+3));
a7 = str2num(line3(b4(1)+4:b4(2)+3));
a8 = str2num(line3(b4(2)+4:b4(3)+3));
a9 = str2num(line3(b4(3)+4:b4(4)+3));
a10 = str2num(line3(b4(4)+4:b4(5)+3));

line4 = fgetl(f1);
b5 = strfind(line4,'E');
a11 = str2num(line4(1:b5(1)+3));
a12 = str2num(line4(b5(1)+4:b5(2)+3));
a13 = str2num(line4(b5(2)+4:b5(3)+3));
a14 = str2num(line4(b5(3)+4:b5(4)+3));

% Input parameters
temp = linspace(low_temp,high_temp,100);
R= 8.314;

% Calculate values for Cp,H and S at different temperatures
for i = 1:length(temp)
    if temp(i) <=mid_temp
        Cp(i) = (a8 + a9*temp(i) + a10*temp(i)^2 + a11*temp(i)^3 + a12*temp(i)^4)*R;
        H(i) = (a8 + a9*temp(i)/2 + a10*temp(i)^2/3 + a11*temp(i)^3/4 + a12*temp(i)^4/5 + a13/temp(i))*R*temp(i);
        S(i) = (a8*log(temp(i)) + a9*temp(i) + a10*temp(i)^2/2 + a11*temp(i)^3/3 + a12*temp(i)^4/4 + a14)*R;

    else
        Cp(i) = (a1 + a2*temp(i) + a3*temp(i)^2 + a4*temp(i)^3 + a5*temp(i)^4)*R;
        H(i) = (a1 + a2*temp(i)/2 + a3*temp(i)^2/3 + a4*temp(i)^3/4 + a5*temp(i)^4/5 + a6/temp(i))*R*temp(i);
        S(i) = (a1*log(temp(i)) + a2*temp(i) + a3*temp(i)^2/2 + a4*temp(i)^3/3 + a5*temp(i)^4/4 + a7)*R;
    end
end

% Save plots as different folder
mkdir(['F:\Matlab work\NASA Thermo'],species_name)
cd(species_name)

% Plotting
figure(1)
plot(temp,Cp,'color','r','linewidth',2)
xlabel('Temperature')
ylabel('Specific Heat')
title('Specific Heat v/s Temperature')
saveas(figure(1),'Cp.jpg')

figure(2)
plot(temp,H,'color','b','linewidth',2)
xlabel('Temperature')
ylabel('Enthalpy')
title('Enthalpy v/s Temperature')
saveas(figure(2),'H.jpg')

figure(3)
plot(temp,S,'color','g','linewidth',2)
xlabel('Temperature')
ylabel('Entropy')
title('Entropy v/s Temperature')
saveas(figure(3),'S.jpg')
cd ..

% Define primary elements andatomic weights
element = ['H','O','C','N','S','AR'];
at_wt = [1 16 12 14 32 40];

% Calculate molecular weight
mol_wt = 0;
for k = 1:length(species_name)
    for p = 1:length(at_wt)
        if strcmp(species_name(k),element(p))
        mol_wt = mol_wt + at_wt(p);
        o=p;
        end
    end

    % Multiple number of same element
        n = str2num(species_name(k));
        if n>1
            mol_wt = mol_wt + at_wt(o)*(n-1);
    end

end

fprintf('Molecular weight of %s = %d\n',species_name,mol_wt)

end
Code Explanation:
- The old data and window is cleared using clear all, close all and clc.
- The data is loaded using fopen and assigned as f1.
- Use fgetl to access next line and strsplit is used to split the string.
- The global temperatures are defined using str2num command.
- Use the fgetl command three times to skip the comment lines and access the species name line of first element.
- Use the strsplit to split the string and define the 1st cell as species_name and also represent the local low, mid and high temperatures using str2num.
- Use fgetl to get the next line and strfind is used to get the position of E.
- Use str2num with appropriate logic to extract the coefficients and repeat the same procedure for the next two lines to get all the 14 coefficients. The 1st seven values are for high temperature and the other seven for low temperature.
- The temperature range is defined using linspace command and also give R value.
- A condition is specified using if else command to calculate Cp, H and S values at both the low temperature and high temperature ranges by splitting the total range at mid temperature. for loop is used to calculate the values for different temperatures.
- The 3 plots are developed in different windows using plot command and they are given title and labels using appropriate commands.
- mkdir and cd commands are used to save the 3 plots in a single folder and saveas is used to save each plot.
- Each primary element common in all species are represented in an array as strings and their atomic weight in another array.
- A for loop and if statement is used along with strcmp command to compare each letter of species name with the elements. The molecular weight is calculated by adding atomic weight of each element and for numeric value between the letter is first converted to number using str2num and another condition is defined so that the atomic weight of the preceding element is multiplied by one value less than the numeric value which is further added to the molecular weight. A for loop is implemented with length of species name to calculate the molecular weight of all the species.
- The same procedure is repeated for all the species using a for loop.
RESULT:
- The three plots of all the species are obtained in separate folders and are stored in a new folder named ‘NASA thermo’.

-
The plots for:
- O2
a. Specific Heat v/s Temperature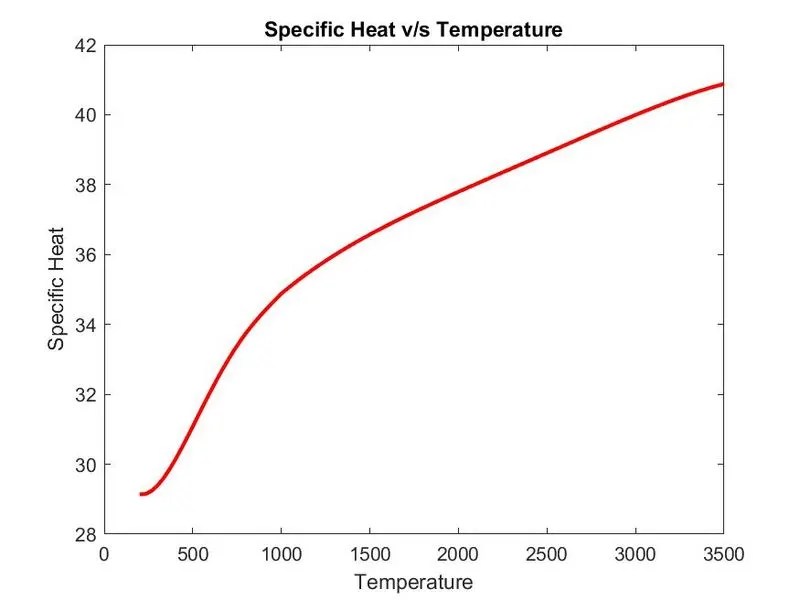
b. Enthalpy v/s Temperature
c. Entropy v/s Temperature
- N2
a. Specific Heat v/s Temperature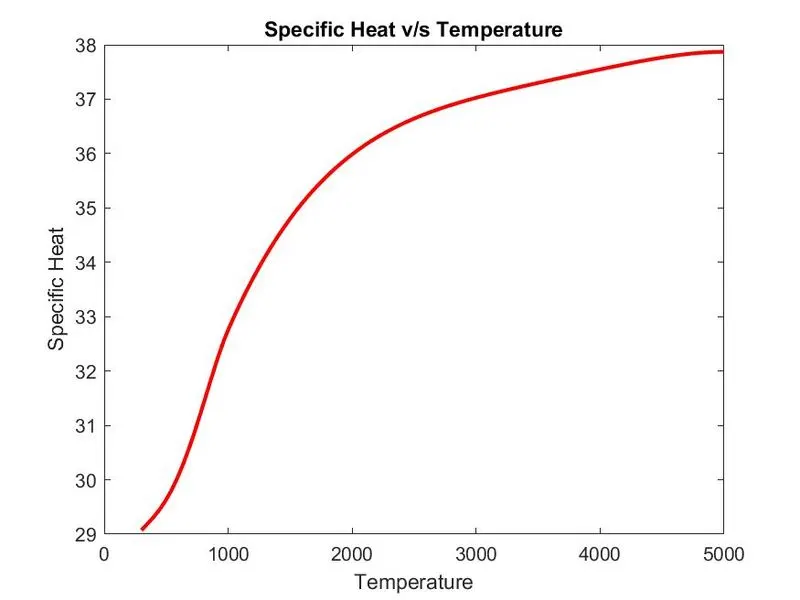
b. Enthalpy v/s Temperature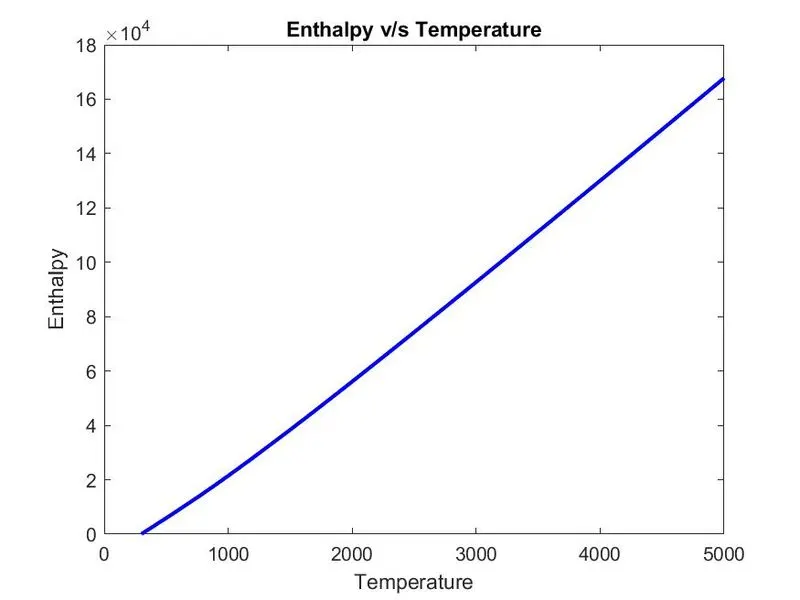
c. Entropy v/s Temperature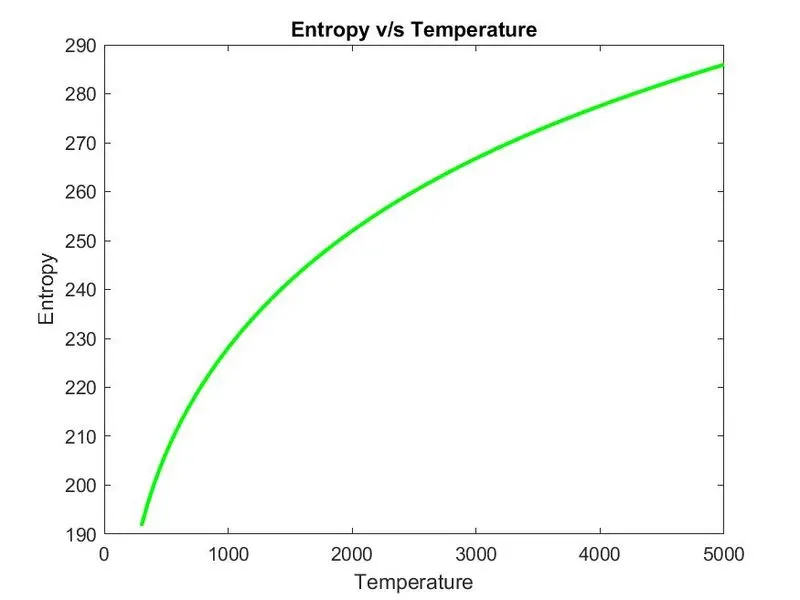
- CO2
a. Specific Heat v/s Temperature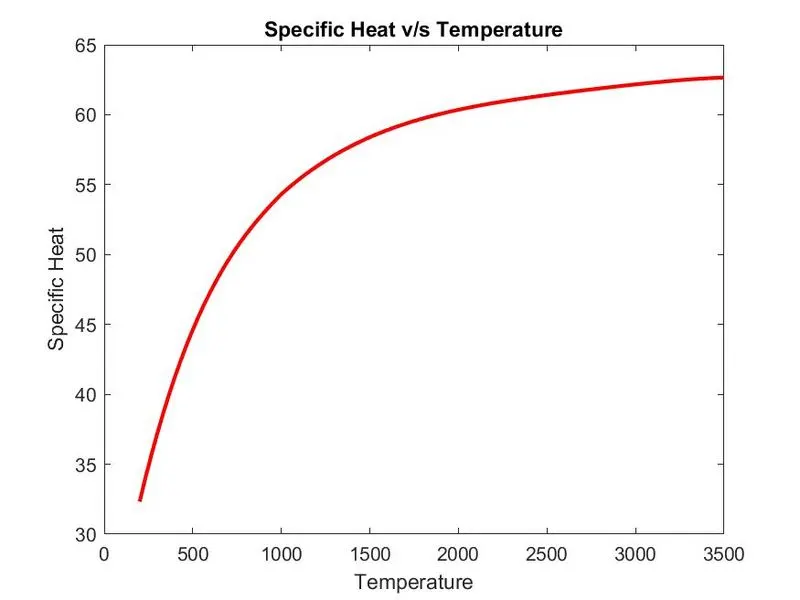
b. Enthalpy v/s Temperature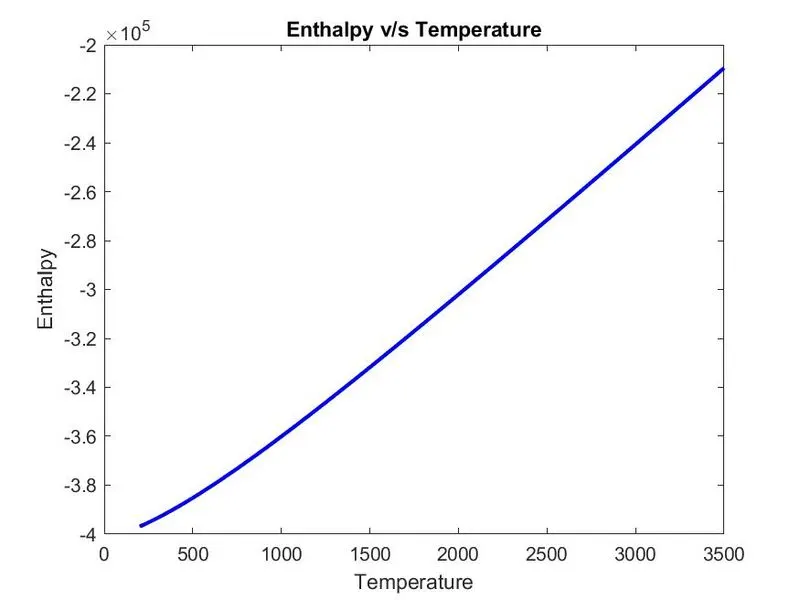
c. Entropy v/s Temperature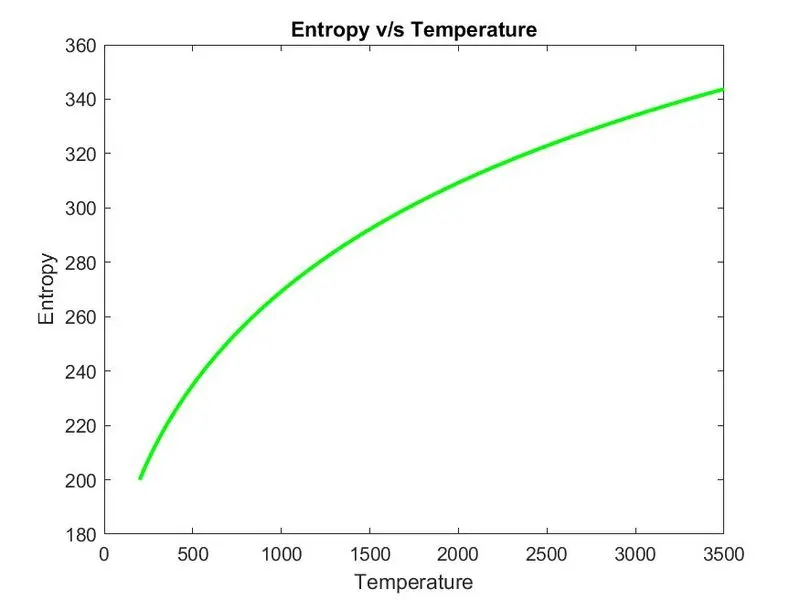
- O2
- The molecular weight of each species is :
CONCLUSION:
- The file parsing of the NASA Thermodynamic data is done .
- Also the plot of Specific heat ,Enthalpy,Entropy v/s Temperature are obtained and the plots are also saved in different folders with their respective names .
- We have calculated the molecular weight of different species and is obtained in the command window .
- After observing these plots ,it is clear that the specific heat of any species is not a constant value,it depends on temperature . Generally,we use constant value for our calculation,but we conclude that the Specific Heat ,Enthalpy,Entropy are temperature-dependent variables . NASA has determined these polynomial values to calculate these properties of each species.
REFERENCE:
https://in.mathworks.com/matlabcentral/answers/317006-create-new-folders-by-mkdir
https://in.mathworks.com/matlabcentral/answers/317006-create-new-folders-by-mkdir
https://in.mathworks.com/matlabcentral/answers/17580-how-to-define-a-path-in-saveas-command