Parsing NASA Thermodynamic Data in MATLAB and Finding Enthalpy, Entropy and Specific heats of the elements. (Matlab/Project 1)
OBJECTIVE :
1. Write a MATLAB Program that extracts the 14 coefficients and calculates the enthalpy, entropy and specific heats for all the species in the data file.
2. Calculate the molecular weight of each species and display it in the command window.
3. Plot the Cp, Enthalpy and Entropy for the local temperature range (low temperature: high temperature) specific for each species.
4. Save the plots as images with appropriate names and dump them in separate folders for each species with a suitable name. All of these should be generated automatically.
5. The main program that you will submit will just take the "THERMO.dat" file as an input and generate Cp, H and S plots.
The Data file is as follows -
https://drive.google.com/file/d/1Q4Nb0Novmy5VdoMwjpzhtQdRll-gTtOg/view?usp=sharing
THEORY :
Data Parsing - is a method where one string of data gets converted into a different type of data. In science and engineering, field data is usually parsed from '.txt.' or '.dat' files. These files inputs or outputs, for example, it can be input file CNC input data, or output data of experiments got from the sensors or instruments readings, or output data by the computational analysis softwares. So, by parsing these experimental data one can use it to understand characteristically behaviour or may for further calculation with governing equations.
In our project, we are parsing NASA's Thermodynamic data.
NASA Thermodynamic Data -
NASA came up with polynomials that can be used to evaluate thermodynamic properties such as Cp, H and S. They have also documented the coefficients that are required to evaluate these polynomials for 1000+ species.
Thermodynamic data for individual species are essential in many chemical reaction applications. For more than a half-century, the NASA Lewis (Currently Glenn) Research Center has been compiling and disseminating thermodynamic data utilization in its chemical equilibrium programs. This data comprehensively used by the thermodynamic community across the globe. Initially, the data had 42 species and now its been accumulated to more than 2000 species. The original NASA CEA program consists of more than 2000 solid, liquid, and gaseous chemical species with their temperatures ranging from 200 to 20 000 K.
In our Project, the data file is consisting of 53 species. And for each species, The First 7-coefficients are High-temperature coefficients and the Next 7-coefficients are Low-temperature coefficients. the general idea or the presentation standard of the data can be seen in the following picture -
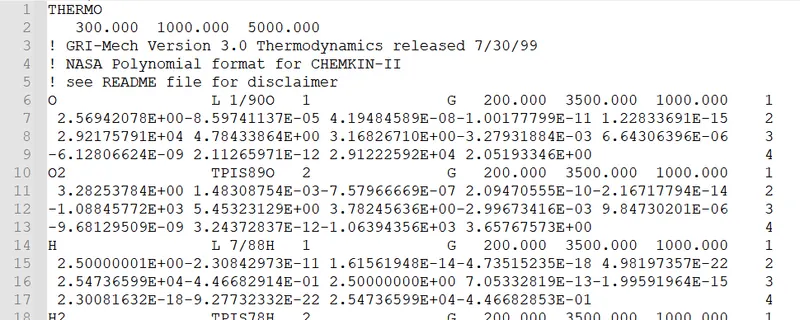
Here, one can see the first line is the heading. The second line gives the values of Global temp. Range (Low, Mid, High respectively). After that the next 3 lines are comments. Then in the sixth line, the first character or word signifies the specie's name and the last 3 values in the line tells the Local Temp. Range of the species. The next three lines give the 14 Temp. Coefficients of the species. And the similar pattern is followed for every species till the END comes.
From those heat coefficients and local temp. of the species, we can calculate the Specific Heat(Cp), Enthalpy(H), and Entropy(S) of the species by using the Relative Polynomial Equations as follows -
`Cp = ( a1+a2*T+a3*T^2+a4*T^3+a5*T^4 )*R`
`H = ( a1+a2*T/2+a3*(T^2)/3+a4*(T^3)/4+a5*(T^4)/5+a6*(T^5)/6 ) * R*T`
`S = ( a1*log(T)+a2*T+a3*(T^2)/2+a4*(T^3)/3+a5*(T^4)/4+a7 )*R`
Where,
Cp = Specific Heat (in KJ/kg.K),
H = Enthalpy (in KJ/kg),
S = Entropy (in KJ/K),
R = Gas Constant = 8.3145 J/K⋅mol,
T = Local Temperature (in K).
CODING LOGIC :
As a usual step, fopen(),close(),fgetl(), ..etc were used for the operations with the file.
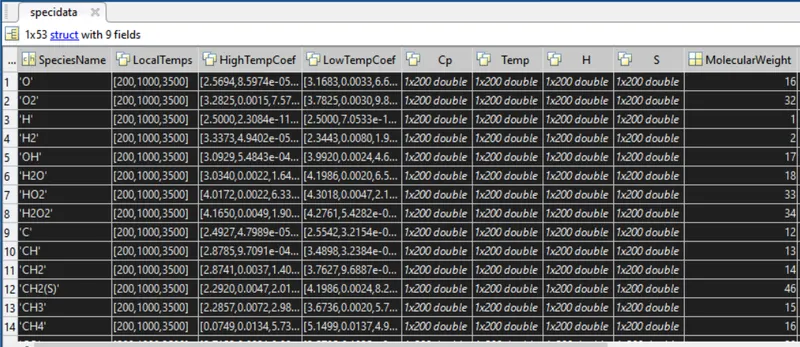
From the data, we can see that it is containing a set of elements and for every element there is a set of properties,i.e. element name, local temps., temp. coefficients. and after receiving this we have to calculate and store the values of Cp, H, and S. Therefore to manage these arrays within an array, it was solved by forming the structure.
And also new commands and functions where discovered while forming the code, like strfind(), strcmpi(), mkdir(), fullfile(), sprintf(), str2num() and str2double(), etc.
(NOTE: The explanation of the methods and commands are explained briefly alongside the code using comments.)
PROGRAM :
1. Main Function -
clear all
close all
clc

f = fopen('THERMO.dat','r');                % opening the THERMO.dat data file.

fgetl(f);                                   % fgetl() reads the line from the file.

% Obtaining Global temperature Range from the 2nd line.
global_temps = fscanf(f,' %f %f %f');       % fscanf() reads data from an open text or dat file into column vector A and,
    global_low_temp = global_temps(1);      % interprets values in the file according to the format specified by formatSpec.
    global_mid_temp = global_temps(2);
    global_high_temp = global_temps(3);

R = 8.3145;    % Assigning Gas Constant and its value.

% NOTE: Every time fgetl() or fscanf() command is applied,
%       the compiler increments from the line and reads the new line.

for i = 1:3         % skipping next 3 lines using fgetl() command,
    fgetl(f);       % since next 3 lines are comments.
end

% Getting the species data from the file and storing it in the variables.

for i = 1:inf

    line1 = fgetl(f);
    if strcmpi(line1,'END')              % strcmpi compares two strings, here it checks whether the 'END' is encountered?,
        break;                           % so whenever 'END' is Break the loop.
    else
            speci_name = strtok(line1,' ');   % getting specie name using, strtok()-parses str from left to right, using whitespace characters as delimiters, and returns part or all of the text.
            dot = strfind(line1,'.');         % strfind() search for a specified character or part of string within the string and returns all the positions where they exists.
            for j = 1:3                             % capturing Local temp of the specie using the positions of the dots from the dot array.
                local_temp(j) = str2double( line1(dot(j)-4 : dot(j)+3) );
            end
            local_low_temp = local_temp(1);
            local_high_temp = local_temp(2);
            local_mid_temp = local_temp(3);

        % initiating Structucture, and storing the species data in the structure.
        specidata(i).SpeciesName = speci_name;
        specidata(i).LocalTemps = [local_low_temp local_mid_temp local_high_temp];

        line2 = fgetl(f);
            A = strfind(line2,'E');                     % finding and saving position of 'E' in an array using strfind()
            % High Temperature Coefficients
            a1 = str2double(line2( A(1)-10 : A(1)+3 )); % storing temp. coeffs. in variables with the help of positions of 'E' and converting string to decimal no. using str2double().
            a2 = str2double(line2( A(2)-10 : A(2)+3 ));
            a3 = str2double(line2( A(3)-10 : A(3)+3 ));
            a4 = str2double(line2( A(4)-10 : A(4)+3 ));
            a5 = str2double(line2( A(5)-10 : A(5)+3 ));

        line3 = fgetl(f);
            B = strfind(line3,'E');
            a6 = str2double(line3( B(1)-10 : B(1)+3 ));
            a7 = str2double(line3( B(2)-10 : B(2)+3 ));
            % Low Temperature Coefficients
            b1 = str2double(line3( B(3)-10 : B(3)+3 ));
            b2 = str2double(line3( B(4)-10 : B(4)+3 ));
            b3 = str2double(line3( B(5)-10 : B(5)+3 ));

        line4 = fgetl(f);
            C = strfind(line4,'E');
            b4 = str2double(line4( C(1)-10 : C(1)+3 ));
            b5 = str2double(line4( C(2)-10 : C(2)+3 ));
            b6 = str2double(line4( C(3)-10 : C(3)+3 ));
            b7 = str2double(line4( C(4)-10 : C(4)+3 ));

        % saving the temp. coeffs. data of the specie in the structure.
        specidata(i).HighTempCoef = [a1 a2 a3 a4 a5 a6 a7];
        specidata(i).LowTempCoef = [b1 b2 b3 b4 b5 b6 b7];
    end

end

specidata = cp_calc(specidata, R);
% Function which calculates and returns the Specific Heat'Cp' to the structure,
% by passing parsed data structure and Gas Constant.

specidata = enthaply_calc(specidata, R);
% Function which calculates and returns the Enthalpy'Cp' to the structure,
% by passing parsed data structure and Gas Constant.

specidata = entropy_calc(specidata, R);
% Function which calculates and returns the Entropy'S' to the structure,
% by passing parsed data structure and Gas Constant.

specidata = molecular_weight(specidata);
% Function which calculates and returns the molecular weights of the species to the structure,
% by passing parsed data structure.

% Printing the Molecular weights of the species.
    for i = 1:length(specidata)
        fprintf('n Molecular Weight of %s = %f',specidata(i).SpeciesName,specidata(i).MolecularWeight);
    end


% Plotting Graphs

for i = 1:length(specidata)
    speci_name = specidata(i).SpeciesName;
    path = ('D:SKILL LYNCMATLAB DocsChallengesNASA DATA ParsingResults');
    mkdir(path,speci_name);                     % mkdir() is used create New folder for each species in the specified directory path.

    figure(1)
        plot(specidata(i).Temp,specidata(i).Cp,'LineWidth',2);
        title(sprintf('Temperature(T) vs Specific Heat(Cp) of %s', speci_name));
        xlabel('Temperature (in K)');          ylabel('Specific Heat (in KJ/kg.K)');
        grid on;

    figure(2)
        plot(specidata(i).Temp,specidata(i).H,'Color',[0.6350 0.0780 0.1840],'LineWidth',2);
        title(sprintf('Temperature(T) vs Enthalpy(H) of %s', speci_name));
        xlabel('Temperature (in K)');          ylabel('Enthalpy (in KJ/kg)');
        grid on;

    figure(3)
        plot(specidata(i).Temp,specidata(i).S,'Color',[0.4660 0.6740 0.1880],'LineWidth',2);
        title(sprintf('Temperature(T) vs Entropy(S) of %s', speci_name));
        xlabel('Temperature (in K)');          ylabel('Entropy (in KJ/K)');
        grid on;

    % storing full path in a variable for the respective specie and specifing the figure export name and format.
    p1 = fullfile(path,speci_name,'T_vs_Cp.jpg');
    p2 = fullfile(path,speci_name,'T_vs_H.jpg');
    p3 = fullfile(path,speci_name,'T_vs_S.jpg');

    % Exporting figure to the specified path.
    saveas(figure(1),p1);
    saveas(figure(2),p2);
    saveas(figure(3),p3);
end

fclose(f);          % fclose(f) - closes the opened .txt or .dat file
2. Function cp_calc() - to calculate Specific Heat (Cp) :-
function specidata = cp_calc(specidata, R)

    for i = 1:length(specidata)

        % Retrieving Local Temperatures from specidata structure
        local_low_temp  = specidata(i).LocalTemps(1);
        local_mid_temp  = specidata(i).LocalTemps(2);
        local_high_temp = specidata(i).LocalTemps(3);

        % Retrieving High and low temp. coefficients from specidata structure.
        a = specidata(i).HighTempCoef;
        b = specidata(i).LowTempCoef;

        T = linspace(local_low_temp,local_high_temp,200);
        for j = 1:length(T)
            if T(j) >= local_mid_temp
               cp(j) = ( a(1)+(a(2)*T(j))+(a(3)*(T(j))^2)+(a(4)*(T(j))^3)+(a(5)*(T(j))^4) ) * R;  % using High Temp. Coeffs. for the Local temps. higher than Local mid temp.
            else
               cp(j) = ( b(1)+(b(2)*T(j))+(b(3)*(T(j))^2)+(b(4)*(T(j))^3)+(b(5)*(T(j))^4) ) * R;  % using High Temp. Coeffs. for the Local temps. Lower than Local mid temp.
            end
        end
        % Storing Cp data in the structure
        specidata(i).Cp = cp;
        specidata(i).Temp = T;
    end
end
3. Function enthalpy() - to calculate Enthalpy (H) :-
function specidata = enthaply_calc(specidata, R)
     for i = 1:length(specidata)

        % Retrieving Local Temperatures from specidata structure
        local_low_temp  = specidata(i).LocalTemps(1);
        local_mid_temp  = specidata(i).LocalTemps(2);
        local_high_temp = specidata(i).LocalTemps(3);

        % Retrieving High and low temp. coefficients from specidata structure.
        a = specidata(i).HighTempCoef;
        b = specidata(i).LowTempCoef;

        T = linspace(local_low_temp,local_high_temp,200);
        for j = 1:length(T)
            if T(j) >= local_mid_temp
               h(j) = ( a(1)+(a(2)*(T(j))/2)+(a(3)*((T(j))^2)/3)+(a(4)*((T(j))^3)/4)+(a(5)*((T(j))^4)/5)+(a(6)*((T(j))^5)/6) ) * R*T(j); % using High Temp. Coeffs. for the Local temps. higher than Local mid temp.
            else
               h(j) = ( b(1)+(b(2)*(T(j))/2)+(b(3)*((T(j))^2)/3)+(b(4)*((T(j))^3)/4)+(b(5)*((T(j))^4)/5)+(b(6)*((T(j))^5)/6) ) * R*T(j); % using High Temp. Coeffs. for the Local temps. Lower than Local mid temp.
            end
        end
        % Storing enthalpy(H) data in the structure
        specidata(i).H = h;
        specidata(i).Temp = T;
    end
end
4. Function entropy() - to calculate Entropy (S) :-
function specidata = entropy_calc(specidata, R)
     for i = 1:length(specidata)

        % Retrieving Local Temperatures from specidata structure
        local_low_temp  = specidata(i).LocalTemps(1);
        local_mid_temp  = specidata(i).LocalTemps(2);
        local_high_temp = specidata(i).LocalTemps(3);

        % Retrieving High and low temp. coefficients from specidata structure.
        a = specidata(i).HighTempCoef;
        b = specidata(i).LowTempCoef;

        T = linspace(local_low_temp,local_high_temp,200);
        for j = 1:length(T)
            if T(j) >= local_mid_temp
               s(j) = ( (a(1)*log(T(j)))+(a(2)*(T(j)))+(a(3)*((T(j))^2)/2)+(a(4)*((T(j))^3)/3)+(a(5)*((T(j))^4)/4)+a(7) ) * R; % using High Temp. Coeffs. for the Local temps. higher than Local mid temp.
            else
               s(j) = ( (b(1)*log(T(j)))+(b(2)*(T(j)))+(b(3)*((T(j))^2)/2)+(b(4)*((T(j))^3)/3)+(b(5)*((T(j))^4)/4)+b(7) ) * R; % using High Temp. Coeffs. for the Local temps. lower than Local mid temp.
            end
        end
        % Storing entropy(S) data in the structure
        specidata(i).S = s;
        specidata(i).Temp = T;
    end
end
5. Function molecular_weight() - to calculate Molecular Weight :-
function specidata = molecular_weight(specidata)
    % Assigning Array of Common and basic elements and their atomic weights.
    elements = ['N','A','C','H','O','S'];
    atom_wts = [14,40,12,1,16,32];

    for i = 1:length(specidata)
       speci_name = specidata(i).SpeciesName;       % Retrieving Specie's name from the structure
       mw = 0;                                      % creating variable for storing molecular Weight
       for j = 1:length(speci_name)
          for k = 1:length(elements)
             if strcmpi(speci_name(j),elements(k))  % Comparing every charachter of specie name with every character of elements
                 mw = mw + atom_wts(k);             % updating Molecular weight as the Element encounters
                 pos = k;                           % Stores position where elements matched
             end
          end

          mol_n = str2double(speci_name(j));        % if the specie name consist a number( no. of atoms of the element) it will return be greater than 1 otherwise it will return NAN
          if mol_n > 1
              mw = mw + (atom_wts(pos).*(mol_n - 1));  % adding atomic weight as per the no. of atoms in the molecules.
          end
       end
       % storing of Molecular weights in the
       specidata(i).MolecularWeight = mw;
    end
end
OUTPUT :
i) Command window output -

ii) Data generated in the structure after whole calculation -
iii) Folder Files and data created for the species exported -

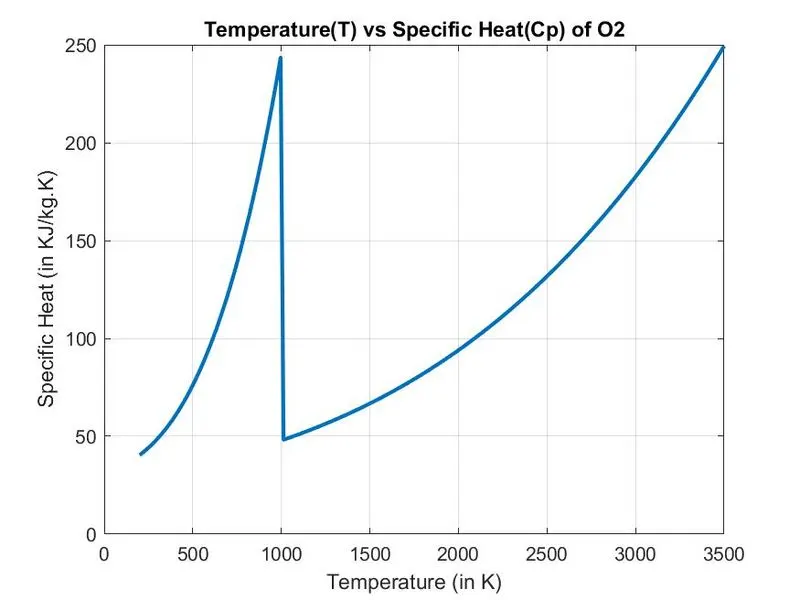
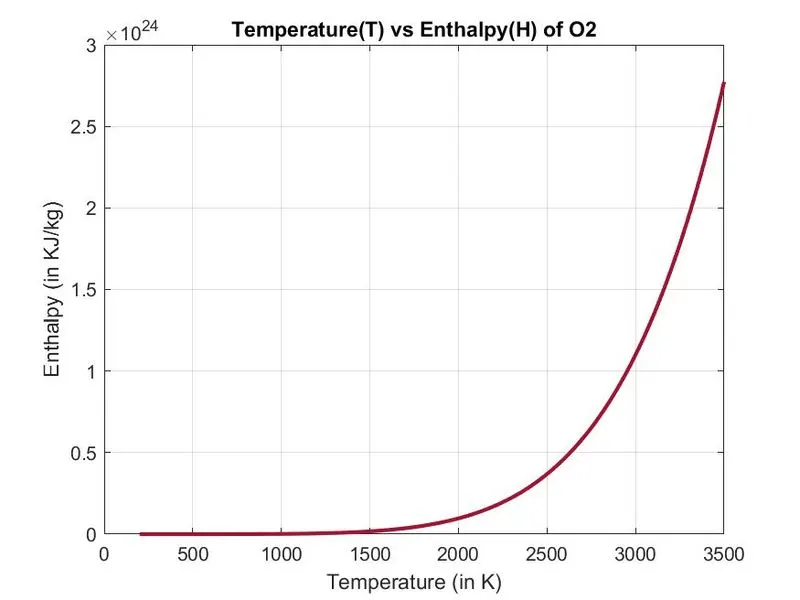
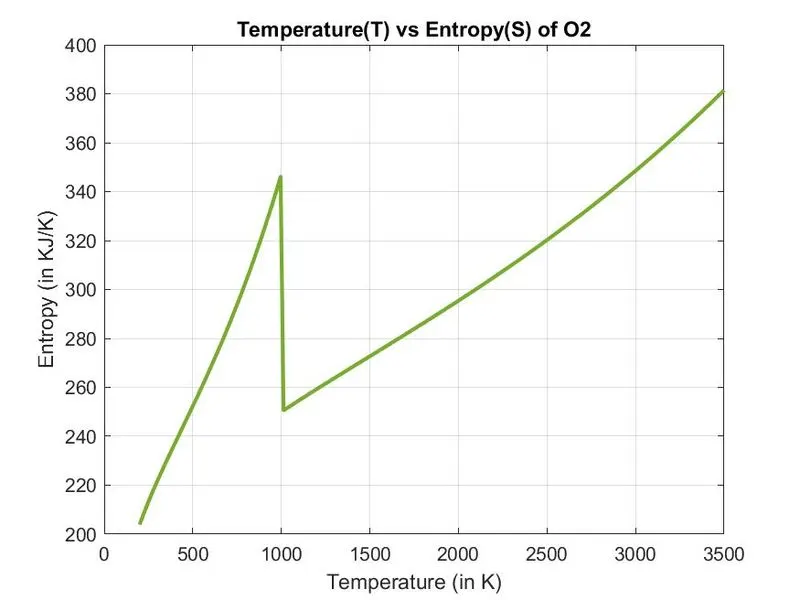
iv) Plots of `O_2` -
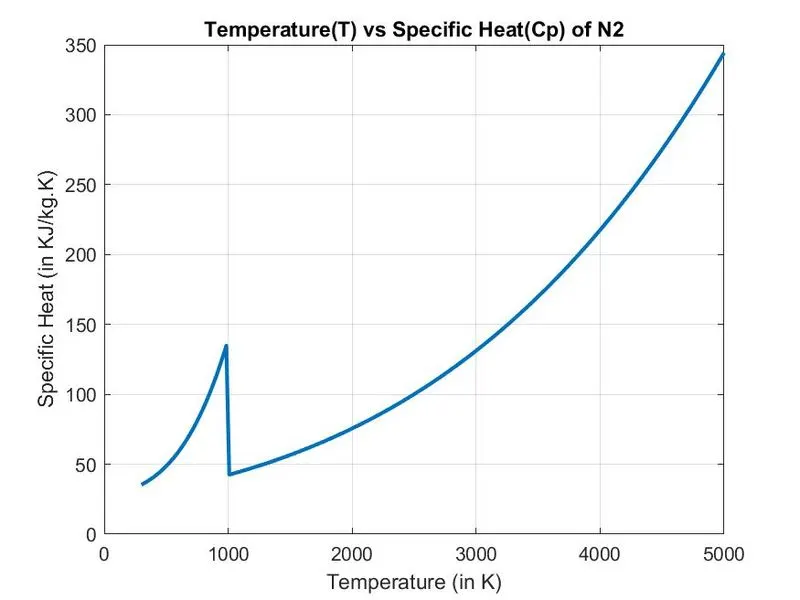
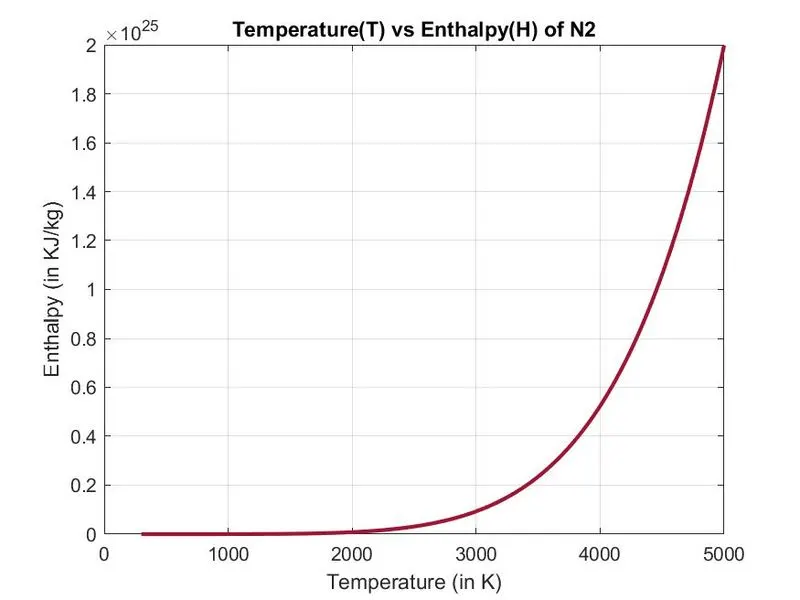
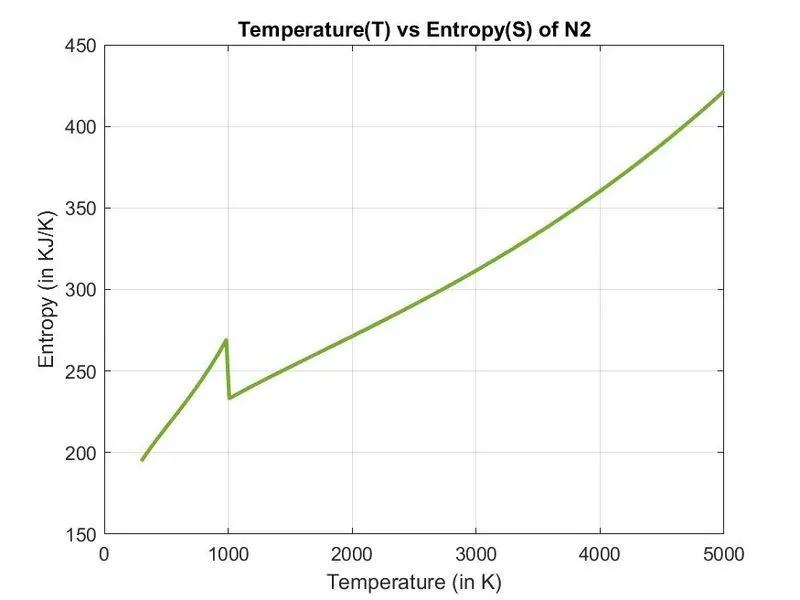
iv) Plots of `N_2` -
iv) Plots of `CO_2` -
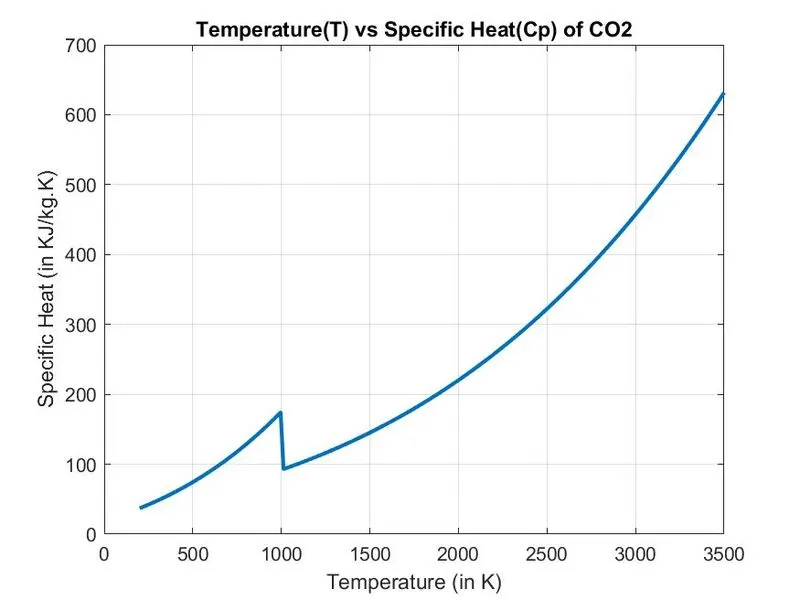
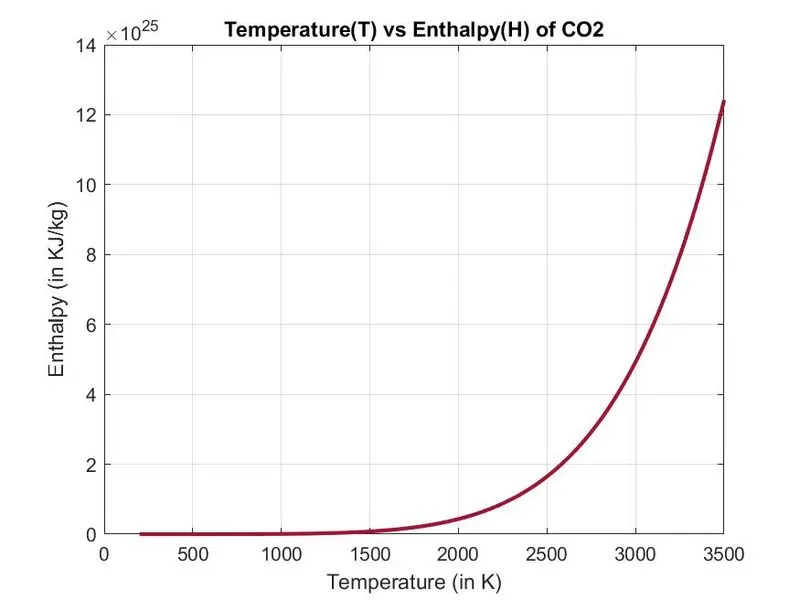
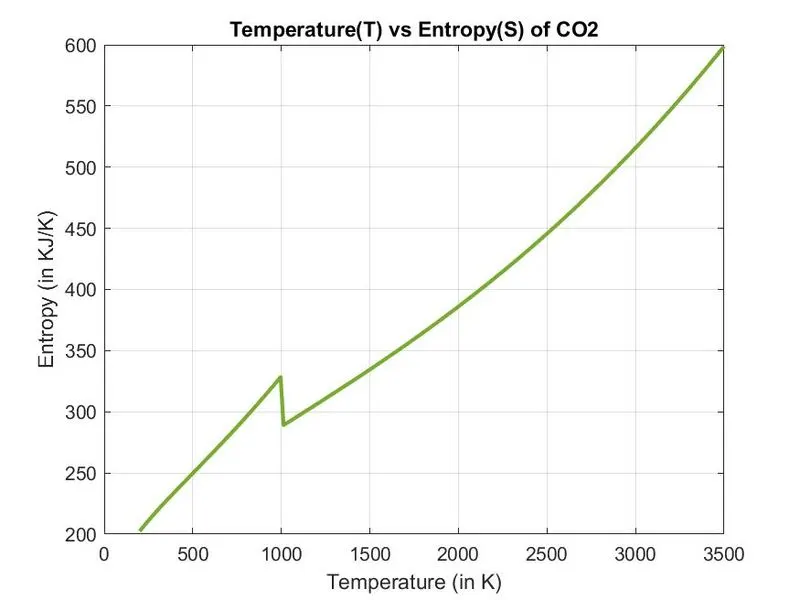
ERRORS OCCURED :
1. One error occurred due to a stupid mistake. In the formula for calculating the Cp, the mistakenly for the multiplication '.' operator was typed instead of the '*' operator.

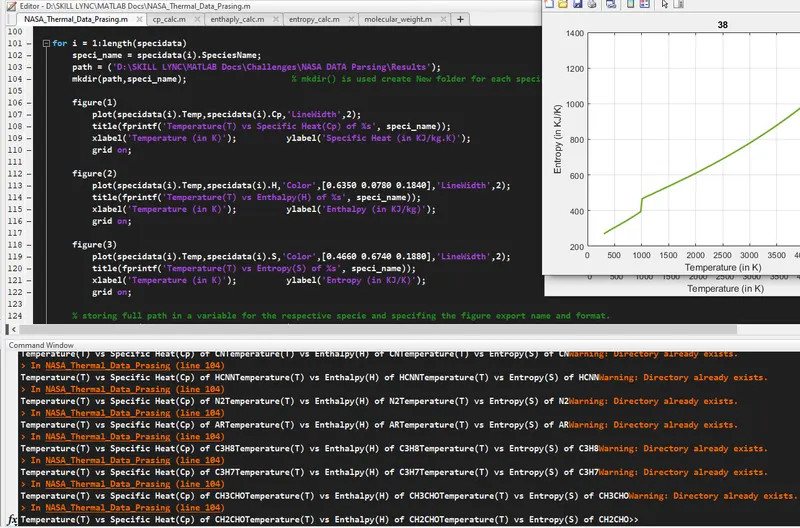
2. another problem, was faced while printing the name of the species in the plot title. The mistake was resolved by using "sprintf" instead of "fprintf".
REFERENCES :