Project 1 - Parsing NASA thermodynamic data
AIM : To obtain NASA thermodynamic data for various species,coefficients of temperature and to find specific-heat,enthalpy and entropy using MATLAB code.
INPUTS USED :
- R = 8.31446261815324 (Universal gas constant)
- Given THERMO.txt file
A detailed report to describe my logic.
- Using thermodynamic data opening the file contents in editor window.
- Calling the command 'fgetl' to read out each line of the THERMO.txt file and naming as 'tlines' where it can save.
- Converting my string to number to perform ease way of calculations for each tline operation.
- Using formula given calculations for enthalpy, entropy and specific heat of low to high temperatures are done.
- Calling my function to run the code to calculate molecular weight as well as atomic weight for every species mentioned.
- Making plots for each and every species .
- Defined my file directory where to save.
- finally when is code excicuted required data is printed.
FORMULA :

MAIN PROGRAM :
clear all
close all
clc
%getting data
f1=fopen('NASA.txt','r');%opening the saved file
for i = 1:5 %skipping the first five lines
tline1 = fgetl(f1); %getting the first line after skiped
end
ct=1; %counter for loops
ct1=54; %counter for loops
ct2=108; %counter for loops
for i=1:53
%Extracting the temperature values
tline2=fgetl(f1);
c = strsplit(tline2,' '); % spliting tline2
species=char(c(1)); %defining charecter
a = findstr(tline2,'.'); %find string
Local_Low_temp=str2num(tline2(a(1)-3:a(1)-1));
Local_high_temp=str2num(tline2(a(2)-4:a(2)-1));
Local_mid_temp=str2num(tline2(a(3)-4:a(3)-1));
%Extracting the coeff values
tline3 = fgetl(f1);
b = findstr(tline3,'E');
a1 = str2num(tline3(1:b(1)+3));
a2 = str2num(tline3(b(1)+4:b(2)+3));
a3 = str2num(tline3(b(2)+4:b(3)+3));
a4 = str2num(tline3(b(3)+4:b(4)+3));
a5 = str2num(tline3(b(4)+4:b(5)+3));
tline4 = fgetl(f1);
b = findstr(tline4,'E');
a6 = str2num(tline4(1:b(1)+3));
a7 = str2num(tline4(b(1)+4:b(2)+3));
a8 = str2num(tline4(b(2)+4:b(3)+3));
a9 = str2num(tline4(b(3)+4:b(4)+3));
a10 = str2num(tline4(b(4)+4:b(5)+3));
tline5 = fgetl(f1);
b = findstr(tline5,'E');
a11 = str2num(tline5(1:b(1)+3));
a12 = str2num(tline5(b(1)+4:b(2)+3));
a13 = str2num(tline5(b(2)+4:b(3)+3));
a14 = str2num(tline5(b(3)+4:b(4)+3));
R = 8.31446261815324;
T = (Local_Low_temp:Local_high_temp);
if (T>Local_mid_temp);
%formula to caluculate Specific heat,enthalpy,entropy
cp = (a1 + a2.*T + a3.*T.^2 + a4.*T.^3 + a5.*T.^4)*R;
H = (a1 + a2*T + a3*T.^2 + a4*T.^3/4 + a5*T.^4/5 + a6/T)*R.*T;
S = (a1*(log(T))+a2*T + a3*T.^2/2 + a4*T.^3/3 + a5*T.^4/4 + a7)*R;
else
cp = (a8 + a9*(T) + a10*(T.^2) + a11*(T.^3) + a12*(T.^4));
H = (a8 + a9*T + a10*T.^2 + a11*T.^3/4 + a12*T.^4./5 + a13./T)*R.*T;
S = (a8*(log(T))+a9*T + a10*T.^2./2 + a11*T.^3./3 + a12*T.^4./4 + a14)*R;
end
molecular_weight=m_wt(species) %calling the function
sprintf('molecular_weight of %s =%d',species,molecular_weight)
%Plot the Cp, Enthalpy and Entropy for the local temperature range
t = sprintf('%s',species);
t=mkdir(['E:',species]) %making directory
cd(['E:',species])%current directory
figure(1)
plot(cp,T,'linewidth',2,'color','k')
title(sprintf('cp vs T for %s',species))
xlabel('specific heat')
ylabel('temperature')
grid on
saveas(gcf,'CP.png')
figure(2)
plot(H,T,'linewidth',2,'color','magenta')
title(sprintf('H vs T for %s',species))
xlabel('Enthalpy')
ylabel('temperature')
grid on
saveas(gcf,'H.png')
figure(3)
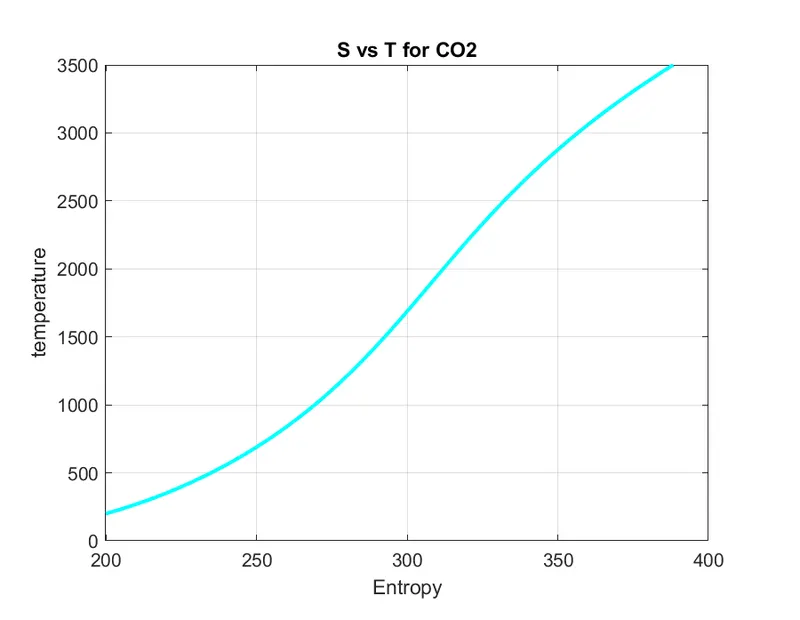
plot(S,T,'linewidth',2,'color','cyan')
title(sprintf('S vs T for %s',species))
xlabel('Entropy')
ylabel('temperature')
grid on
saveas(gcf,'S.png') %saving as png file
cd ..
end
FUNCTION :
function [out] = m_wt(species)

%Defining the elements
elements=['H','C','N','O','R'];

%Atomic weights of each element
Atomic_Weight = [1 12 14 16 40];
out=0;

%Looping for each element inside each species and finding the atomic weight
for i=1:length(species)
    for j=1:length(elements)
        if strcmp(species(i),elements(j))
            out= out + Atomic_Weight(j);
            p=j;
        end
    end

    %loop to multiply the coefficients of the elements if greater than 1.
    n=str2double(species(i));
    if n>1
        out = out + (Atomic_Weight(p))*(n-1);
    end
end

end
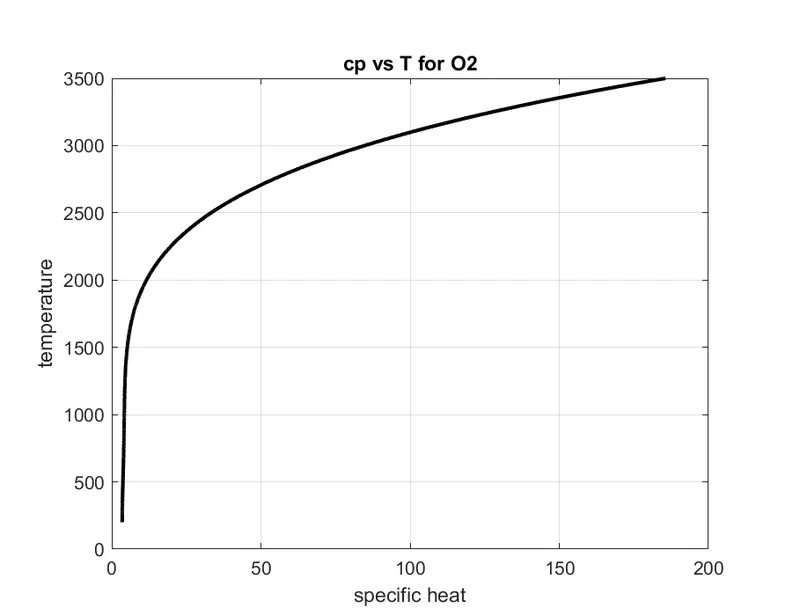
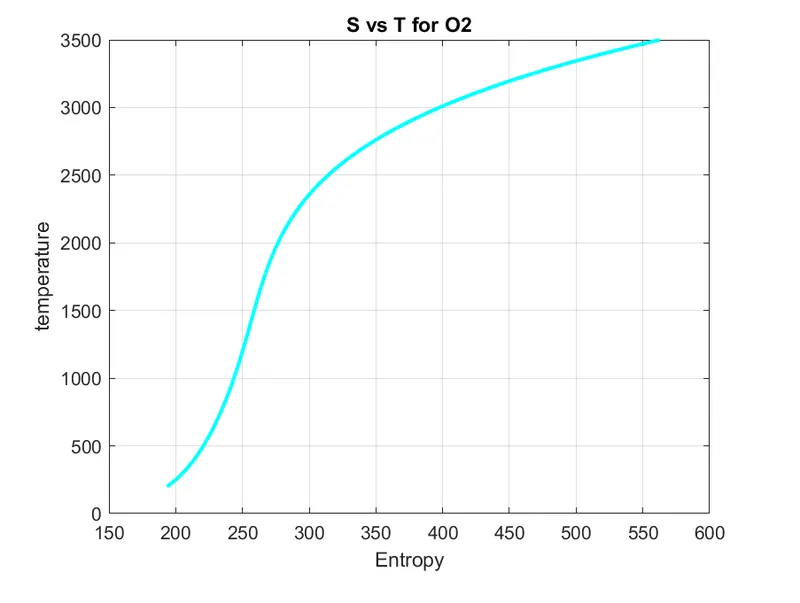
PLOT FOR O2 :
Specific heat vs temperature of O2
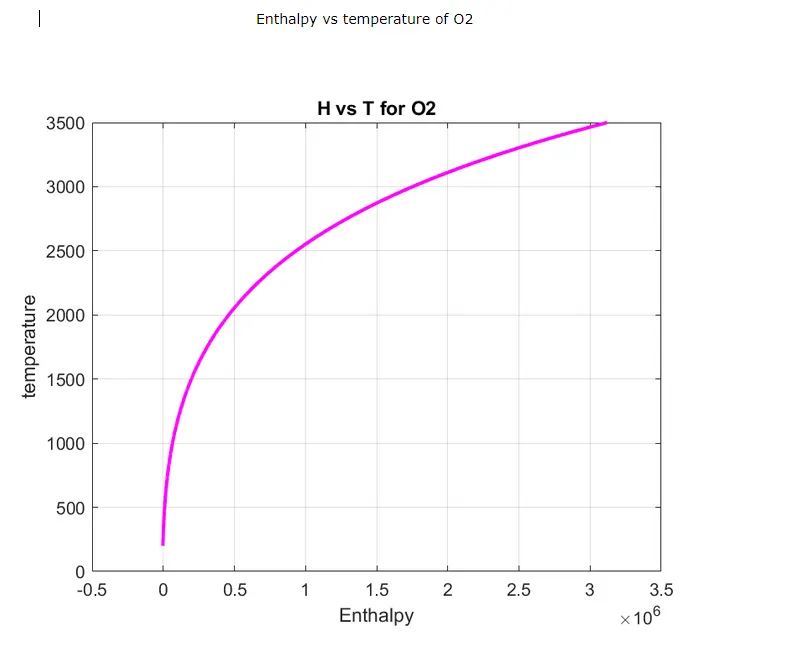
Enthalpy vs temperature of O2
Entropy vs temperature of O2
PLOT FOR N2 :
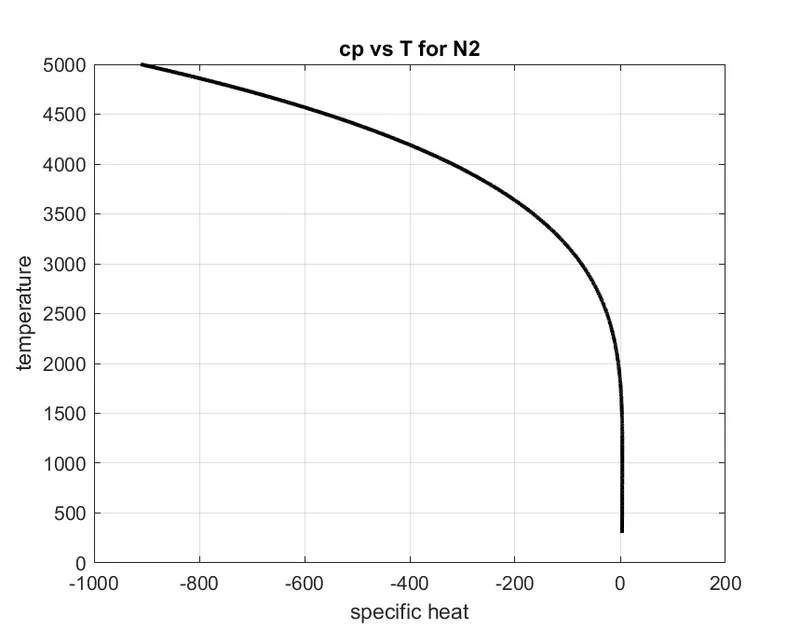
Specific heat vs temperature of N2
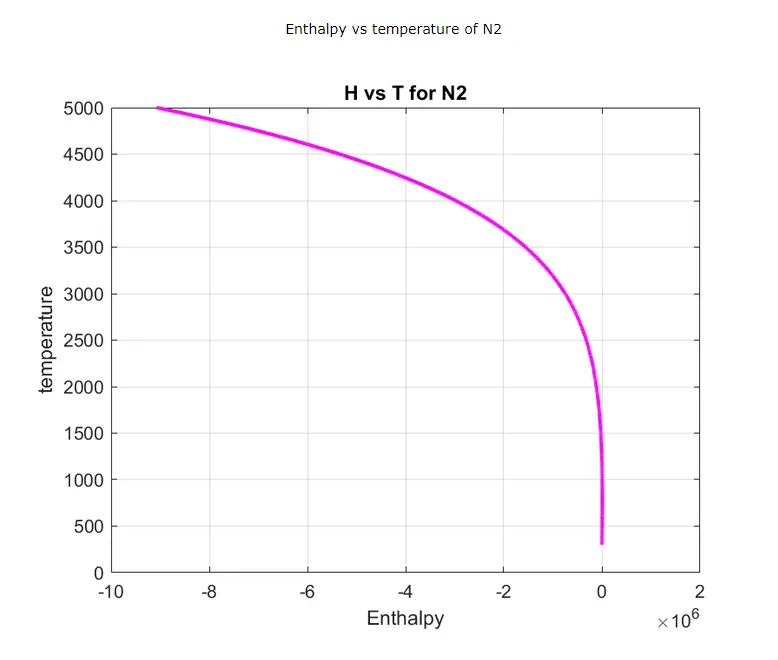
Enthalpy vs temperature of N2
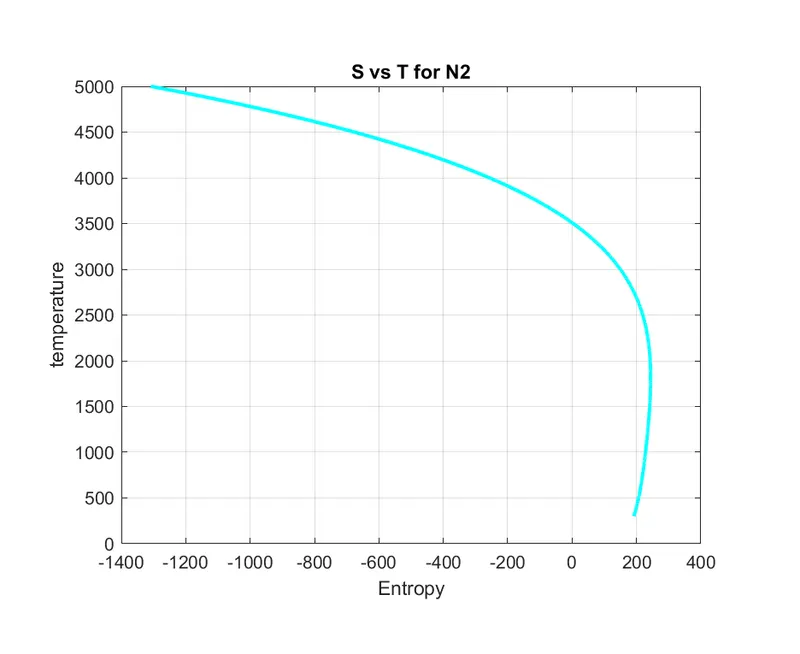
Entropy vs temperature of N2
PLOTS FOR CO2 :
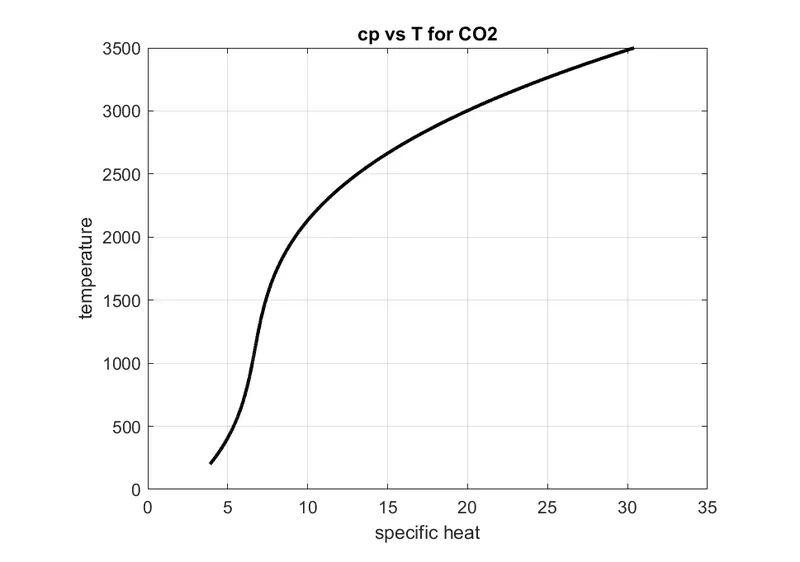
Specific heat vs temperature of Co2
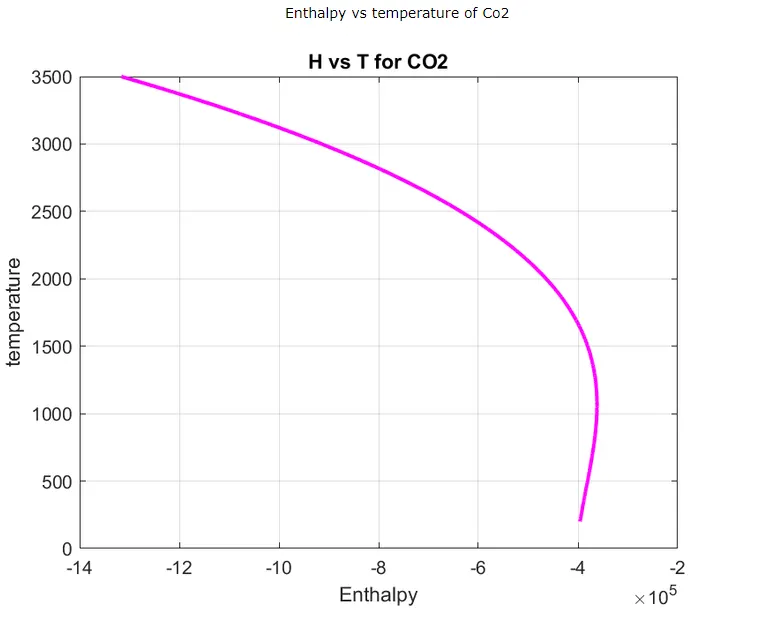
Enthalpy vs temperature of Co2
Entropy vs temperature of Co2
RESULTS :
SCREENSHOTS OF SAVED FILES

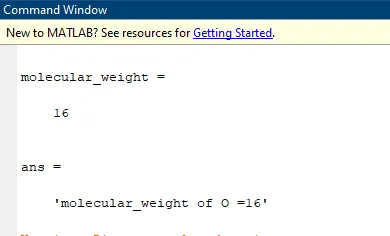
SCREENSHOT OF MOLECULAR WEIGHT :