Project 1 - Parsing NASA thermodynamic data
AIM: Thermodynamic various data species are studied and the coefficient of temperature in the characteristic equation for specific heat (cp),entropy(s),enthalpy(H) ,are the obtaining the by using the MATLAB.
EXPLANATION:
Specific heat(cp):specific heat ratio of the quantity of to raise the heat required temperature of a body one degree to that required to raise the temperature of an equal mass of water one degree.
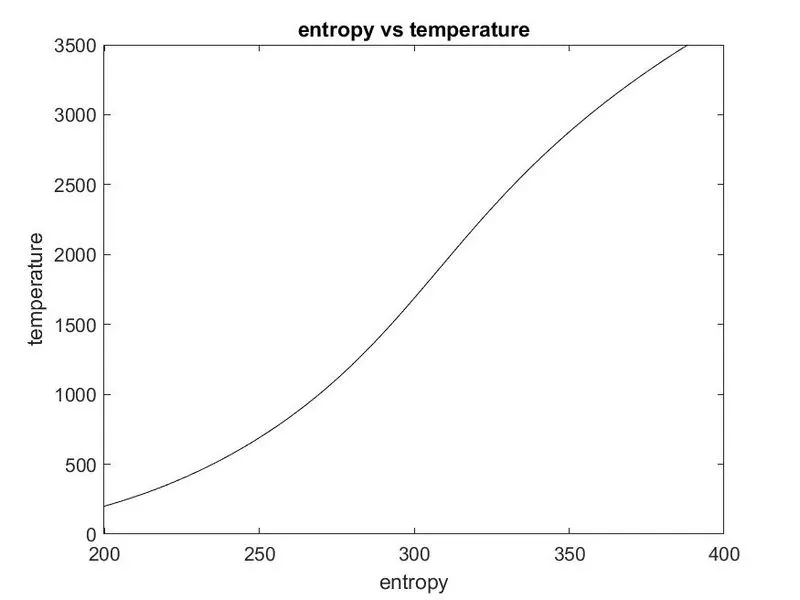
Entropy(S):the measure of a system's thermal energy per unit temperature that is unavailable for doing useful work. Because work is obtained from ordered molecular motion, the amount of entropy is also a measure of the molecular disorder, or randomness, of a system.
Enthalpy(H):Enthalpy is the measurement of energy in a thermodynamic system. The quantity of enthalpy equals the total content of heat of a system, equivalent to the system’s internal energy plus the product of volume and pressure.
The follow of the equation are :
1.The equation of specific heat :

2.The equation of entropy:  3.The equation of enthalpy:

The Thermo data file by obtaining the 14 coefficient of it, the order of first 7 coefficient are the Used the HIGH TEMPERATURE conditions , and the next of order of second 7 coefficient are the used the LOW TEMPERATURE conditions..the temperature of each species is mentioned in the data file of thermo.as the given of the temperature of each species of maximum limit and minimum limit as well as the median limit.for the above of the median limit, the high temperature coefficient are used ,as the below of the median limit,the low temperature coefficient are be the used
Procedure:
It is better to the programing in matlab with these three commands as through these all the previous calculation is erased.
Clear all : This command clear all the data stored in the workspace previously
Close all : this command clear all the previous figure and plots
Clc : This command clear the command window.
Now,create the required variables of inputs:
>Now, the read of the file of given thermo data and,let at given of fopen.
>And the data file of thermo data, just i want to skipped of the lines, of because i want to find of the temperature of 1st line included position of it.and the which gets of the fgetl.
>Now, i know to find out the temperature of low temperature,high temperature,and the mid temperature of the respectively.and i want the position of the temperature of the point, and i break down the into array cell column to the strumnumber. And i finding of low, high, mid temperature ,of the position, to of strfind of the calculate of the temperature of it. >Then the i want to know of the coefficient of the each species, and known to find out of it, each line of the species,.according to the remaining species lines of the data file .
>And the value of the temperature (T),the difinding the low temperature:high temperature, and if (T)>the mid temperature.
>Then the value of the coefficient of the specific heat(cp),and entropy(s),and the finally of enthalpy(H),and given of relative of the given above equation .and the finding out of the each species coefficient, and the analysed of the first 7 coefficient of high temperature are used, and the second of the 7 coefficient is low temperature are used.
>Now, i want to known of the molecular atomic weight of the each species of the elements , and let the function of the out of each species of molecular weight is defined as output ofp,let the i = length of the species and j = length of the element and we know to the molecular weight of each species then the compare of the both elements and the species which as given of output of function name p,then the equal of p=j.,then the n>1, the p*(n-1)i is the consider of it .
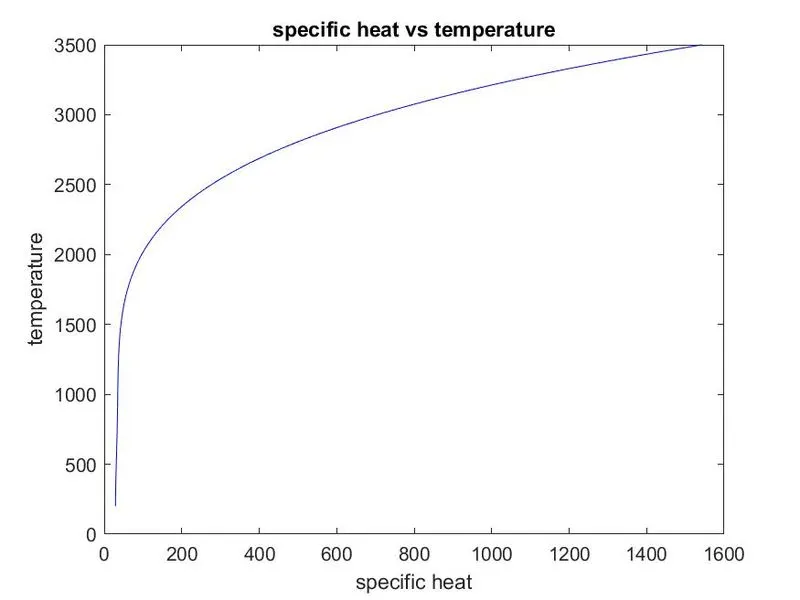
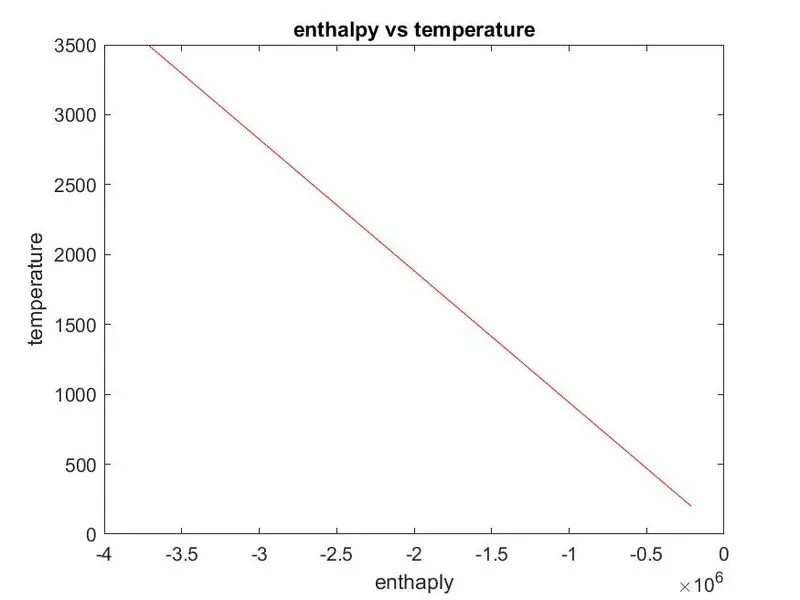
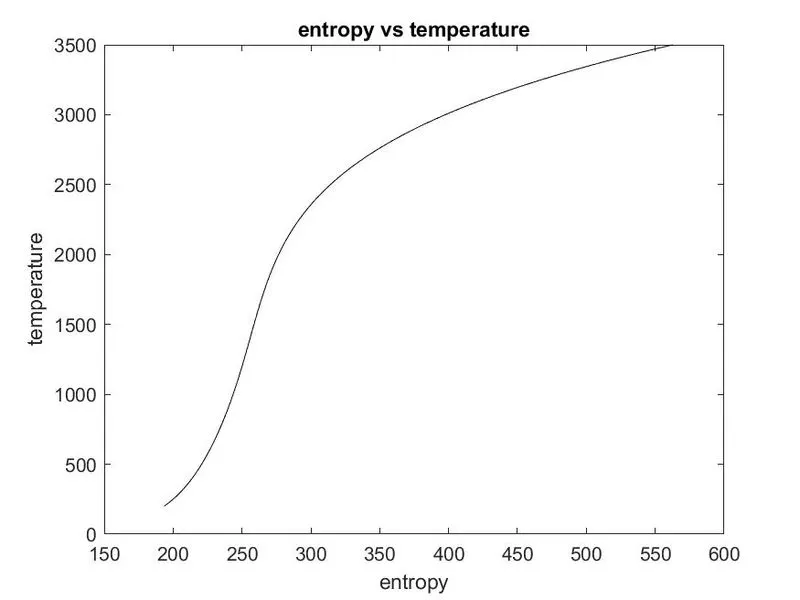
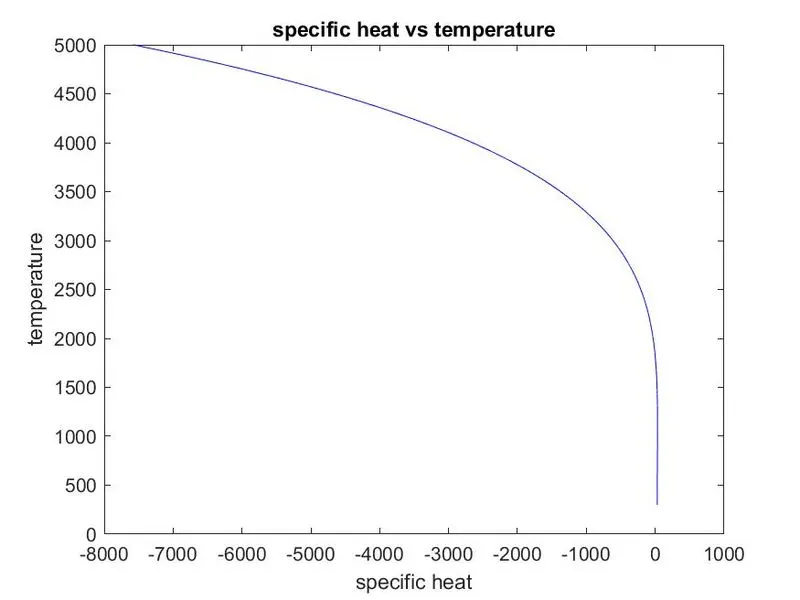
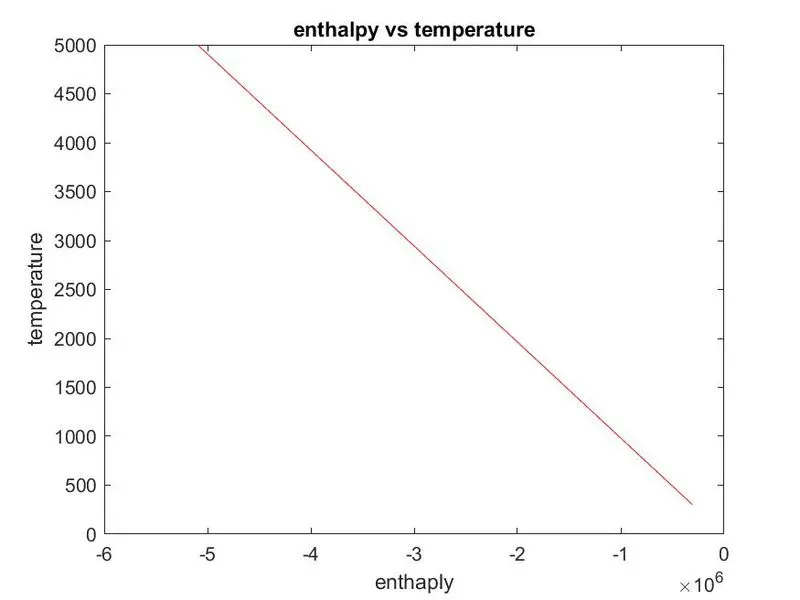
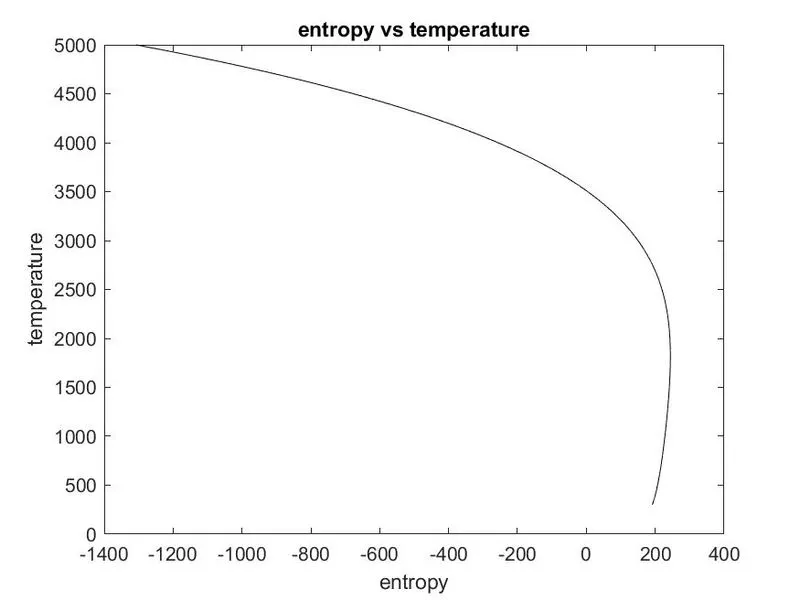
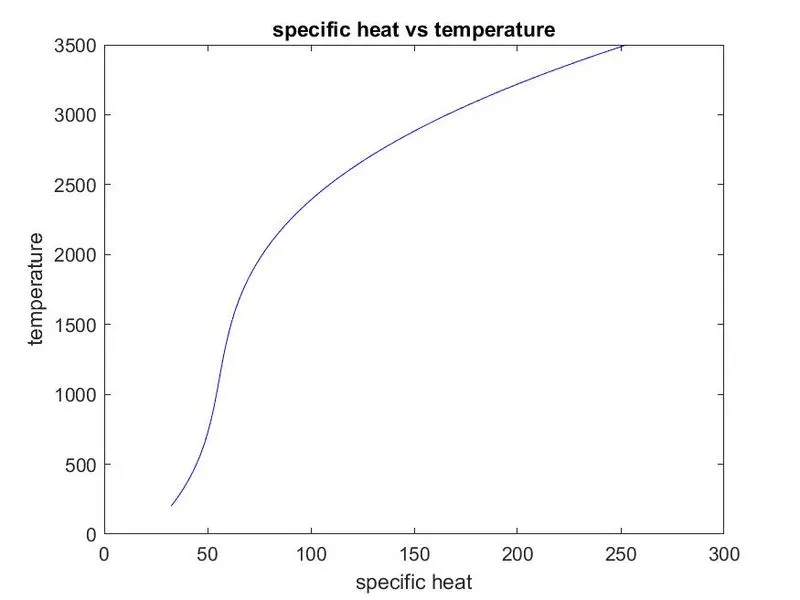
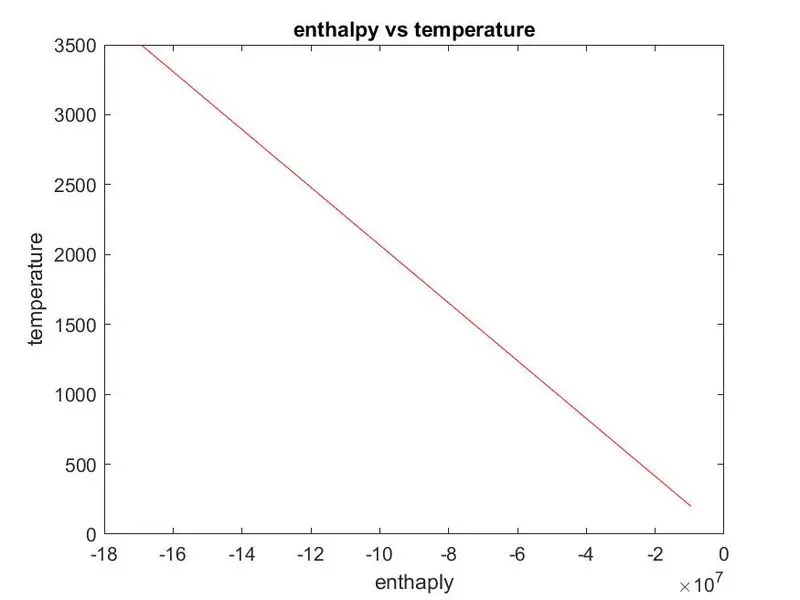
>And, the plot now the figure(1)specific heat,and give the title of it ,save as(gcf,jpeg),of it .and same of it remaining figure(2)entropy(s),and figure(3)enthalpy(H).
>Now, create the folder for the species, sprintf,and the created of the mkdir documentary.
>And going in the folder of the species to save the plot cd.
>Go back to the previous directory folder”cd….”
CODE:
clear all
close all
clc


o = fopen('THERMO.dat','r');
  R = 8.314'
for i = 1:5;       %skipping the line(1:5)
tline = fgetl(o);
end

for i = 1:53
    %to obtaining the name of species and converting into string value
    tline2 = fgetl(o);
    a = strsplit(tline2,' ');
     species_cell = a(1);
    species= char(species_cell);


 %finding local values of the temperature of each species
    local_temp = strfind(tline2,'.');
     Local_low_temp = str2double(tline2(local_temp(1)-3:local_temp(1)-1));
    Local_high_temp = str2double(tline2(local_temp(2)-4:local_temp(2)-1));
      Local_mid_temp = str2double(tline2(local_temp(3)-4:local_temp(3)-1));

 %coeffecients 1st line
  tline2 = fgetl(o);
  coeff_locator = strfind(tline2,'E');
  high1=str2double(tline2(1:coeff_locator(1)+3));
  high2=str2double(tline2(coeff_locator(1)+4:coeff_locator(2)+3));
  high3=str2double(tline2(coeff_locator(2)+4:coeff_locator(3)+3));
  high4=str2double(tline2(coeff_locator(3)+4:coeff_locator(4)+3));
  high5=str2double(tline2(coeff_locator(4)+4:coeff_locator(5)+3));

  %coefficent 2nd line
tline3 = fgetl(o);

high6=str2double(tline3(1:coeff_locator(1)+3));
high7=str2double(tline3(coeff_locator(1)+4:coeff_locator(2)+3));
low8=str2double(tline3(coeff_locator(2)+4:coeff_locator(3)+3));
low9=str2double(tline3(coeff_locator(3)+4:coeff_locator(4)+3));
low10=str2double(tline3(coeff_locator(4)+4:coeff_locator(5)+3));

%coefficient 3rd line
tline4 = fgetl(o);

low11=str2double(tline4(1:coeff_locator(1)+3));
low12=str2double(tline4(coeff_locator(1)+4:coeff_locator(2)+3));
low13=str2double(tline4(coeff_locator(2)+4:coeff_locator(3)+3));
low14=str2double(tline4(coeff_locator(3)+4:coeff_locator(4)+3));


Molecular_weight=m_wt(species);
sprintf('Molecular_weight of %s=%d',species,Molecular_weight)
 %obtainig the values for cp,enthaply and entropy using the co-efficient if
 T =Local_low_temp:Local_high_temp;
 if (T >Local_mid_temp);

 %specific heat
 cp = R*(high1+(high2*T)+(high3*(T.^2))+(high4*(T.^3))+(high5*(T.^4)));
 %ENTHAPLY
 H = R*(high1)+(high2*T/2)+(high3*(T.^2)/3)+(high4*(T.^3)/4)+(high5*(T.^4)/5)+(a6*(T));
 %ENTROPY
 S = R*((high1*log(T1)+(high2*T)+(high3*(T.^2)/2)+(high4*(T.^3)/3)+(high5*(T.^4)/4)+ high7));

 else

  %specific heat
 cp = R*(low8+(low9*T)+(low10*(T.^2))+(low11*(T.^3))+(low12*(T.^4)));
 %ENTHAPLY
 H = R*(low8)+(low8*T/2)+(low10*(T.^2)/3)+(low11*(T.^3)/4)+(low12*(T.^4)/5)+(low13*(T));
 %ENTROPY
 S = R*((low8*log(T)+(low9*T)+(low10*(T.^2)/2)+(low11*(T.^3)/3)+(low12*(T.^4)/4)+ low14));
 %creating the folder for the species
 t=sprintf('%s',species)
 mkdir(t)
 %goging to the folder of the species to save the plot
 cd(t)
 figure(1)
 plot(cp,T,'B')
 title('specific heat vs temperature');
 xlabel('specific heat');
 ylabel('temperature');
 saveas(gcf,'cp.jpeg')

 figure(2)
 plot(H,T,'r');
 title('enthalpy vs temperature');
 xlabel('enthaply');
 ylabel('temperature');
 saveas(gcf,'H.jpeg')

 figure(3)
  plot(S,T,'k')
 title('entropy vs temperature')
 xlabel('entropy')
 ylabel('temperature')
 saveas(gcf,'S.jpeg')
cd ..
%goging to back pervious directory

 end
end
The function to determine the atomic weight of each species.
function [out] = m_wt(species)

elements = ['H','C','N','O','R'];

atomic_weight = [1 12 14 16 40];
out = 0;

for i = 1:length(species);
   for j = 1:length(elements);
    if strcmp(species(i),elements(j));

      out = out + atomic_weight(j);
      p = j
    end
end

n= str2double(species(i));

if (n>1)
    out = out + atomic_weight(p)*(n-1);
end
end
end
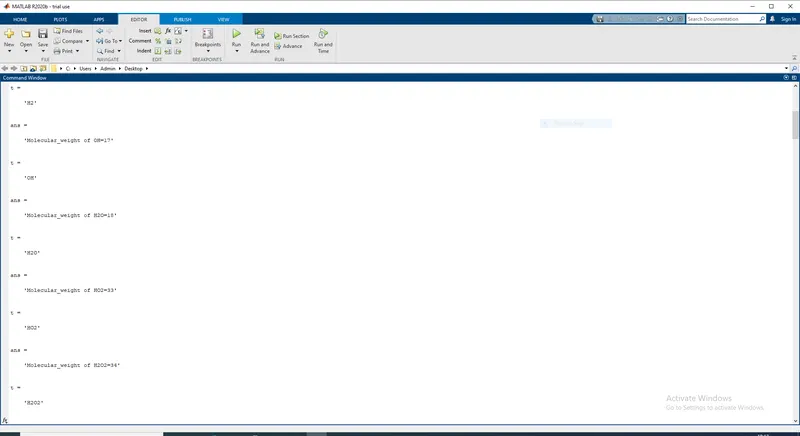
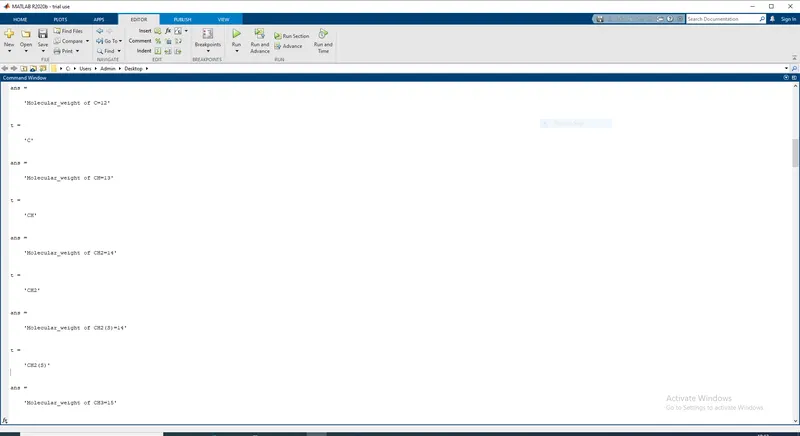
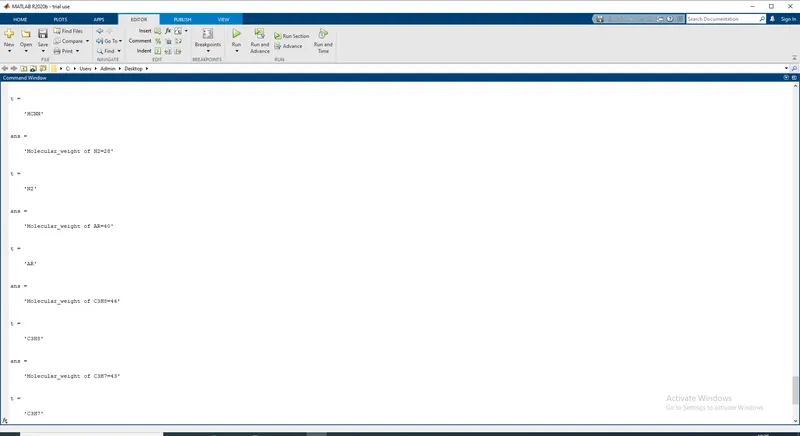
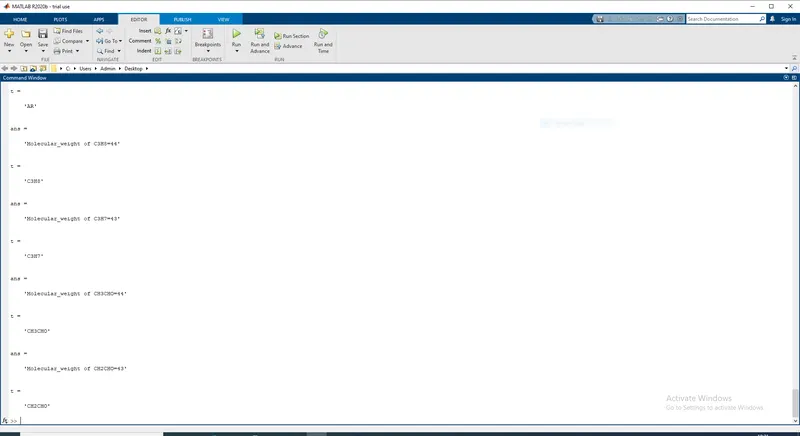
the above function determine the molecular weight and printed in the command window 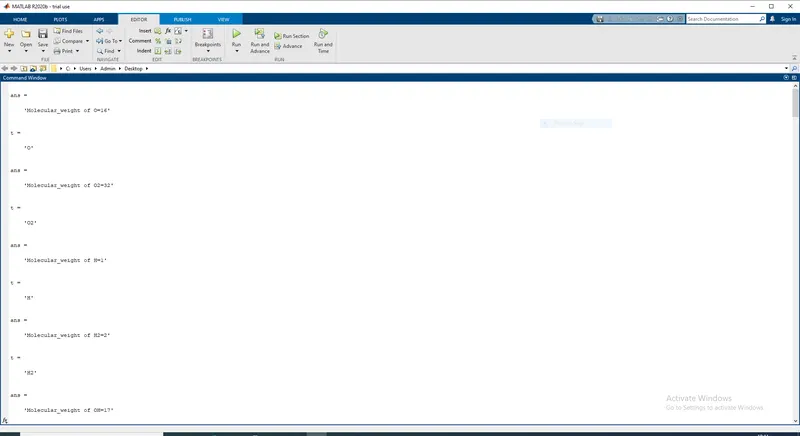
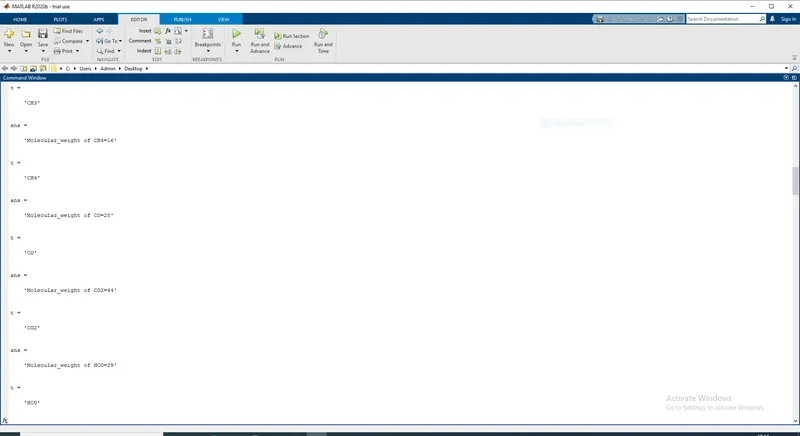
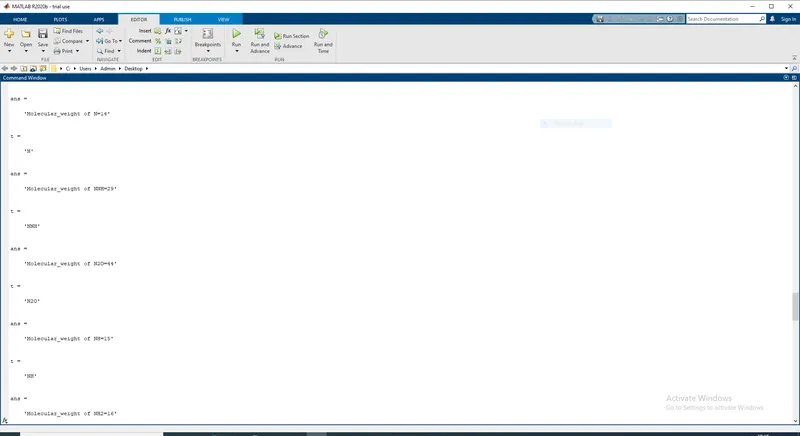
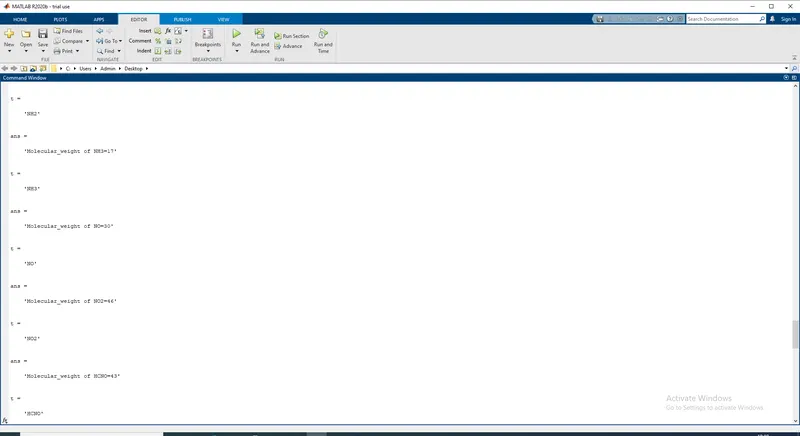
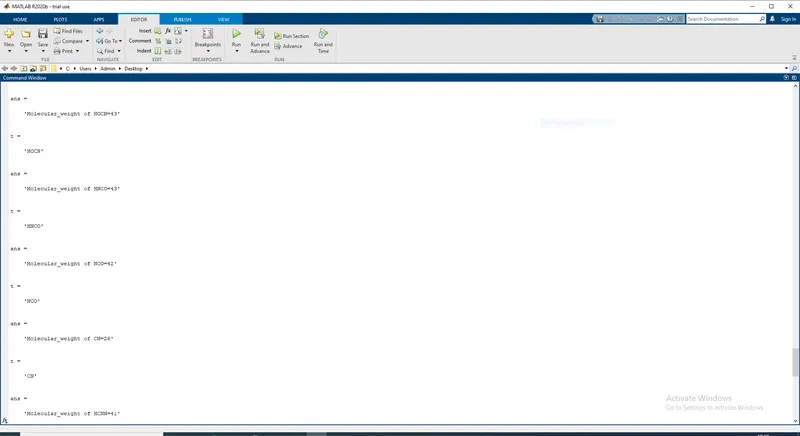
PLOT O2
1)
2)
3)
PLOT:N2
1)
2)
3)
PLOT:CO2
1)
2)
3)