Parsing NASA thermodynamic data
Aim:
To write a program code to perform the following:
1. Extract 14 Coefficients for each species and to claculate Specific Heat, Entropy and Enthalpy.
2. Plot Temperature vs Specific heat , Entropy and Enthalpy.
3. Calculate Molecular Weight for each species.
Parsing:
Parsing in computer languages refers to syntactic analysis of the input code into its components parts in order to facilitate the writing of compilers and interpreters. It can be used to describe split or separation.
Parsing a file means reading in a data stream of some sort and building an in memory model of the semantic content of that data. This aims at facilitating perfoming some kind of transformation on the data.
NASA came up with polynomials that can be used to evaluate thermodynamic properties such as Cp, H and S. They have also documented the co-efficients that are required to evaluate these polynomials for 1000+ species. By breaking down the polynomial required for our objective we have the following.

Program:
Main Program:
% Parsing NASA Thermodynamic Data
close all
clear all
clc
% Opening the file to read the data
f1 = fopen("THERMO.dat",'r');
fgetl(f1);

% Getting Global Temperatures
Temp = fscanf(f1,'%f n',[1 3]);
low_temp = Temp(1);
medium_temp = Temp(2);
high_temp = Temp(3);

% Skipping the header information
fgetl(f1);
fgetl(f1);
fgetl(f1);

% Defining Gas constant R
R = 8.314;

% finding coefficients
for i = 1:53

    %getting species names
    name_line = fgetl(f1);
    x=strsplit(name_line,' ');
    species_name=x{1};

    %storing the temp values as numbers
    z=length(x);
    local_low_temp=str2double(x{z-3});
    local_mid_temp=str2double(x{z-1});
    local_high_temp=str2double(x{z-2});

     t1=local_low_temp;
     t2=local_mid_temp;
     t3=local_high_temp ;


    tline1 =  fgetl(f1);
    y1 = strfind(tline1, 'E');
    a1 = tline1(1:y1(1)+3);
    a1 = str2double(a1);
    a2 = tline1((y1(1)+4:(y1(2)+3)));
    a2 = str2double(a2);
    a3 = tline1(y1(2) +4: (y1 (3)+3));
    a3 = str2double(a3);
    a4 = tline1(y1(3)+4: (y1(4)+3));
    a4 = str2double(a4);
    a5 = tline1(y1(4)+4: (y1(5)+3));
    a5 = str2double(a5);
    tline2 = fgetl(f1);
    y2 = strfind(tline2, 'E');
    a6 = tline2(1:(y2(1)+3));
    a6 = str2double (a6);
    a7 = tline2((y2(1)+4): (y2(2)+3));
    a7 = str2double(a7);
    a8 = tline2((y2(2)+4):(y2(3)+3));
    a8 = str2double(a8);
    a9 = tline2((y2(3)+4):(y2(4)+3));
    a9 = str2double(a9);
    a10 = tline2((y2(4)+4): (y2(5)+3));
    a10 = str2double(a10);
    tline3 = fgetl(f1);
    y3 = strfind (tline3, 'E');
    a11 = tline3(1: (y3(1)+3));
    a11 = str2double(a11);
    a12 = tline3((y3(1)+4):(y3(2)+3));
    a12 = str2double(a12);
    a13 = tline3((y3(2)+4): (y3(3)+3));
    a13 = str2double(a13);
    a14 = tline3((y3(3)+4): (y3(4)+3));
    a14 = str2double(a14);

    % Creating species folders
    subfolder_name = species_name;
    mkdir(['D:NASA Species',species_name]);
    cd(['D:NASA Species',species_name]);

    T = linspace(t1,t3,100);

    %Calculating specific heat
    Cp = specific_heat(a1,a2,a3,a4,a5,a6,a7,a8,a9,a10,a11,a12,a13,a14,T,R,t2);

    %Calculating enthalpy
    H = enthalpy(a1,a2,a3,a4,a5,a6,a7,a8,a9,a10,a11,a12,a13,a14,T,R,t2);

    %Calculating entropy
    S = entropy(a1,a2,a3,a4,a5,a6,a7,a8,a9,a10,a11,a12,a13,a14,T,R,t2);

    % Plotting graph
    % T vs Specific heat
    figure(1)
    plot(T,Cp)
    title(species_name)
    xlabel('Temperature')
    ylabel('Specific Heat')

    % T vs enthalpy
     figure(2)
     plot(T,H)
     title(species_name)
     xlabel('Temperature')
     ylabel('Enthalpy')

     % T vs Entropy
     figure(3)
     plot(T,S)
     title(species_name)
     xlabel('Temperature')
     ylabel('Entropy')

   % Saving the plot in the respective directory
     saveas (1, 'T vs Cp.jpg')
     saveas (2, 'T vs H.jpg')
     saveas (1, 'T vs S.jpg')

     % Function for molecular weight
     Molecular_weight = Mw(species_name)
     fprintf('Molecular Weight of %s is %f n',species_name,Molecular_weight);

end
fclose(f1);
Function for Specific Heat:
% Function for Specific Heat
function Cp = specific_heat(a1,a2,a3,a4,a5,a6,a7,a8,a9,a10,a11,a12,a13,a14,T,R,t2)
if T >=t2
    Cp = (a8+(a9.*(T))+(a10.*(T.^2))+(a11.*(T.^3))+(a12.*(T.^4)))*R;
else
    Cp = (a1+(a2.*(T))+(a3.*(T.^2))+(a4.*(T.^3))+(a5.*(T.^4)))*R;

end
Function for Enthalpy:
% Function for Enthalpy
function H = enthalpy(a1,a2,a3,a4,a5,a6,a7,a8,a9,a10,a11,a12,a13,a14,T,R,t2)
if T < t2
    H = (a8+((a9.*(T)./2))+(a10.*(T.^2)./3)+(a11.*(T.^3)./4)+(a12.*(T.^4)./5)+(a13./T))*R.*T;
else
    H = ((a1)+((a2.*(T)./2))+(a3.*(T.^2)./3)+(a4.*(T.^3)./4)+(a5.*(T.^4)./5)+(a6./T))*R.*T;
end
Function for Entropy
% Function for Entropy
function S = entropy(a1,a2,a3,a4,a5,a6,a7,a8,a9,a10,a11,a12,a13,a14,T,R,t2)
if T >=t2
    S = ((a8.*log(T))+(a9.*T)+((a10.*(T.^2))./2)+((a11.*(T.^3))./3)+((a12.*(T.^4))./4)+a14)*R;

else
    S = ((a1.*log(T))+(a2.*T)+((a3.*(T.^2))./2)+((a4.*(T.^3))./3)+((a5.*(T.^4))./4)+a7)*R;
end
Function for Molecular Weight:
% Function for Molecular weight
function Molecular_weight = Mw(species_name)
Molecular_weight = 0;
atoms = ['H','C','N','O','Ar'];
atomic_weight = [1 12 14 16 40];

for k = 1:length(species_name)
    for j = 1:length(atoms)
        if strcmp(species_name(k),atoms(j))
            Molecular_weight = Molecular_weight + atomic_weight(j);
            position = j;
        end
    end

    n = str2double(species_name(k));
    if n>1
        Molecular_weight = Molecular_weight + (atomic_weight(position)*(n-1));
    end
end
end
Explanation:
. line 6 opens and reads the THERMO.dat file.
. line 7 reads the first line of the file.
. lines 10 to 13 reads the data of gobal temperature.
. lines 16 to 18 skips the header information.
. line 21 defining the gas constant R.
. lines 24 to 124 creating a for loop to find the coefficients and molecular weights of each species.
. Lines 27 to 29 gets the species name.
. lines 32 to 39 fetching and storing the local temperature values.
. lines 42 to 75 provides the coefficients temperature values.
. lines 78 to 80 creating the directory and setting directory path to store individual species to save the plots
. line 82 defining the temperature range.
. line 85 calculates specific heat by calling the function created.
. line 88 calculates enthalpy by calling the function created.
. line 91 calculates entropy by calling the function created.
. Lines 95 to 118 generates plots for each species and saves T vs Cp, T vs H and T vs S in the specified directory.
. Lines 121 & 122 generates the molecular weight of each species by calling the function created.
. line 125 closes the opened file after lopp is excuted.
Output:
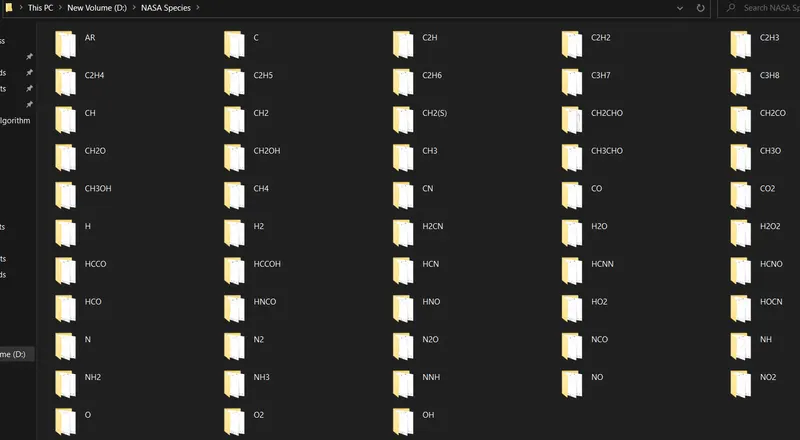
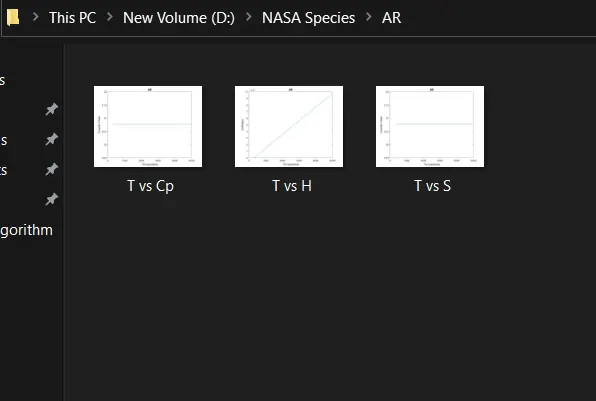
Folder for each Species with plots saves.
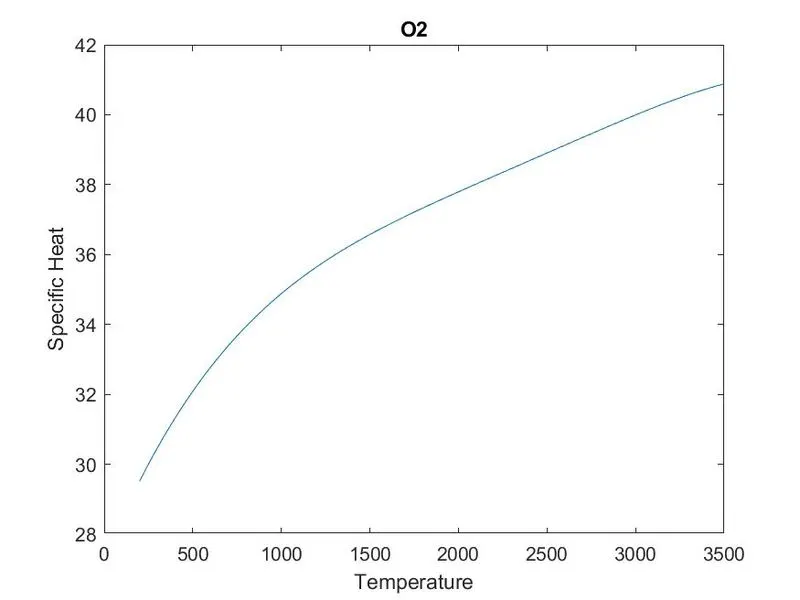
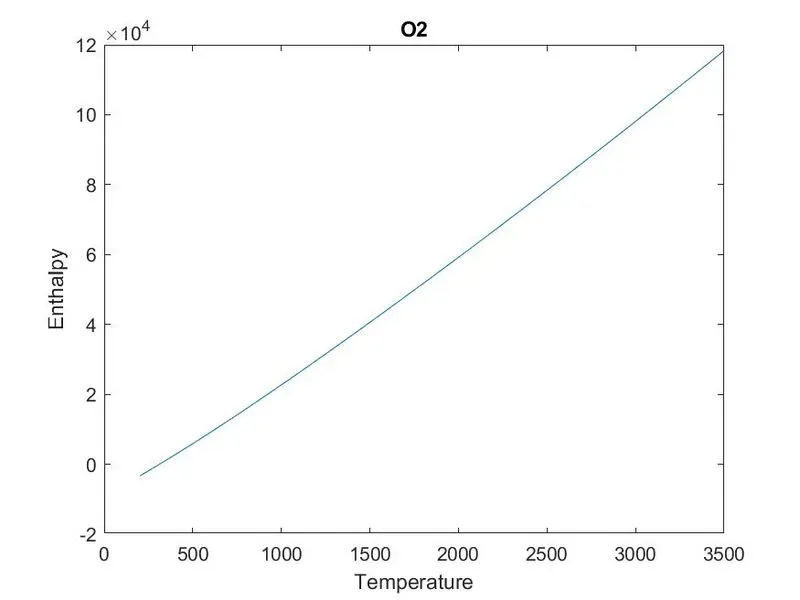
Plot for O2:
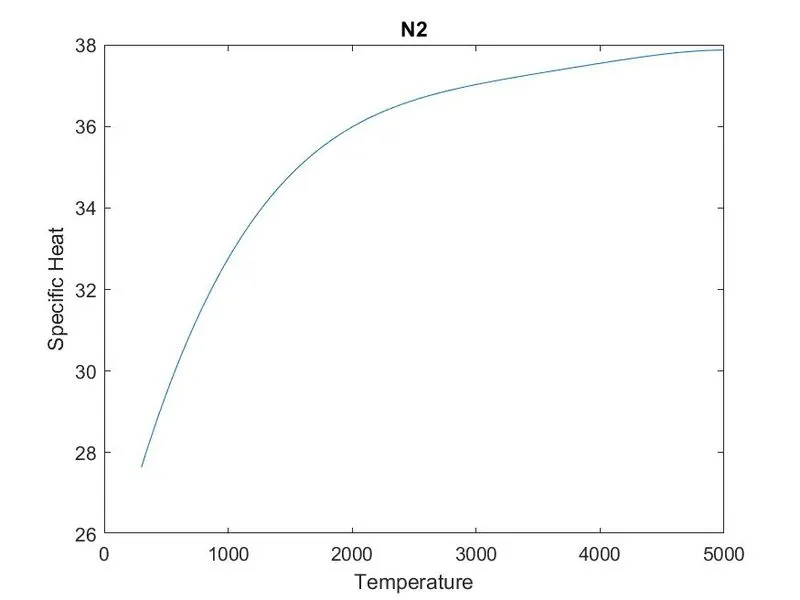
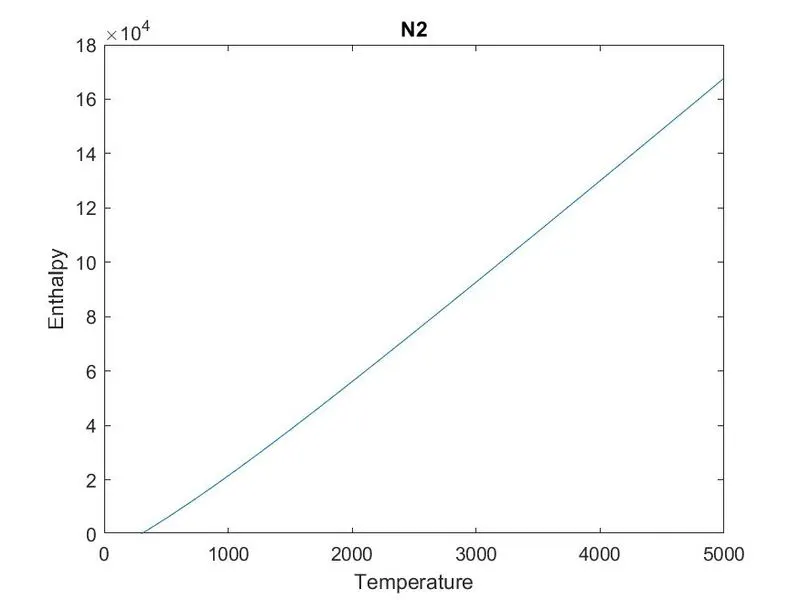
Plots for N2:
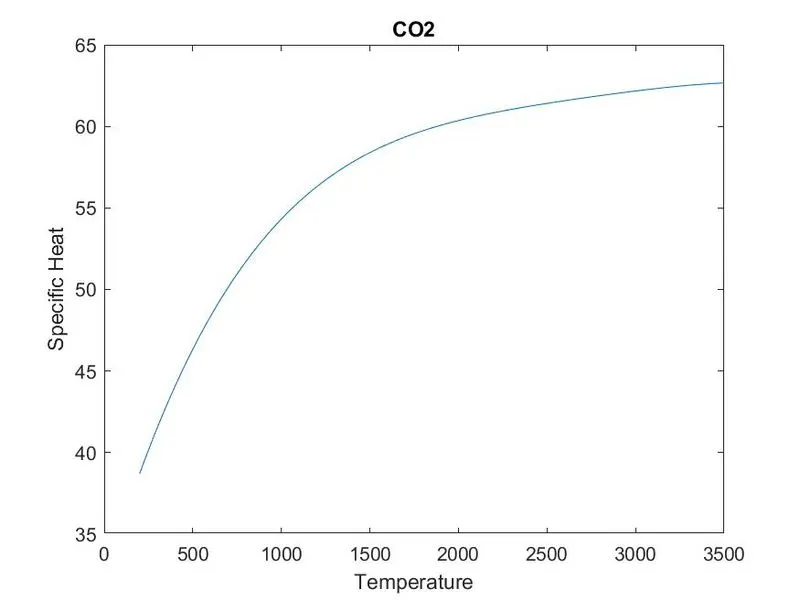
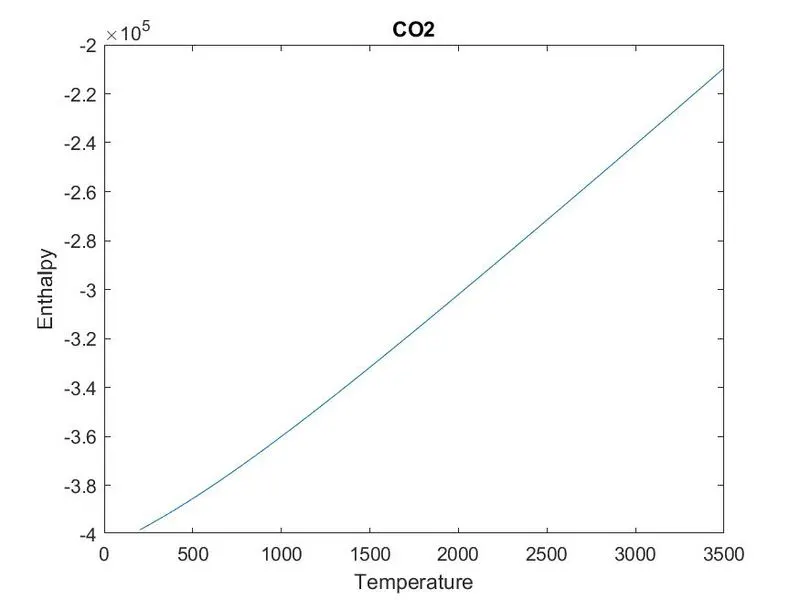
Plots for Co2:
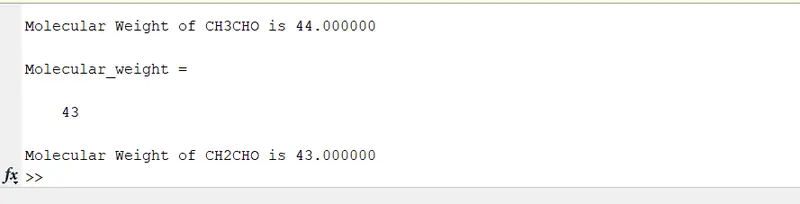
Molecular Weight for each species: