PROJECT 1 - PARSING NASA THERMODYNAMIC DATA
AIM:
Write a program in MATLAB to read and study the NASA thermodynamic data file.
OBJECTIVE:
- To parse the NASA thermodynamic data file and to study the thermodynamic properties of all the species.
THEORY:
- The meaning of file parsing is to read the available data and to split the data into pieces so the data can be stored and manipulated according to our requirements.
- This file parsing technique is can be used to extract the important data from the simulation files and by this, the important data packages can be solved.
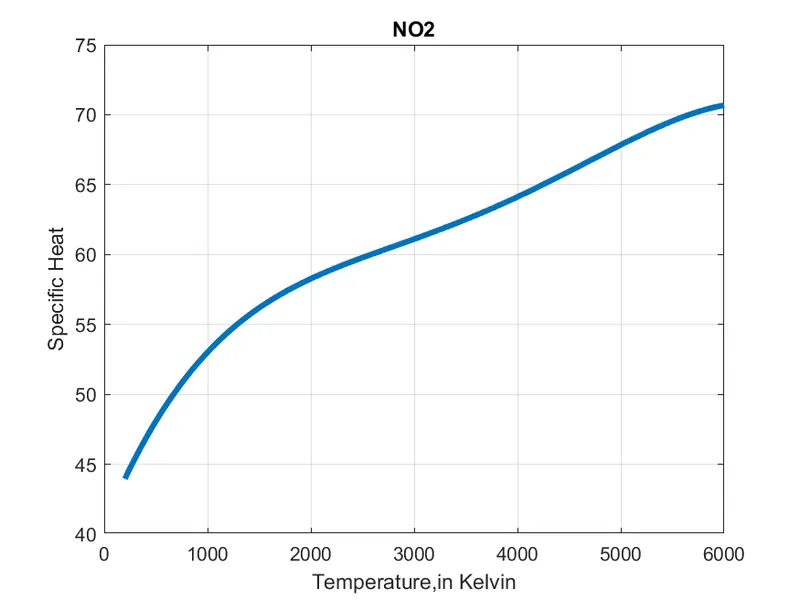
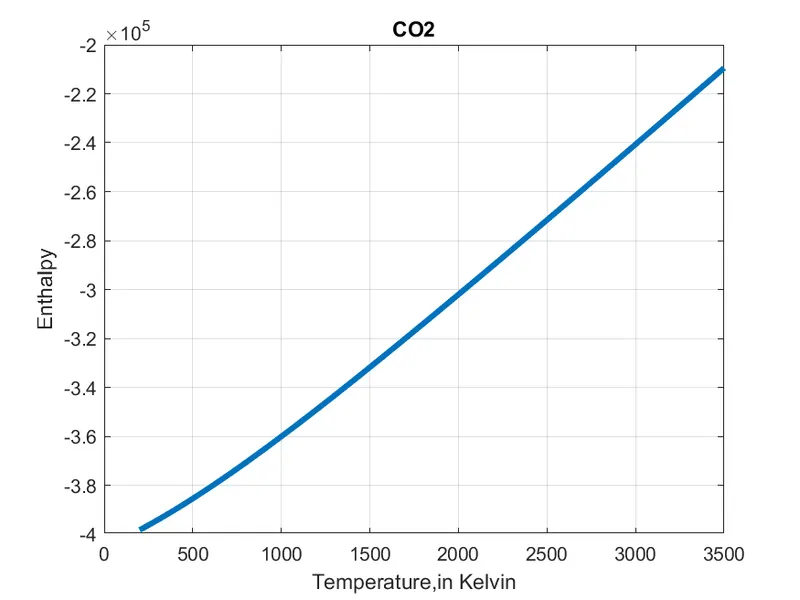
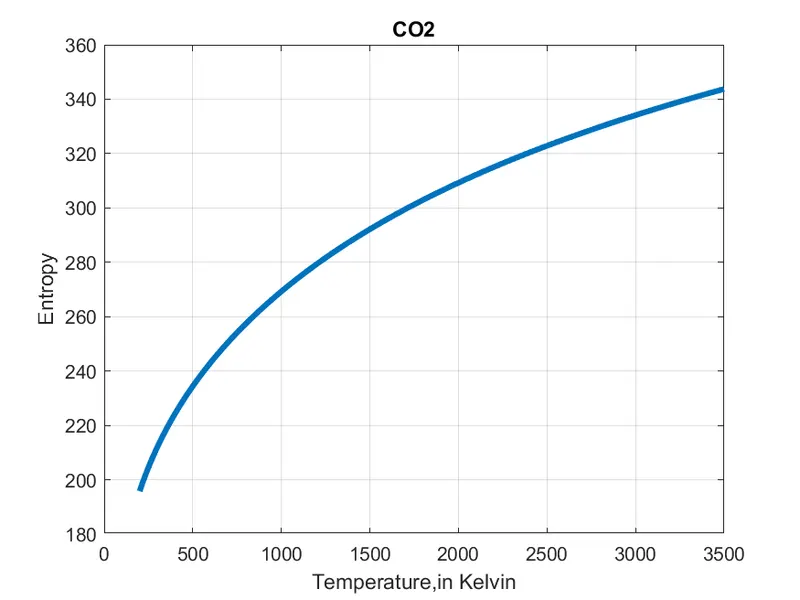
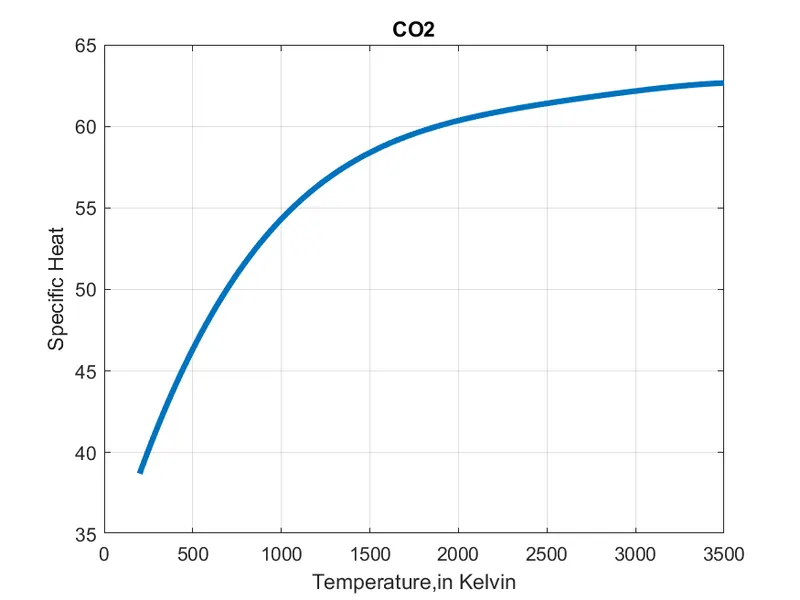
- In this project, the values of the coefficient for various species extracted while working at respective temperatures are given in the form of string data. The task is to read those coefficient values for all the species present and use them to study the ‘Enthalpy’, ‘Entropy’, and ‘Specific Heat’ values.
METHODOLOGY:
- Analysis of data file and understanding the project objective.
- Splitting the major data into a number of small objectives like extraction of the species name and its type, reading the global and local temperature data, also reading the values of the coefficients for various species.
- Writing code to plot the Enthalpy, Entropy, and Specific Heat graphs with respect to temperature.
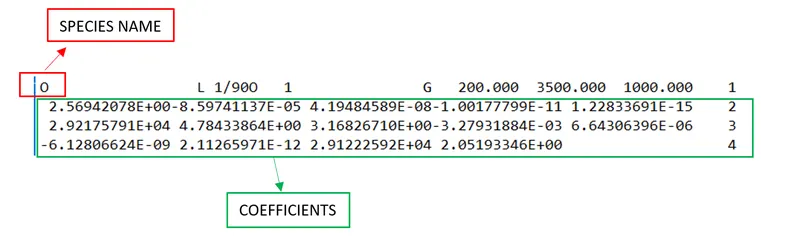
INPUTS:
[CODE]
PARSING CODE:
%% Initial Clearing the workspace.
clc
clear all
close all

%% For Reading the Header file

f1 = fopen('THERMO.dat','r');
fgetl(f1)


%% For reading the temperature data
A = fgetl(f1);

A = strsplit(A,' ');
global_low_temp = str2num(A{2});
global_mid_temp = str2num(A{3});
global_high_temp = str2num(A{4});

%% Skipping the next 3 lines
for i = 1:3
    fgetl(f1);
end

%% Reading the further species data.

for i = 1:53
    % Reading the temperature values for particular species from next line
    header = fgetl(f1);
    headersplit = strsplit(header,' ');
    species_name = headersplit{1};
    z = length(headersplit);
    temp1 = str2double(headersplit(z-3));
    temp3 = str2double(headersplit(z-2));
    temp2 = str2double(headersplit(z-1));

    % Reading the coefficient values for mono atomic oxygen from first line
    line_1 = fgetl(f1);
    a = strfind(line_1,'E');
    a1 = str2num(line_1(1:a(1)+3));
    a2 = str2num(line_1(a(1)+4:a(2)+3));
    a3 = str2num(line_1(a(2)+4:a(3)+3));
    a4 = str2num(line_1(a(3)+4:a(4)+3));
    a5 = str2num(line_1(a(4)+4:a(5)+3));

    % Reading the coefficient values for mono atomic oxygen from second line
    line_2 = fgetl(f1);
    b = strfind(line_2,'E');
    a6 = str2num(line_2(1:b(1)+3));
    a7 = str2num(line_2(b(1)+4:b(2)+3));
    a8 = str2num(line_2(b(2)+4:b(3)+3));
    a9 = str2num(line_2(b(3)+4:b(4)+3));
    a10 = str2num(line_2(b(4)+4:b(5)+3));

    % Reading the coefficient values for mono atomic oxygen from second line
    line_3 = fgetl(f1);
    c = strfind(line_3,'E');
    a11 = str2num(line_3(1:c(1)+3));
    a12 = str2num(line_3(c(1)+4:c(2)+3));
    a13 = str2num(line_3(c(2)+4:c(3)+3));
    a14 = str2num(line_3(c(3)+4:c(4)+3));

    %% making of directory
    mkdir(species_name)
    cd(species_name)

    %% Calculating the value of Cp, H and S
    R = 8.314;
    T = linspace(temp1,temp3,1000);

    for k = 1:length(T)
        if T(k) > temp2
            % High Temperature range
            Cp = (a1 + (a2.*T) + (a3.*T.^2) + (a4.*T.^3) + (a5.*T.^4)).*R;

            H = (a1 + (a2.*T)./2 + (a3.*T.^2)./3 + (a4.*T.^3)./4 + (a5.*T.^4)./5 + (a6./T)).*R.*T;

            S = (a1.*log(T) + (a2.*T) + (a3.*T.^2)./2 + (a4.*T.^3)./3 + (a5.*T.^4)./4 + a7)*R;
        else
            %Low Temperature Range
            Cp = (a8 + (a9.*T) + (a10.*T.^2) + (a11.*T.^3) + (a12.*T.^4)).*R;

            H = (a8 + (a9.*T)./2 + (a10.*T.^2)./3 + (a11.*T.^3)./4 + (a12.*T.^4)./5 + (a13./T)).*R.*T;

            S = (a8.*log(T) + (a9.*T) + (a10.*T.^2)./2 + (a11.*T.^3)./3 + (a12.*T.^4)./4 + a14).*R;
        end
    end

    %% Plotting the Entropy, Enthalpy and specific heat with respect to
    % temperature

    % Entropy and temperature
    figure(1)
    plot(T,S,'Linewidth',3)
    xlabel('Temperature,in Kelvin');
    ylabel('Entropy');
    title(species_name);
    grid on
    saveas(1,'Entropy.png')

    % Enthalpy and temperature
    figure(2)
    plot(T,H,'Linewidth',3)
    xlabel('Temperature,in Kelvin');
    ylabel('Enthalpy');
    title(species_name);
    grid on
    saveas(2,'Enthalpy.png')

    % Specific Heat and temperature
    figure(3)
    plot(T,Cp,'Linewidth',3)
    xlabel('Temperature,in Kelvin');
    ylabel('Specific Heat');
    title(species_name);
    grid on
    saveas(3,'Specific Heat.png')
    cd ..

    %% To Calculate the molecular weight

    Atoms =  ['H','O','C','N','A']; % Here A is specified for Argon
    atomic_wt = [1,16,12,14,40];
    molecular_wt = 0;

    for i = 1 : length(species_name)
        for j = 1 : length(Atoms)
            if strcmp(species_name(i),Atoms(j))
                molecular_wt = molecular_wt + atomic_wt(j);
                u = j;
            end
        end

        n = str2double(species_name(i));
        if n > 1
            molecular_wt = molecular_wt + atomic_wt(u)*(n-1);
        end
    end

    fprintf('Molecular weight of %s: ',species_name)
    fprintf(' %d ',molecular_wt)
    fprintf(' ')
    fprintf('amu \n')

end
EXPLANATION:
The software used for the programming purpose is MATLAB R2019b.
- The program starts with clc, clear all, close all
- clc helps in clearing the command window.
- Clear all clears all the data in the workspace
- Close all closes all the window of figure opened in the background.
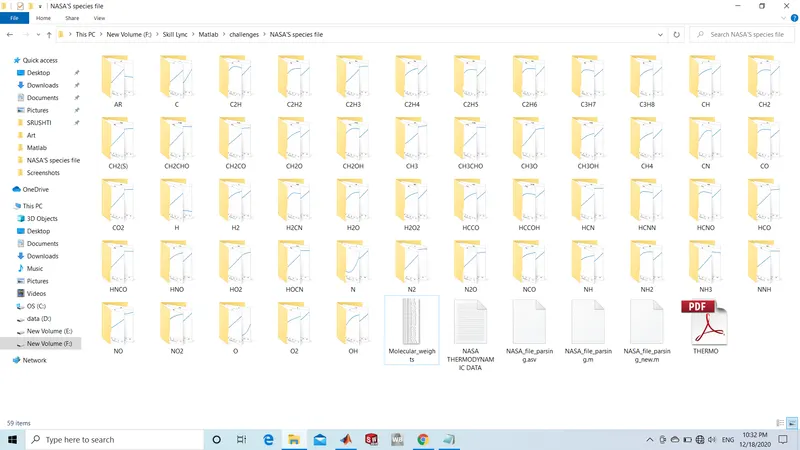
- The code is divided into certain sections which contain reading the file, plotting the Enthalpy, Entropy, and Specific heat graph, creating the folders for various species, calculating the molecular weight for all the species.
- By using ‘fopen’ command the THERMO.DRT file is can be read.
- For reading the file line by line ‘fgetl’ command is used.
- Now, for reading the global temperature data ‘’STRSPLIT’ and ‘STR2NUM’ commands are used.
- ‘STRSPLIT’ command, is used to split the string in a particular format using the ‘Delimiter’. The delimiter can be anything which is common in the whole string.
- ‘STR2NUM’ command converts any number present in the string into a number specifically.
- For skipping the unwanted files, ‘fgetl’ command is used to read and ignore the unwanted files.
- In the ‘THERMO.DRT’ file, there are 53 species that need to be studied. So, a for loop command will help to perform the loop and calculate the H, S, and Cp values using all 14 coefficients.
- For finding the values of the coefficients, ‘fgetl’ will read the string line from the data file and the logic here used is that, every coefficient contains the ‘E’ so by using the ‘STRFIND’ command the position of ‘E’ will be determined.
- Now, by defining the position of ‘E’ in the string the values of the coefficient can be determined.
- By the ‘STR2DOUBLE’ command the number in string format will be converted into a number specifically.
- Similar will be done for reading all coefficient values for all 53 species.
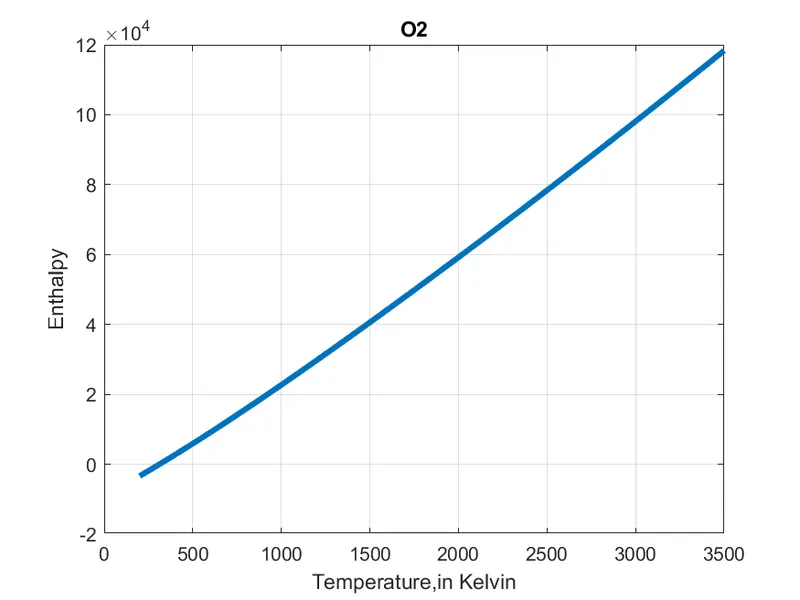
- After reading the coefficient values, it will be used in governing equations for finding the ‘Enthalpy’, ‘Entropy’, and ‘Specific Heat’ values for all the 53 species.
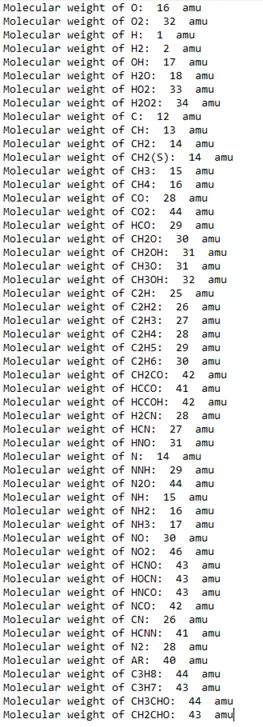
FOR CALCULATING THE MOLECULAR WEIGHT:
- A separate array for atoms and the molecular weight is defined.
- By using the for loop, molecular weight is calculated.
- For the length of species_name and for the length of atoms, the molecular weight will be the sum of the respective species.
- For printing the molecular weight value, %d is used.
OUTPUTS:
Molecular Weight:
Screenshot of all folders:
Species O2:
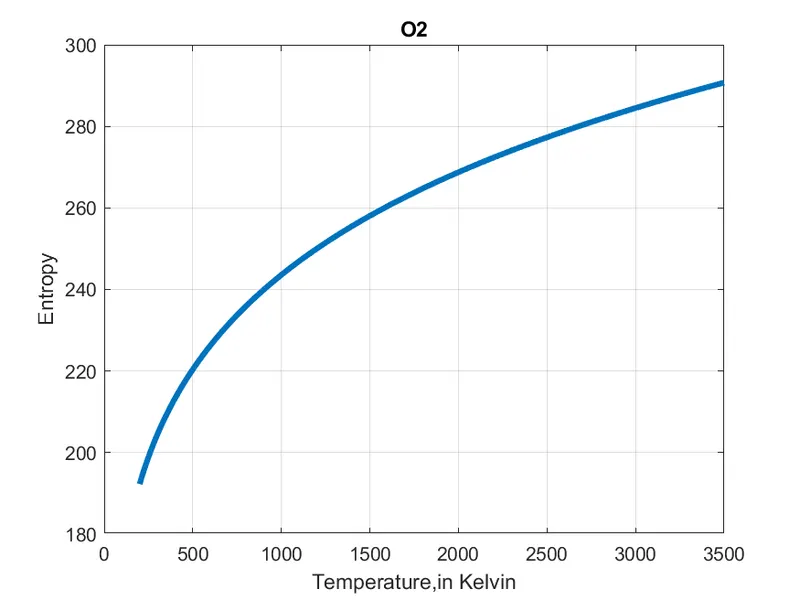
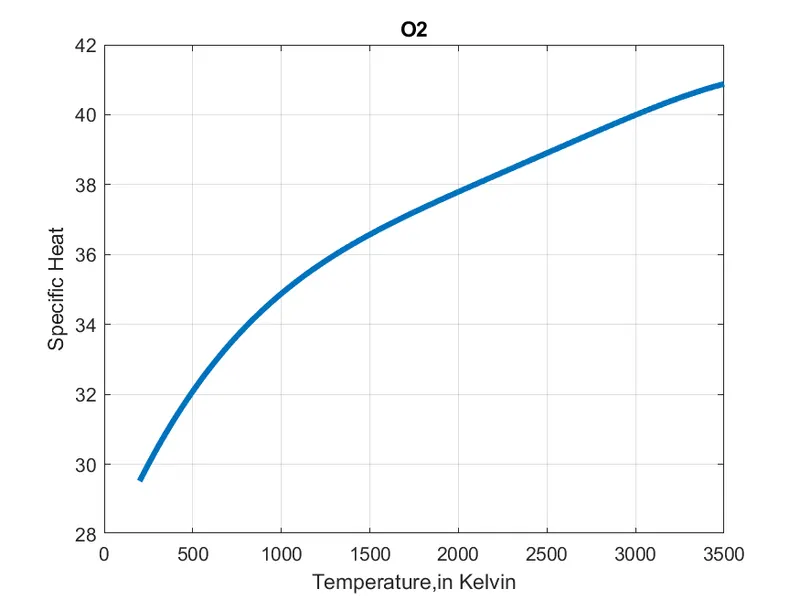
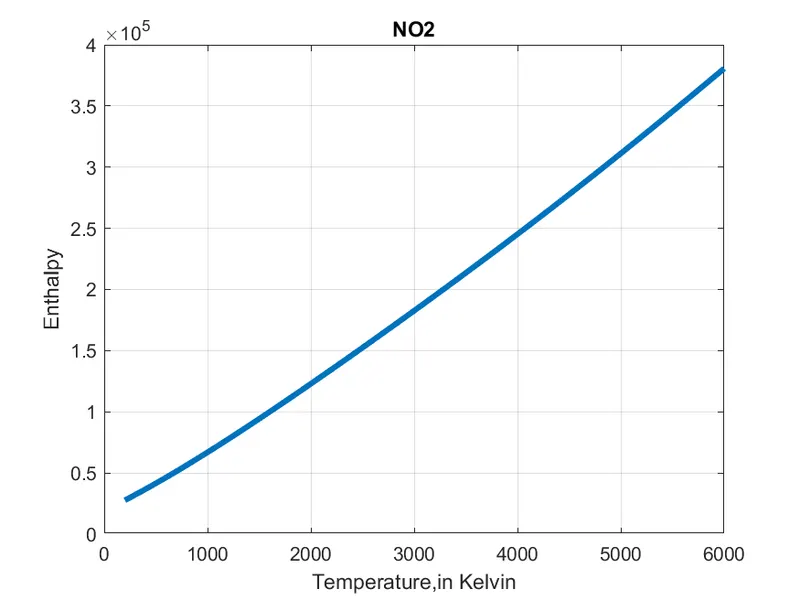
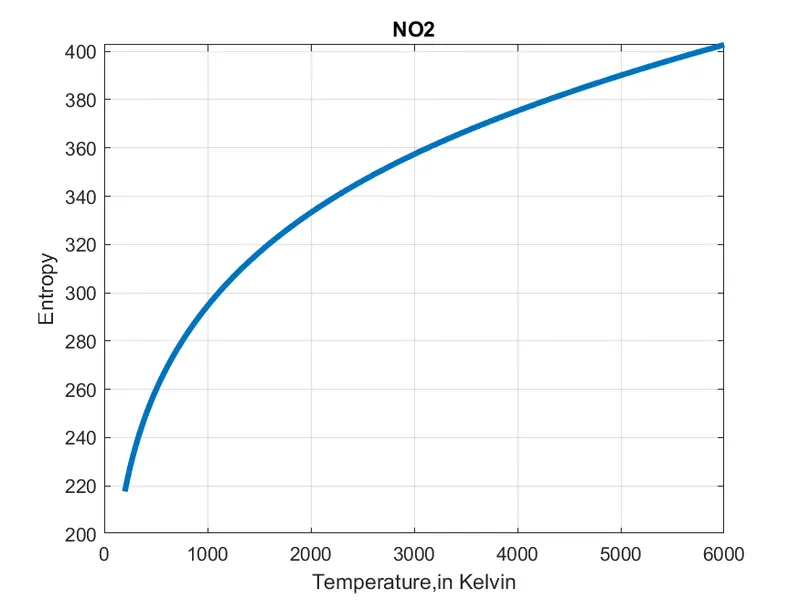
Species NO2:
Species CO2:
CONCLUSION:
- Hence, we studied the file parsing technique in MATLAB
- Plotted the Enthalpy, Entropy, and Specific heat data from the coefficient available in 'THERMO.DRT' file.