Project 1 - Parsing NASA thermodynamic data
AIM:
- to extract the coefficients from the following file and i.e thermo.dat and creating the program to calculate the specific heat, enthalpy, entropy.
- and to calculate the molecular weight of each species.
- and plotting the graph for the (temperature) versus enthalpy, entropy, specific heat.
- and w are finding the local temperature range. and finding the coefficients for that.
EQUATIONS:
`c_p/R=(a1+a2*T+a3*T^2+a4*T^3+a5*T^4)`
`h/R=(a1+a2*T/3+a3*T^2/3+a4*T^3/4+a5*t^4/5+(a6_/T))`
`s/R=a1 ln(T)+a2*T+a3*T^2+a4*T^3/4+a4*T^3/4+a5*T^4/4+a7)`
PROGRAMMING LOGIC:
- close all command is used to close all the data which is present in the workspace.
- clear all command is used to clear all the data which is stored in the workspace.
- we are using the fopen command to open the file and inside that, we are using the r command that is used to read into the file. getting the information from it.
- we are skipping line 1 of the file which is not useful for us, i.e 'THERMO' which written on the first line of the given file.
- we are getting the line by the command line2=fgetl(f1); which contains the data of the global temperature ranges. high, mid, low global temperatures and we are not using them so just we are assigning the values to that given data i.e the second line of the file.
- the strsplit command is used to split the string. the string generally present in the cell array but we have to assign the value to each variable by using the command global_low_temp=str2double(A{2}); we are using the flower brackets here because it is a special type of array that is a cell array. by using the str2double command we are storing the value.
- skipping line 3 by using the fgetl command split3=fgetl(f1);.
- skipping line 4 by using the fgetl command split4=fgetl(f1);.
- skipping line 5 by using the fgetl command split5=fgetl(f1);. fgetl command is also used to skip the line.
- we are assigning the k=1 because there are 3 figures we are using the for loop there we have to take plot each time we run the for a loop.
- we are assigned i value to temperature range. so for loop, we are assigning the value of j=1:53 because there are 53 species in the given thermp.dat file.
- we are reading line 6 from the original data file by the command fgetl.
- after reading we are splitting line 6 using the strsplit command which is in the cell array and we convert it to single values.
- species_name = B{1}; we are assigning the value of b{1} to species name because it is present in the at the first place.
- number_of_atoms=str2double(B{4}); , we are assigning the value for the number of atoms .
- again we are assigning the value for local mid, high, low temperature using the str2double command which splits and assigns the value to the given temperature.
- we are reading line 7 by using the fgetl command.
- we have coefficients in line 7 so for that, we are assigning as b= b=strfind(line7,'E') and we are finding the letter B using the strfind command.
- we are finding the coefficients from line 7. line7=[2.56942078E+00 -8.59741137E-05 4.19484589E-08 -1.00177799E-11 1.22833691E-15 2] we find the position of letter E from the file (1:b(1)+3) 1 is the starting point of the b(1) is 12th position and +3 where we are ending the extraction of coefficients. after 12th position the value doesn't use in the calculation purpose.
- for b3, b4, b5, are using the same logic here by knowing the position of ending of coefficient 1 .next position is the starting point of coefficient 2 and so on we use the same logic for calculation of the coefficients from line7.
- we are reading line 7 by using the fgetl command.
- we are not finding the position of E because we already know it.
- we are finding the coefficients from line 7. line7=[2.56942078E+00 -8.59741137E-05 4.19484589E-08 -1.00177799E-11 1.22833691E-15 2] we find the position of letter E from the file (1:b(1)+3) 1 is starting point of the b(1) is 12th position and =3 where we are ending the extraction of coefficients.
- we are finding the coefficients from line8=[ 2.92175791E+04 4.78433864E+00 3.16826710E+00 -3.27931884E-03 6.64306396E-06 3 ] we find the position of letter E from the file b6=line8 (1:b(1)+3) 1 is starting point of the b(1) is 12th position and =3 where we are ending the extraction of coefficients.
- for b6, b7, b8, b9, b10 are using the same logic here by knowing the position of ending of coefficient 1 .next position is the starting point of coefficient 2 and so on we use the same logic for calculation of the coefficients from line7.
- we are reading line 9 by using the fgetl command
- we are finding the coefficients from line9=[-6.12806624E-09 2.11265971E-12 2.91222592E+04 2.05193346E+00 4]we find the position of letter E from the file b11=line8 (1:b(1)+3) 1 is starting point of the b(1) is 12th position and =3 where we are ending the extraction of coefficients. there are only 4 coefficients so we are finding the coefficients till b14.
- we are finding the coefficients from line9=[-6.12806624E-09 2.11265971E-12 2.91222592E+04 2.05193346E+00 4]we find the position of letter E from the file b11=line8 (1:b(1)+3) 1 is starting point of the b(1) is 12th position and =3 where we are ending the extraction of coefficients. there are only 4 coefficients so we are finding the coefficients till b14.
- we are finding the coefficients from line9=[-6.12806624E-09 2.11265971E-12 2.91222592E+04 2.05193346E+00 4]we find the position of letter E from the file b11=line8 (1:b(1)+3) 1 is starting point of the b(1) is 12th position and =3 where we are ending the extraction of coefficients. there are only 4 coefficients so we are finding the coefficients till b14.
- for b11, b12, b13, b14 are using the same logic here by knowing the position of ending of coefficient 1 .next position is the starting point of coefficient 2 and so on we use the same logic for the calculation of the coefficients from line9.
- we are assigned the value to universal gas constant R=8.314.
- linspace command here because we want a value between local high_temp and local_low_temp.
- using for loop here because we have to calculate enthalpy, entropy, specific heat, for 53 different species.
- use if statement here because we have to calculate enthalpy, entropy, specific heat for both low temperature and high-temperature coefficients.
- now we have to calculate the specific heat, enthalpy, entropy for the low-temperature coefficients from b1-b7, we use three formulas here we, mentioning t(i) because t is running for multiple iterations.
- else condition is used where we have 2 conditions.
- now we have to calculate the specific heat, enthalpy, entropy for the low-temperature coefficients from b8-b14, we use three formulas here, we mentioning t(i) because t is running for multiple iterations.
- using mkdir command because to create a folder of species name so we mention current directory and, the species name.
- for creating a path we gave h1 to figure, and(k) given because the value of figure changes each time we execute for loop.
- plotting the temperature vs specific heat
- for creating path we gave h2 to figure, and(k+1) given because the value of figure changes each time we execute for a loop.
- for creating a path we gave h3 to figure, and(k+1) given because the value of the figure changes each time we execute for a loop.
- plotting the temperature vs specific heat.
- labeling the x-axis as temperature.
- labeling the y-axis as specific heat.
- in the title itself, we are assigning the species name.
- for the figure(k+1) we are following the same procedure as what we are doing for the figure(k), labeling the axis and giving the title for the figure.
- for the figure(k+2) also we are following the same procedure what we are doing for figure(k), labeling the axis and giving the title for the figure
- for the figure (k), (k+1), (k+2) we ate creating the path by naming them as h1, h2, h3.
- we have to enter sprintf(in which we have to mention the current directory, and give the name of the graph and species name).
- using the saveas command to save the figure in the species folder.
- we are incrementing the value of k because it needs to change for every iteration.
- we are calling the function here.
- we are using sprintf statement to values for species name and molecular weight.
- display command is used to display the given command.
CODE:
close all;                                                         %CLOSE ALL COMMAND IS USED TO CLOSE ALL THE INFORMATIOM FROM THE GIVEN COMMAND WINDOW
clear all;                                                         %CLEAR ALL COMMAND IS USED TO CLEAR ALL THE INFORMATION IN THE WORKSPACE.
clc;

% opening and reading the data from file THERMO.dat
f1=fopen('THERMO.dat','r');                                         %WE ARE OPENING THE FILE USING THE FOPEN COMMAND INSIDE THAT WE ARE GIVING THE FILE NAME


%SKPPING RIRST LINE
skip1=fgetl(f1);                                                   %WE ARE SKIPPING THE FIRST LINE OF THE FILE IN WHICH THE THE NAME OF THE FILE IS GIVEN


%SPLITTING DATA OF SECOND LINE


line2=fgetl(f1);                                                  %the strsplit command is used to split the string. the string generally present in the cell array but we have to assign the value to each variable by using the command  str2double;  we are using the flower brackets here because it is a special type of array that is a cell array. by using the str2double command we are storing the value.
A=strsplit(line2);

 global_low_temp=str2double(A{2});                                %we are getting the line by the command line2=fgetl(f1);  which contains the data of the global temperature ranges. high, mid, low global temperatures and we are not using them so just we are assigning the values to that given data i.e the second line of the file.
 global_mid_temp=str2double(A{3});
 global_high_temp=str2double(A{4});


 % SKIPPING 3,4,5 LINES BECAUSE THERE IS NO DATA
  spip3=fgetl(f1);                                              %skipping line 3 by using the fgetl command .
  skip4=fgetl(f1);                                              %skipping line 4 by using the fgetl command .
  skip5=fgetl(f1);                                              %skipping line 5 by using the fgetl command .

  k=1;                                                          %we are assigning the the k=1 because the figures are the figures are theree we are using the for loop there we have to take plot each time we arun the for loop.

  for j=1:13                                          %we are assigned i value to temprature range. so for lopp we are assigning the value of i 1:53 because there are 53 species in the given thermp.dat file
%OBTAINING THE DATA FROM THE 6TH LINE OF THE GIVEN FILE AND SPLITTING
line6=fgetl(f1);                                                % we are reading the line 6 from the original data file by the command fgetl.


%SPLITTING THE 6TH LINE FOR ASSINING THE VALUE FOR EACH DATA GIVEN IN LINE6
B=strsplit(line6);                                              %after reading we are splitting the line 6 using the strsplit command which is in cell array and we convert it to single values.


%WE ARE ASSIGNING THE VAKUE FOR LO MID AND HIGH TEMPRATURES, SPECIES NAME , NUMBER OF ATOMS
  species_name = B{1};                                         %after reading we are splitting line 6 using the strsplit command which is in the cell array and we convert it to single values.
  number_of_atoms=str2double(B{4});
  local_low_temp=str2double(B{end-3});                          %again we are assigning the value for local mid,high,low temperature using the str2double command which splits and assigns the value to given temperature
  local_high_temp=str2double(B{end-2});
  local_mid_temp=str2double(B{end-1});


%FINDING THE COEFFICIENTS FOR THE 7TH LINE OF DATA GIVEN IN FILE
%using the notation SMALL (b) for temprature co efficients
 line7=fgetl(f1);                                             %we are reading the line 7 by using the fgetl command
 b=strfind(line7,'E');                                        %we have co efficients in the line 7 so for that we are assigning as b= b=strfind(line7,'E') and we are finding the letter B using the strfind command.


%FINDING CO EFFICIENTS FOr line 7 GIVEN IN ORIGINAL DATA FILE
 b1=line7(1:b(1)+3);
 b1=str2num(b1);

 b2=line7(b(1)+4:b(2)+3);
 b2=str2num(b2);                                             %we are finding the coefficients from line 7. line7=[2.56942078E+00	-8.59741137E-05	 4.19484589E-08	-1.00177799E-11	 1.22833691E-15	    2] we find the position of letter E from the file (1:b(1)+3) 1 is srarting point of the b(1) is 12th position and =3 where we are ending the extraction of coefficients.

 b3=line7(b(2)+4:b(3)+3);                                    %for b3, b4, b5, are using the same logic here by knowing the position of ending of coefficient 1 .next position is the starting point of co efficient 2 and so on we use same logic for calculation of the coefficients from line7.
 b3=str2num(b3);

 b4=line7(b(3)+4:b(4)+3);
 b4=str2num(b4);

 b5=line7(b(4)+4:b(5)+3);
 b5=str2num(b5);


%READING THE 8TH LINE OF THE ORIGINAL DATA FILE
line8=fgetl(f1);                                                           % we are reading the line 8 by using the fgetl command.

                                                                           %we are not finding the position of E because we already know it.
%FINDING THE CO EFFICIENTS FOR THE 8TH LINE OF ORIGINAL DATA FILE
  b6=line8(1:b(1)+3);
  b6=str2num(b6);                                                          %we are finding the coefficients from line8=[ 2.92175791E+04	 4.78433864E+00	 3.16826710E+00	-3.27931884E-03	 6.64306396E-06	    3 ] we find the position of letter E from the file b6=line8 (1:b(1)+3) 1 is srarting point of the b(1) is 12th position and =3 where we are ending the extraction of coefficients.

  b7=line8(b(1)+4:b(2)+3);
  b7=str2num(b7);                                                          %for b6, b7, b8, b9, b10 are using the same logic here by knowing the position of ending of coefficient 1 .next position is the starting point of coefficient 2 and so on we use same logic for calculation of the coefficients from line7.

  b8=line8(b(2)+4:b(3)+3);
  b8=str2num(b8);

  b9=line8(b(3)+4:b(4)+3);
  b9=str2num(b9);

  b10=line8(b(4)+4:b(5)+3);
  b10=str2num(b10);


%READING THE DATA FROM THE 9TH LINE OF ORIGINAL DATA FILE GIVEN
line9=fgetl(f1);


%FINDING THE CO EFFICIENTS FROM THE 8 TH LINE OF DATA

b11=line9(1:b(1)+3);
b11=str2num(b11);                                                           %we are finding the coefficients from line9=[-6.12806624E-09	 2.11265971E-12	 2.91222592E+04	 2.05193346E+00	   4]we find the position of letter E from the file b11=line8 (1:b(1)+3) 1 is srarting point of the b(1) is 12th position and =3 where we are ending the extraction of coefficients.

b12=line9(b(1)+4:b(2)+3);                                                   %for b6, b7, b8, b9, b10 are using the same logic here by knowing the position of ending of coefficient 1 .next position is the starting point of coefficient 2 and so on we use same logic for calculation of the coefficients from line7.
b12=str2num(b12);

b13=line9(b(2)+4:b(3)+3);
b13=str2num(b13);

b14=line9(b(3)+4:b(4)+3);
b14=str2num(b14);

%WE ARE ASSINING THE VALUE FOR UNIVERSAL GAS CONSTANT
R=8.314;                                                                   %we are assign the value to universal gas constant


t=linspace(local_low_temp,local_high_temp,1000);                           %we use linspace command here beacuse we want value between local high_temp and local_low_temp.

% calculation
% CALCULATION OF THE SPECIFIC HEAT

for i=1:length(t)                                                           %we are using for loop here beacause we have to clculate enthalpy, entropy, specific heat, for 53 different species.

if  (t(i)>local_mid_temp)                                                   %we use if statement here because we have to calculate enthapy, entropy, specific heat for both low temperature and high temperature coefficients.

   cp(i)=R.*(b1+b2.*t(i)+b3.*(t(i).^2)+b4.*(t(i).^3)+b5.*(t(i).^4));

   H(i)=(b1+(b2.*(t(i)./2))+(b3.*(t(i).^2/3))+(b4.*(t(i).^3/4))+(b5.*(t(i).^4/5))+(b6./t(i))).*t(i)*R;         %now we have to calculate the specific heat, enthalpy, entropy for the low temperature coefficients from b1-b7,we use three formulas here we mentioning t(i) because t is running for multiplr iterations.

   S(i)=(b1.*log(t(i))+(b2.*t(i))+(b3.*(t(i).^2/2))+(b4.*(t(i).^3/3))+(b5.*(t(i).^4/4))+b7).*R;

else                                                                                                          %else condition is used where we have 2 conditions
  cp(i)= R.*(b8+b9.*t(i)+b10.*(t(i).^2)+b11.*(t(i).^3)+b12.*(t(i).^4));

  H(i)=(b8+(b9.*(t(i)./2))+(b10.*(t(i).^2/3))+(b11.*(t(i).^3/4))+(b12.*(t(i).^4/5))+(b13./t(i))).*t(i)*R;      %now we have to calculate the specific heat, enthalpy, entropy for the high temperature coefficients from b8-b14,we use three formulas here we mentioning t(i) because t is running for multiplr iterations.

  S(i)=(b8.*log(t(i))+(b9.*t(i))+(b10.*(t(i).^2/2))+(b11.*(t(i).^3/3))+(b12.*(t(i).^4/4))+b14).*R;

end
end
% creating the forlder and again crating the new folder for saving the image
mkdir( 'D:\salman',species_name);                                            %using mkdir command because to create folder of species name so we mention current directory and, species name


h1=figure(k);                                                                %for creating path we gaven h1 to figure ,and(k) given because the value of figure changes each time we execute for loop.
plot(t,cp);                                                                   %plottingg the temperature vs specific heat
xlabel('temperatuire');                                                        %labelling the x axis as temperature
ylabel('specific heat');                                                       %labelling y axis as specific heat
title('temprature vs specific heat ',species_name);                            %in the title itself we are assigning the species name


h2=figure(k+1);                                                              %for creating path we gaven h2 to figure ,and(k+1) given because the value of figure changes each time we execute for loop.
plot(t,H);
xlabel('temperatuire');                                                      %we are following same procedure as figure(k).
ylabel('enthalpy');
title('temprature vs enthalpy ',species_name);


h3=figure(k+2);                                                             %for creating path we gaven h3 to figure ,and(k+2) given because the value of figure changes each time we execute for loop.
plot(t,S);
xlabel('temperatuire');                                                     %we are following the same procedure we follow for the figure (k).
ylabel('entropy');
title('temprature vs enthalpy ',species_name);

path1=sprintf('D:/salman/%s/temp vs specific heat.png',species_name);      %for figure (k), (k+1), (k+2) we ate creating the path by naming them as h1, h2, h3.
path2=sprintf('D:/salman/%s/temp vs enthalp.png',species_name);             % we have to enter sprintf(in which we have to mention current directory,an give the name of graph,and species name)
path3=sprintf('D:/salman/%s/temp vs entropy.png',species_name);

saveas(h1,path1);                                                          % using the saveas command to save the figure in species foldee.
saveas(h2,path2);
saveas(h3,path3);
k=k+3 ;                                                                    %we are incrimenting the value of k because it needs to change for every iteration.

m_w=mol_weigth(species_name);                                             %we are calling the function here

g=sprintf('Species name = %s\nMolecular Weight = %f',species_name,m_w);    %we are using sprintf statement to values for species name and molecular weigth

disp(g);                                                                   %DISP COMMAND IS USED TO DISPLAY THE G
  end
FUNCTION CODE:
function mol_wt= mol_weigth(species_name)


elements=['O','C','H','A','N','S'];        % we are assigning the value for elements
atomic_mass=[16,12,1,39,14,32];            %coressponding elements elements atomic masses are written

mol_wt=zeros(1,length(species_name));      %assign the value for mol_weigth

for i=1:length(species_name)               %for 1 to length of species name

    if isnan(str2double(species_name(i)));  %if its no a number then i moves to next for loop
        for j=1:length(elements)            % for lopp for 1 to length of elements

            if strcmp(species_name(i),elements(j));  %comparision of both elements
                mol_wt(i)=mol_wt(i)+atomic_mass(j);
            end
        end
    else
        mol_wt(i-1)=mol_wt(i-1)*str2double(species_name(i)); %mol wet is before the number we are multi plying into t-1 before number.
    end

end
mol_wt=sum(mol_wt);

end
RESULTS:
in this screen shots we are showing the species name , molecular weigth which we are calculated through the program
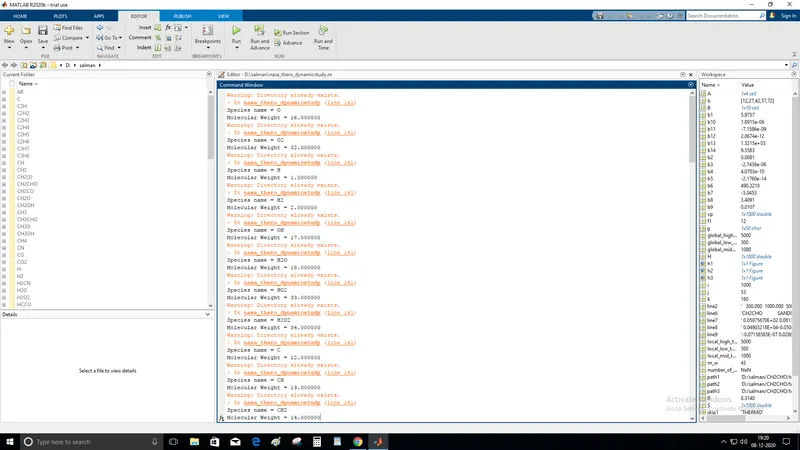
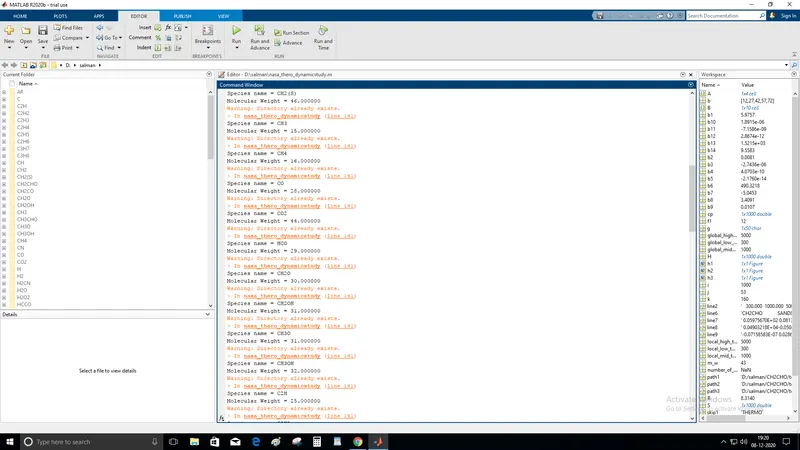
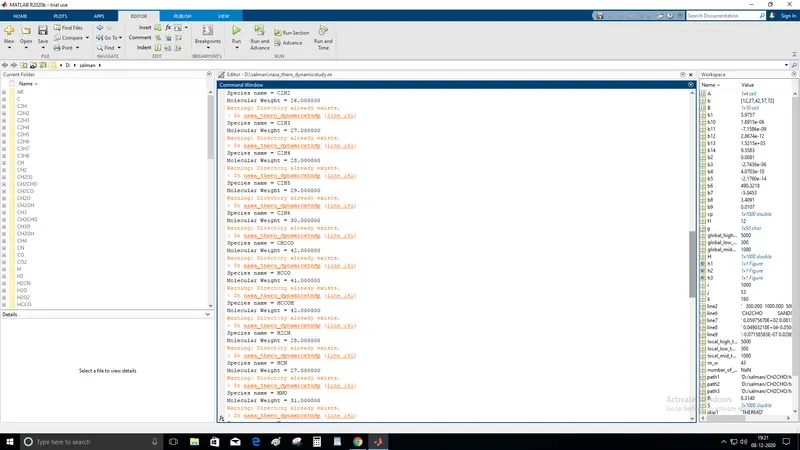
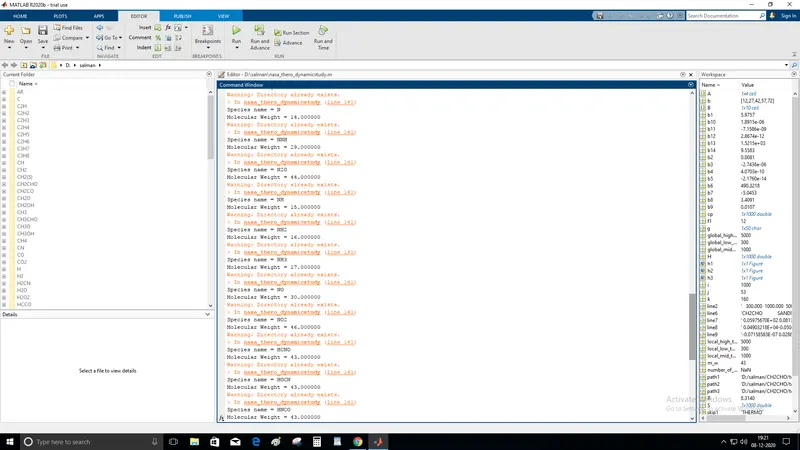
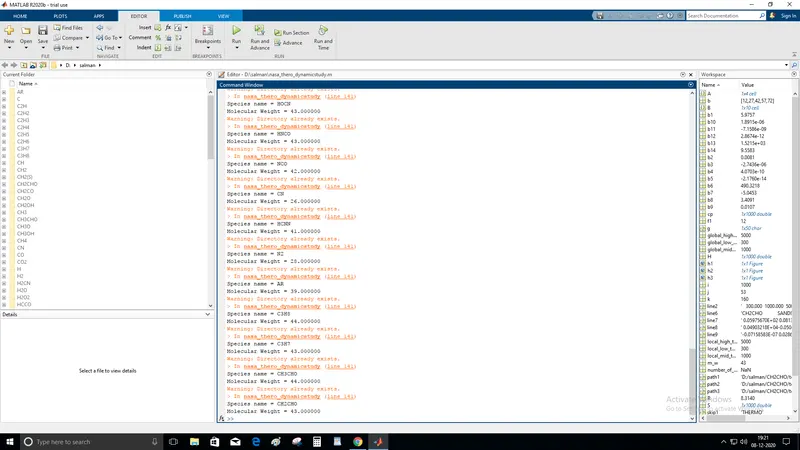
this are the screenshots of the folders which we are created through the program, every species has a specific folder and each folder contains the graph of enthalpy , entropy, specfic heat vs teperature.

this is the graph of the o2 species three graphs are temperature versus enthalpy, entropy, specific heat.
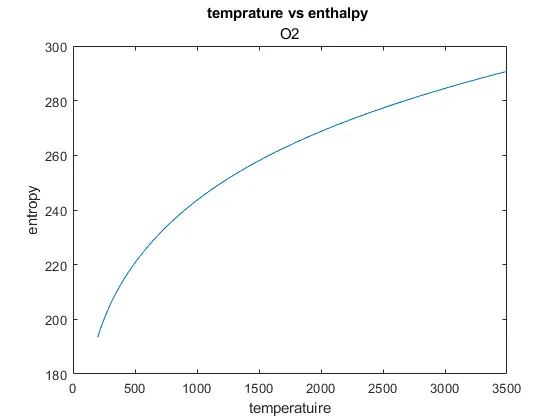
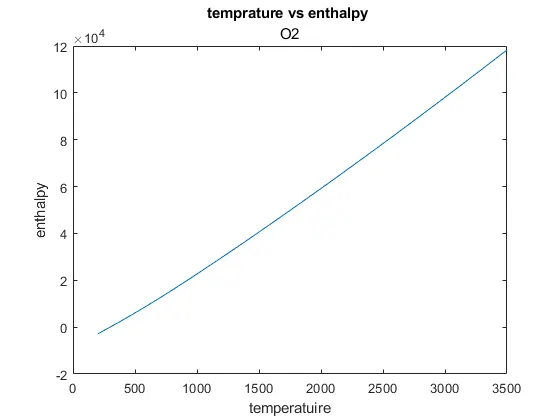
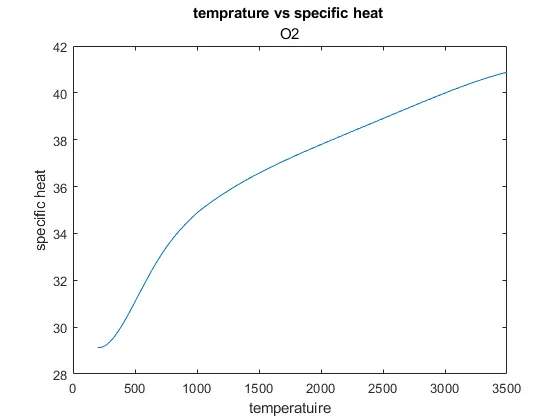
this is the graph of the co2 species three graphs are temperature versus enthalpy, entropy, specific heat.
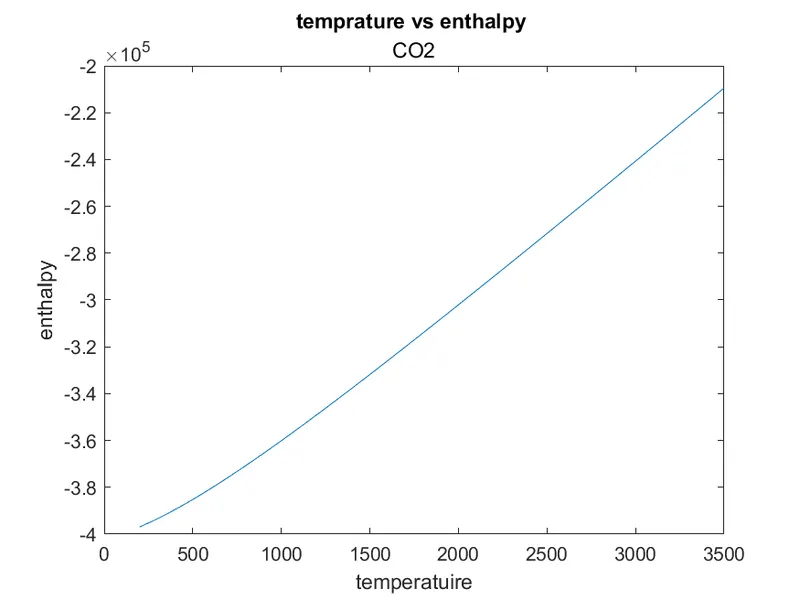
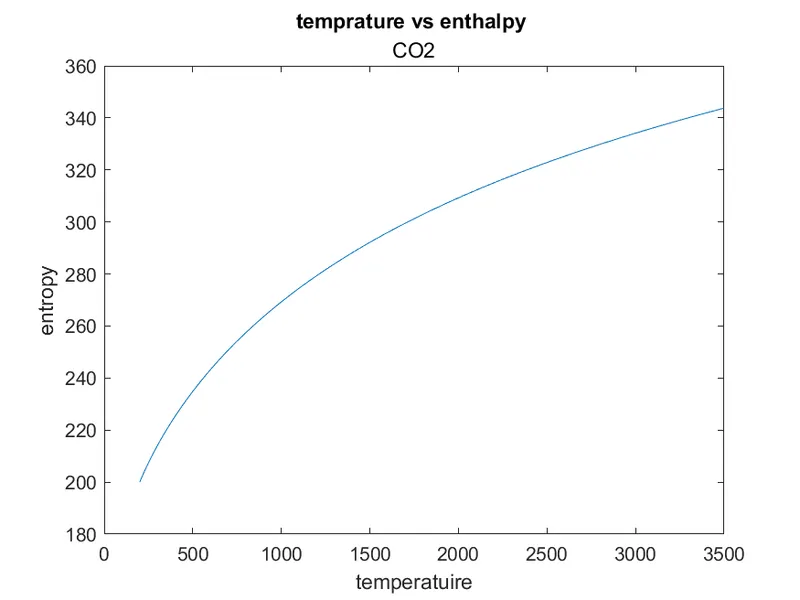
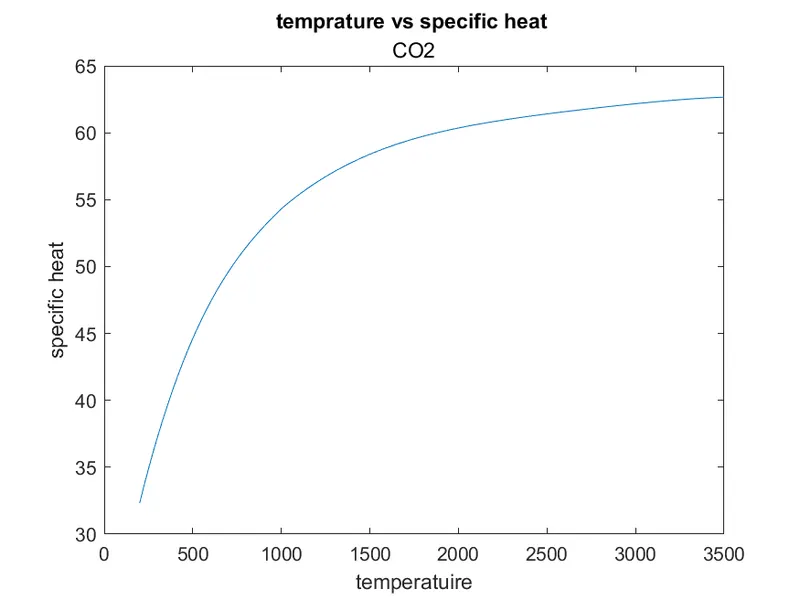
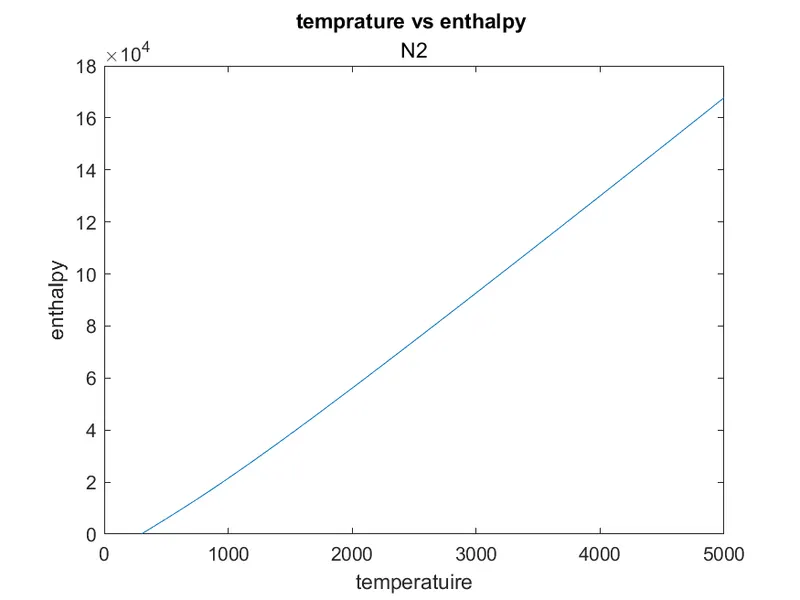
this is the graph of the N2 species three graphs are temperature versus enthalpy, entropy, specific heat.
CONCLUSION:
after attempting this session we are able to read the data from the file. in future, if we go through any of these situations we are able to do so. and we get the logic of how to read or rite inside any file whuich is given