Parsing NASA thermodynamic data using MATLAB
Objective
Write a MATLAB code that does the following operations:-
- Extracts the 14 coefficients and calculates the enthalpy, entropy and specific heats for all the species in the NASA Thermodynamic data.
- Calculates the molecular weight of each species.
- Plots the Cp, Enthalpy and Entropy for the local temperature range specified for each species in the NASA Thermodynamic data
- Your CODE should save the plots as images with appropriate names and dump them in separate folders for each species with a suitable name automatically. Share all the plots in a google drive link.
- Study the plot of O2, N2 & CO2 species.
Introduction
NASA came up with polynomials that can be used to evaluate thermodynamic properties such as Specific Heat(Cp), Enthalpy(H) and Entropy(S). They have documented the coefficients in a THERMO.dat file that are required to evaluate these polynomials for 53 species.
THERMO.dat is attached in a google drive link mentioned in the Results section of the project.
THERMO.dat contains 53 species. 14 coefficients are associated with each species that can be used to evaluate thermodynamic properties such as Cp, H and S. For each species a local temperature range (maximum, mid and minimum temperature) is given in the file for which coefficients are valid.
The FIRST 7 coefficients are known HIGH-temperature coefficients which are valid for a range from local maximum to mid-temperature and the SECOND 7 coefficients are known as LOW-temperature coefficients which are valid for a range from local mid to low-temperature.
These coefficients can be put into a polynomial equation to evaluate thermodynamic properties at different temperature values.
These are the polynomial equations that can be used to evaluate Specific Heat(Cp), Enthalpy(H) and Entropy(S).
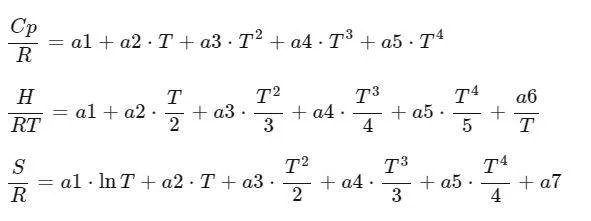
Cp - Specific Heat Capacity, H - Enthalpy, S - Entropy
T - Temperature, R - Universal Gas Constant, a1 a2 a3 a4.... - coefficients
Solution
To read the data from the THERMO.dat file, We will be using the File Parsing technique.
File Parsing refers to reading or interpret the data from a file and building a representation of the logical content of that data, that can be used to perform some kind of operations or calculation on that data.
How information can be read from a particular external file and then using that information in a computer program to do some calculation.
Main Code Logic
- The Main code read the THERMO.dat file.
- All the information is read line by line using fgetl command and useful information such as species name, temperature, coefficients is stored in a variable tline.
- Unnecessary information such as comments is read using the same fgetl command but not stored in any variable so they are skipped.
- Since fgetl command reads the data from file in a string format, So strsplit command is used to split up the line that converts the string into a cell array.
- Now on that cell array indexing is used to store the species name, temperatures and coefficients in separate variables.
- str2num command is used to convert coefficients format from string to number.
- The main code read the global temperature range.
- There are 53 species in the THERMO.dat, So a For Loop is used to repeat the process 53 times which reads the necessary information of the species.
- By using a FOR Loop, Code read the species name, their local temperature range and their all 14 coefficients line by line from the data file.
- In that same For loop, it calls the separate function for specific heat, Enthalpy, Entropy and Molecular Weight calculation.
- It writes the molecular weight for all species in a text file 'molecular_weight.txt' that is attached with the project.
- Then the code creates a folder with the species name in the current working directory using mkdir command.
- Finally, the code creates 3 plots that are temperature vs specific heat, temperature vs enthalpy and temperature vs entropy for all species and saves them in their respective created folder using saveas command.
Here is the main code:
clear all
close all
clc

R = 8.3145;   %universal gas constant (J/mol*K)

thermo_data = fopen('THERMO.dat','r');               %reading the file
fgetl(thermo_data);                                  %skipping the comment line

global_temp_str   = fgetl(thermo_data);              %reading global temperature line
global_temp_array = strsplit(global_temp_str,' ');   %converting from string to cell array

%converting global temp from string to number and string it to variable

g_mintemp = str2num(global_temp_array{2});
g_midtemp = str2num(global_temp_array{3});
g_maxtemp = str2num(global_temp_array{4});

for i = 1:3
    fgetl(thermo_data);                    %skipping the comment lines
end

%creating a text file in which molecular weight is written for each species

mol_weight = fopen('molecular_weight.txt','wt');

for i = 1:53
    tline   = fgetl(thermo_data);            %reading specie name line
    A       = strsplit(tline,' ');           %converting it from string to cell array
    specie  = A{1}  ;                        %storing specie name into a variable


    %storing local temperature of specie into a separate variable

    lowtemp  = str2num(A{end-3});
    midtemp = str2num(A{end-1});
    hightemp = str2num(A{end-2});

    temp_range = linspace(lowtemp,hightemp,500);

    tline1 = fgetl(thermo_data);            %reading coefficient line
    find_expo = findstr(tline1,'E');        %locating position of exponentials in coefficient string

    %storing 14 coefficients into a separate variable

    a1 = str2num(tline1(1:find_expo(1)+3));
    a2 = str2num(tline1(find_expo(1)+4:find_expo(2)+3));
    a3 = str2num(tline1(find_expo(2)+4:find_expo(3)+3));
    a4 = str2num(tline1(find_expo(3)+4:find_expo(4)+3));
    a5 = str2num(tline1(find_expo(4)+4:find_expo(5)+3));

    tline2 = fgetl(thermo_data);
    a6  = str2num(tline2(1:find_expo(1)+3));
    a7  = str2num(tline2(find_expo(1)+4:find_expo(2)+3));
    a8  = str2num(tline2(find_expo(2)+4:find_expo(3)+3));
    a9  = str2num(tline2(find_expo(3)+4:find_expo(4)+3));
    a10 = str2num(tline2(find_expo(4)+4:find_expo(5)+3));

    tline3 = fgetl(thermo_data);
    a11 = str2num(tline3(1:find_expo(1)+3));
    a12 = str2num(tline3(find_expo(1)+4:find_expo(2)+3));
    a13 = str2num(tline3(find_expo(2)+4:find_expo(3)+3));
    a14 = str2num(tline3(find_expo(3)+4:find_expo(4)+3));

    %calling functions to calculate specific heat, enthalpy, entropy and molecular weight

    Cp = specific_heat(a1,a2,a3,a4,a5,a8,a9,a10,a11,a12,temp_range,midtemp,R);

    H  = enthalpy(a1,a2,a3,a4,a5,a6,a8,a9,a10,a11,a12,a13,temp_range,midtemp,R);

    S  = entropy(a1,a2,a3,a4,a5,a7,a8,a9,a10,a11,a12,a14,temp_range,midtemp,R);

    w  = molecular_weight(specie);

    %writing molecular weight of each species in molecular_weight.txt file

    fprintf(mol_weight,'Molecular Weight of %s is : %.2f n',specie,w);

    cur_directory = pwd;
    mkdir(specie);                       %making folders for species
    cd(specie);                          %changing directory to specie folder

    %Plotting graphs

    %plotting specific heat vs temperature

    figure(1);                                         %opening a figure
    plot(temp_range,Cp,'linewidth',2,'color','b');     %plotting a graph
    xlabel('Temperature [K]');
    ylabel('Specific Heat Capacity [J/K-kg]');
    title(sprintf('Specific Heat vs Temperature for %s',specie));
    grid on
    saveas(1,'Specific Heat.jpg');                      %saving graph in specie folder

    %plotting enthalpy vs temperature

    figure(2);                                                %opening a figure
    plot(temp_range,H,'linewidth',2,'color','b');             %plotting a graph
    xlabel('Temperature [K]');
    ylabel('Enthalpy [J/mol]');
    title(sprintf('Enthalpy vs Temperature for %s',specie));
    grid on
    saveas(2,'Enthalpy.jpg');                           %saving graph in specie folder

    %plotting entropy vs temperature

    figure(3);                                                    %opening a figure
    plot(temp_range,S,'linewidth',2,'color','b');                 %plotting a graph
    xlabel('Temperature [K]');
    xlabel('Temperature [K]');
    ylabel('Entropy [J/K-mol]');
    title(sprintf('Entropy vs Temperature for %s',specie));
    grid on
    saveas(3,'Entropy.jpg');                                %saving graph in specie folder

    cd(cur_directory);                    %changing the directory back to the folder where main codes are available

end
fclose(mol_weight);                          %closing molecular weight text file
Code logic explanation Calculating Specific Heat
- The function takes the input of the necessary coefficients based on the polynomial equation, local temperature range and Universal gas constant.
- A For Loop is used to march over the local temperature array for specific species.
- If condition is used to make sure high or low-temperature coefficient are used correctly in the polynomial equation based on the local temperature value.
- Finally, Code gives a Specific Heat capacity array that has a specific heat capacity value for different temperatures calculated based on the polynomial equation.
Here is the code:
function [cp] = specific_heat(a1,a2,a3,a4,a5,a8,a9,a10,a11,a12,temp_range,midtemp,R)

%using the polynomial equation, calculating specific heat capacity
%if the temperature is less than local mid-temperature then coefficients from a8 to a14 are used
%if the temperature is more than local mid-temperature then coefficients from a1 to a7 are used

    for i = 1:length(temp_range)                      %marching over the local temperature array
        if temp_range(i) <= midtemp
           cp(i) = R.*(a8 + a9.*temp_range(i) + a10.*temp_range(i).^2  + a11.*temp_range(i).^3 + a12.*temp_range(i).^4);
        else
            cp(i) = R.*(a1 + a2.*temp_range(i) + a3.*temp_range(i).^2  + a4.*temp_range(i).^3 + a5.*temp_range(i).^4);
        end
    end
end
Code logic explanation Calculating Enthalpy
- The function takes the input of the necessary coefficients based on the polynomial equation, local temperature range and Universal gas constant.
- A For Loop is used to march over the local temperature array for specific species.
- If condition is used to make sure high or low-temperature coefficient are used correctly in the polynomial equation based on the local temperature value.
- Finally, Code gives an enthalpy array that has enthalpy value for different temperatures calculated based on the polynomial equation.
Here is the code:
function [h] = enthalpy(a1,a2,a3,a4,a5,a6,a8,a9,a10,a11,a12,a13,temp_range,midtemp,R)

%using the polynomial equation, calculating enthalpy
%if the temperature is less than local mid-temperature then coefficients from a8 to a14 are used
%if the temperature is more than local mid-temperature then coefficients from a1 to a7 are used

    for i = 1:length(temp_range)                    %marching over the local temperature array
        if temp_range(i) <= midtemp
           h(i) = (temp_range(i)*R.*(a8 + ((a9.*temp_range(i))./2) + ((a10.*temp_range(i).^2)./3)  + ((a11.*temp_range(i).^3)./4) + ((a12.*temp_range(i).^4)./5) + (a13./temp_range(i))));
        else
            h(i) = (temp_range(i)*R.*(a1 + ((a2.*temp_range(i))./2) + ((a3.*temp_range(i).^2)./3)  + ((a4.*temp_range(i).^3)./4) + ((a5.*temp_range(i).^4)./5) + (a6./temp_range(i))));
        end
    end
end
Code logic explanation for Calculating Entropy
- The function takes the input of the necessary coefficients based on the polynomial equation, local temperature range and Universal gas constant.
- A For Loop is used to march over the local temperature array for specific species.
- If condition is used to make sure high or low-temperature coefficient are used correctly in the polynomial equation based on the local temperature value.
- Finally, Code gives an entropy array that has entropy value for different temperatures calculated based on the polynomial equation.
Here is the code:
function [s] = entropy(a1,a2,a3,a4,a5,a7,a8,a9,a10,a11,a12,a14,temp_range,midtemp,R)

%using the polynomial equation, calculating entropy capacity
%if the temperature is less than local mid-temperature then coefficients from a8 to a14 are used
%if the temperature is more than local mid-temperature then coefficients from a1 to a7 are used

    for i = 1:length(temp_range)                %marching over the local temperature array
        if temp_range(i) <= midtemp
           s(i) = R.*((a8*log(temp_range(i))) + a9.*temp_range(i) + ((a10.*temp_range(i).^2)./2)  + ((a11.*temp_range(i).^3)./3) + ((a12.*temp_range(i).^4)./4) + a14);
        else
            s(i) = R.*((a1*log(temp_range(i))) + a2.*temp_range(i) + ((a3.*temp_range(i).^2)./2)  + ((a4.*temp_range(i).^3)./3) + ((a5.*temp_range(i).^4)./4) + a7);
        end
    end
end
Code logic explanation for Calculating Molecular Weight
- The function takes the input of the species name.
- There are 6 elements Hydrogen, Carbon, Nitrogen, Oxygen, Sulfer and Argon that are appearing in the species of the THERMO.dat file.
- All 6 element name and their atomic mass are stored in a separate array.
- The initial molecular weight of species is set to 0.
- For loop is used to loop through the species name index.
- A nested For loop is used to loop through the element name array.
- If condition and strcmp are used to compare between species name variable and element name array. This helps in locating the element that is appearing in current species of the THERMO.dat file.
- The atomic mass of the appearing element is added in molecular weight which was 0 initially.
- In the first For loop that is looping over species of the THERMO.dat file, str2num command is used to check if any numeric value is available at the current index and stored in a variable 'a'. This will let us know how many times the element is repeating in the current species of the THERMO.dat file.
- If 'a' is more than 1 meaning element in the current species is repeating more than once.
- Then the atomic weight of that repeating element multiplied by (a - 1) is added to the molecular weight of the species. Why (a-1)? because we have already added the atomic mass of that repeating element in our nested For loop once.
- Finally, the code prints the Molecular Weight of the species.
Here is the code:
function [w] = molecular_weight(specie)                   %reading specie variable from main code

    species_name = ['H' 'C' 'N' 'O' 'S' 'Ar'];            %storing element name in an array

    atomic_mass  = [1.00797 12.011 14.0067 15.9994 32.06 39.948];     %storing atomic mass of elements

    w = 0;                           %innitial molecular weight of specie is set to zero

    for i = 1:length(specie)
        for j = 1:length(species_name)
            if strcmp(specie(i),species_name(j)) %checking if element is available in speice_name array
                w = w + atomic_mass(j);          %adding atomic_mass of element if element is found in specie_name array
                pos = j;
            end
        end

        %checking if an element in specie is getting repeated

        a = str2num(specie(i));

        if a>1
            w = w + atomic_mass(pos)*(a-1);       %adding atomic mass of element if specie is getting repeated
        end
    end

    fprintf('Molecular Weight of %s is : %.2f n',specie,w)        %prinitng molecular weight of specie
end
Results
Here is the link where graphs for temperature vs specific heat, temperature vs enthalpy, temperature vs entropy are saved for all the species and molecular_weight.txt text file for all species are available.
https://drive.google.com/drive/folders/11BFwAaDiJwbAztwlGGSVD9YJ99qyuIYb?usp=sharing
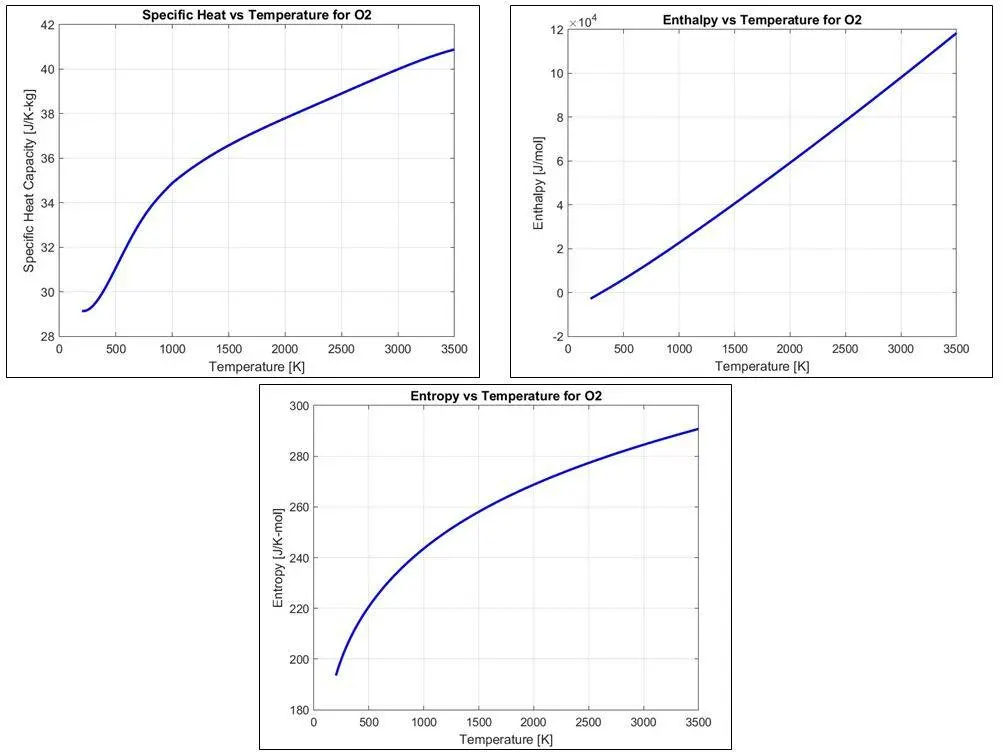
Plots for O2
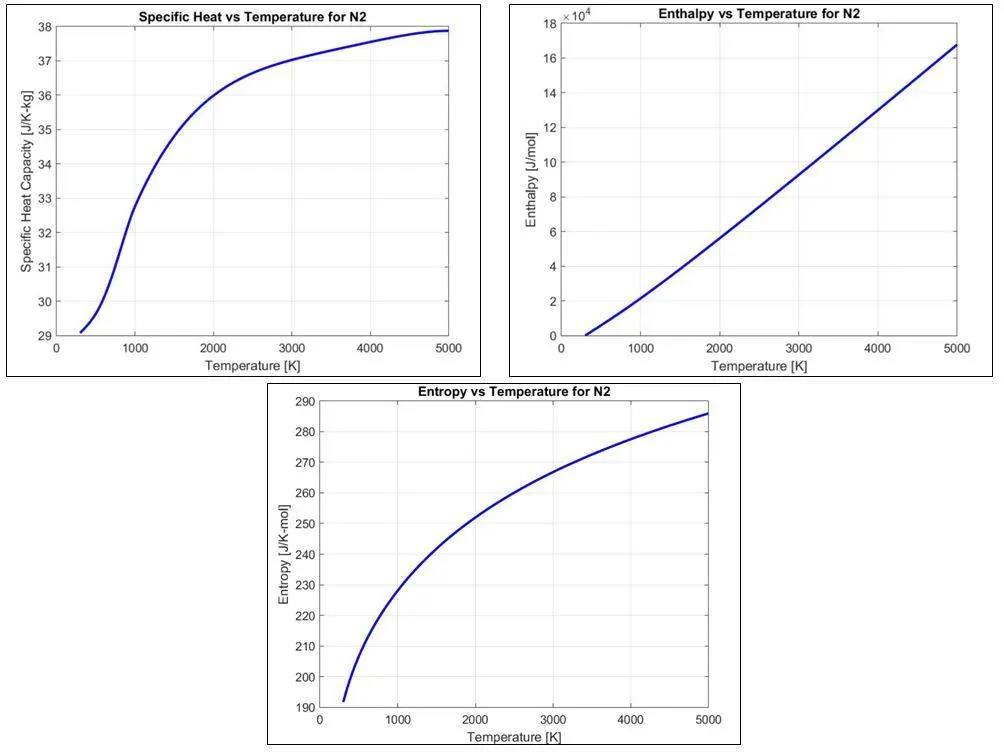
Plots for N2
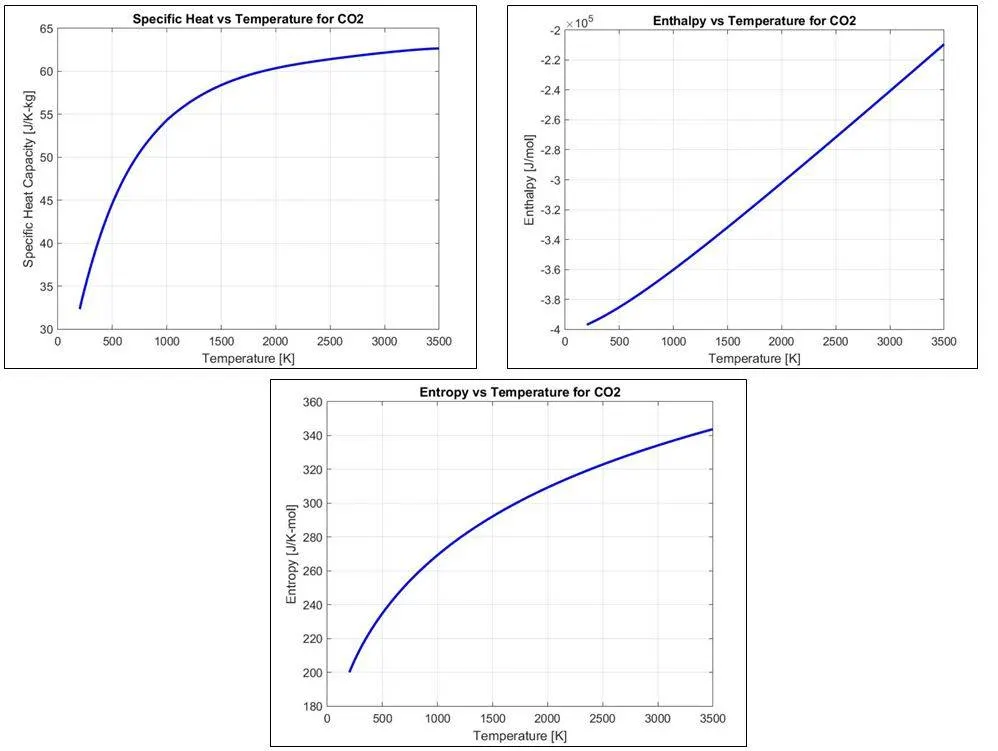
Plots for CO2
Conclusion
Specific Heat, Enthalpy and Entropy with temperature plots for O2, N2 & CO2 species are generated.
- Specific Heat, Enthalpy and Entropy increases with an increase in temperature as seen in the graph.
- Specific heat of CO2 is maximum and minimum for N2 meaning Carbon dioxide can hold more heat as compared to N2 & O2.
- With temperature increase, the rotation and vibrational energy of molecules increase which is known as internal energy and as the temperature increases more rotational and vibrational energy levels become excited so species can store more heat that will lead to a rapid increase in Heat capacity. But with further increase in temperature the slope of specific heat vs temperature will reduce and after a certain point, it will become flat(not shown in graph) meaning specific heat has become constant. This is due to the fact that many energy levels are already excited and so the rate of increase of internal energy has become constant thus the specific heat capacity has attained the constant value.
- Enthalpy shows an almost linear variation with an increase in temperature.
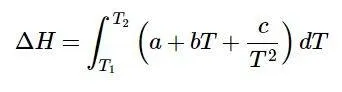
- By krichoff's Law, We know the relationship between enthalpy and temperature variation. We can see the below formula given by Kirchoff Law, with temperature increase, Enthalpy of substance increases, which means both the products and the reactants enthalpies increase.
- Entropy also increases with an increase in temperature. As we put more energy into the system. Randomness in the system will increase and gases will expand so the Entropy will increase.