Project 1 - Parsing NASA thermodynamic data
STUDY ON NASA THERMODYNAMIC DATA
FILE PARSING
AIM:
To perform parsing of NASA Thermodynamic data using Matlab software.
OBJECTIVES:
⦁ To study and extract the 14 coefficients to calculate the Cp, H and S values of 53 different element species using Matlab interface. Also find the molecular weight of different species.
⦁ To plot the Cp, H and S values fow all the species against the local temperature range for those species.
⦁ To save the plots as images with appropriate names and store them in unique folders with species names, but every operation must be done automatically using Matlab.
⦁ To create a user input dialogue box to address those species in their folders and display appropriate images as specified by the user.
FORMULAE USED:
⦁ Specific Heat Capacity at constant pressure (Cp), Enthalpy (H) and Entropy (S);

where, R is the universal gas constant
T is the local temperature specific for the species
a1,a2,a3,a4,a5,a6 and a7 are the coefficients provided by NASA Thermodynamic data.
PROCEDURE:
⦁ All the programming work for this study experiment is done using Matlab software. File Parsing is the process of extracting useful information from a file containing a lot of data and using this information obtained in some other work process.
clear all;
close all;
clc;
% Program for Parsing NASA Thermodynamic data
% First opening the 'THERMO.dat' file
datafile = fopen('THERMO.dat','r');

% Function call for data extraction with 3 outputs
[a, lcl_temp, t] = data_extract(datafile);
savetxt = char(t);% 't' is a cell array whaich is converted into char array
for i=1:53
    y = string(t);% string of 't' is different from convertCharsToStrings(savetxt)
    for j=1:6     % and both 'x' and 'y' has its own uses inside function.
        x(i,j) = convertCharsToStrings(savetxt(i,j));
    end
end
% Function call for molecular weight which is stored in a cell array 'p'
p = molweight(x,y);
disp(p);% 'disp' command to display molecular weight in command window
% Function call for Cp, H and S values whcih is not important since we have
% already plotted inside the function itself. But we take outputs because
% to check the correctness of plot based on the last values of Cp,H and S.
[Cp_high, Cp_low, H_high, H_low, S_high, S_low] = calculation(a, lcl_temp, savetxt);

% This below display command is used because, there will be a clash if the
% user input plot is overwriting the existing output 53 species plots. So,
% it is first suggested to close all the plots generated by the function
% program and type in 'user_input' to access the user input dlgbox.
disp('Please "EXIT" the input dlgbox and close all the plot figures. Now type "user_input" in the command window to get the user input dlgbox.');
user_input;% Function call for getting user's input dlgbox.
⦁ In this above main program, 'fopen' command is used to open the file 'THERMO.dat' and is accessable under read only mode which contains the NASA Thermodynamic data. After opening the file in matlab main program, a function call is used to extract all the coefficients 'a', local temperature ranges 'lcl_temp' and a cell array 't'. This cell array contains all the symbol of species. This cell array is converted into character array 'savetxt' and string array 'x' for easy calculation based on species symbols.
⦁ The molecular weight calculation and Cp, H and S calculations are done on separate function programs and called into this main program.
% Function for user input dialogue box
function user_input
j = 1;
i = 1;
while j == 1
    prompt = {'Enter species of your choice(type in upper case only) or type "EXIT" to close'};
    dlgtitle = 'Plot with Cp, H and S';
    input = inputdlg(prompt,dlgtitle,[1 40]);
    B = char(input);% convert cell input into 'B' which is char array
    k = 6-length(B);
    b = blanks(k);% blanks are added since the images in our program has blanks
    A = sprintf('%c%c',B,b);% 'A' is 'B' with required amount of blanks
    C = upper(A);% to check case sensitivity, we change whole A to upper
    w = strcmp(A,'EXIT  ');% strcmp cpmpares 2 strings and returns logical
    if j == w              % '1' or '0' if true or false.
        break;
    end
    z = isfolder(A);% checks whether there is a folder of 'A'
    if j == z
        cmp = strcmp(C,A);% since strcmp is case sensitive, 'C' which is upper
        if cmp == 1       % of 'A' is compared with 'A' itself. So, if it has
            cd(A);        % any lower case elements, it shows the msg below.
            figure(i);% To capture all the figures that theuser wants,figure(i)
            hold on;  % and hold on are used.
            img = sprintf('Species %s.png',A);
            I = imread(img);% reads the image 'img'
            imshow(I);% shows the image as figure(i)
            cd('F:\Matlab workspace');
            i = i+1;% i is incremented for the next input plot
        else  % this msg is shown when there is lower case in user input
            disp('Element not found. Please try out a different element.');
        end
    else  % this msg is shown when there is no such element as typed by user
        disp('Element not found. Please try out a different element.');
    end

end
⦁ After calculation and plots are produced and saved on specified folders which is generated automatically in one of the function, the user input dialogue box is coded. 'prompt', 'dlgtitle' and '[1 40]' for the 'inputdlg' command represents the text to display, dialogue box title and the dimension of user input dlgbox respectively. Using character of input 'B' to check the folder name, in which case, 'upper' command is used to compare the string for upper case letters with the string given by the user using 'strcmp' command for case sensitivity. All these are given inside a 'while' loop for getting various input plots until the user enters "EXIT" in the dlgbox or closes the dlgbox. If the user inputs a name which is not present in any of the folder, an error message of 'Element not found. Please try out a different element' is displayed on the command window. If the foldar search is successful using 'isfolder' command, then the image stored inside the folder is read and shown using 'imread' and 'imshow' commands. 'cd' command is used to change the directory from current folder to the user specific folder for showing the image file.
% Function program for Data file extraction into matlab
function [a, lcl_temp, t] = data_extract(datafile)
for i=1:5
    fgetl(datafile);% This command is used to get the line of the file.
end                 % If it is used again it gets the next line and so on.


m = 1;% 'm' 'p' 'P' are counters used inside for loops
P = 1;
p = 1;
L = fgetl(datafile);
for k = 1:108
        if L(end)=='1'
            t(p) = {L(1:6)};
            p = p+1;
            line_num1 = findstr(L,'G ');
            % findstr is used to find a string 'G ' inside the line L.
            for i = 1:3
                lcl_temp(P,i) = str2double(L(line_num1+2:line_num1+10));
                % To get the temp values of string, str2double is used.
                line_num1 = line_num1+10;
                if i == 3
                    P = P+1;
                end
            end
            L = fgetl(datafile);% to get the next line

        elseif L(end)=='2' % if the end of line L is '2', then it executes
            n = 1;
            for j = 1:3
                line_num2 = findstr(L,'E');% since 'E' is common in all
                for i = 1:length(line_num2)% 3 lines, we specify location of E
                    a(m,n) = str2double(L(line_num2(i)-11:line_num2(i)+3));
                    n = n+1;% values before 'E' and after 'E' are stored as
                end         % coefficients 'a'.
                L = fgetl(datafile);
                if j == 3
                    m = m+1; % 'm' and 'n' are used to store 'a' in a 53x14 mat
                end
            end
        end

end
⦁ Firstly, 'data_extract' function is used to extract the data line by line and obtain only the useful information in every line which is known as parsing. The 'fgetl' command is used to get the line in the file in a successive manner whenever it is used. So if I want to read the second line but the read cursor is on the first line, I simply use this fgetl command to get the second line and so on. Also, the advantage of fgetl command is that, by using this I will be able to read each and every line of the file.
⦁ The NASA Thermodynamic data has a unique number at the end of ever line for a set of values. This can be used to loacte the useful data from a cluster of data set. '1' at the very end of any line represents that the species name or symbol is at the start of this line and also the local temperature range values is at the end , i.e., after the letter 'G' of this line. '2', '3' or '4' at the very end of any line represents that the 14 coefficients are arranged systematically on these line with the information that the first seven coefficients represents the 'High temperature range' and the second seven coefficients represents the 'Low temperature range' which are local to that particular species. Note that the first 5 lines of the data file is useless and can be skipped by the fgetl command 5 times. So all the lines must be read and all the info in each and every line is to be taken. We know that there are 53 species and each species has 4 lines of data with them, so, the program must run fgetl command for 212 times to read the entire data set. But here we used 'k' loop counter as 108 because, the loop 'k' contains another for loop 'j' which runs for 3 times and has fgetl command on it to get and evaluate the next 3 lines of code. This means that if the k loop runs for 1 time , it executs the 4 lines in the data, so, I figuered out that the loop must run for only 53*2=106+2 times (+2 is for the end and start statements).
% Function program to calculate Molecular Weight
function [p] = molweight(x,r)
% Atomic masses are taken as inputs to calculate molecular weight
C = 12;
H = 1;
O = 16;
N = 14;
S = 32;

for i = 1:53% to calculate molecular weight for all the species
    mo = 0;% initialising 'mo' to 0 for each and every loop count
    for j = 1:6 % 1:6 beacuse i know that it is a 6 char array
        y(j) = x(i,j);% taking 1st element and storing in y(i)
        if y(j)=='O'% checks if y(i) is equal to string 'O'
            mo = mo + O;% if so, mo value is incremented with value of O
            q(i,j) = mo;% I used this variable to check whether i get the
                        % correct output for 'mo' after every iteration
        elseif y(j)=='H'% same as above
            mo = mo + H;
            q(i,j) = mo;

        elseif y(j)=='C'
            mo = mo + C;
            q(i,j) = mo;

        elseif y(j)=='S'
            mo = mo + S;
            q(i,j) = mo;

        elseif y(j)=='N'
            mo = mo + N;
            q(i,j) = mo;

        elseif y(j)=='('||')'||' '
            mo = mo + 0;
            q(i,j) = mo;

        elseif y(i)=='A'||'R'
            mo = 40;
            q(i,j) = mo;
        end     % ending this elseif since it is already long.

        if y(j)=='2'% checks y(i) is equal to string '2'
            k = j-1;% to go to the previous char element
            y = x(i,k);% storing previous char element to y inorder to check
            if y=='O'  % check which element must be multiplied with 2.
                mo = mo - O;% this is done because previous element is already
                o = O*2;    % calibrated in the previous iteration, so, if we
                mo = mo + o;% add another 2*O, it becomes 3 times the value of
                q(i,j) = mo;% O. To avoid this, I used mo = mo - O.
            elseif y=='H'
                mo = mo - H;
                h = H*2;
                mo = mo + h;
                q(i,j) = mo;
            elseif y=='C'
                mo = mo - C;
                c = C*2;
                mo = mo + c;
                q(i,j) = mo;
            elseif y=='N'
                mo = mo - N;
                n = N*2;
                mo = mo + n;
                q(i,j) = mo;
            end

        elseif y(j)=='3'% same as before
            k = j-1;
            y = x(i,k);
            if y=='O'
                mo = mo - O;
                o = O*3;
                mo = mo + o;
                q(i,j) = mo;
            elseif y=='H'
                mo = mo - H;
                h = H*3;
                mo = mo + h;
                q(i,j) = mo;
            elseif y=='C'
                mo = mo - C;
                c = C*3;
                mo = mo + c;
                q(i,j) = mo;
            elseif y=='N'
                mo = mo - N;
                n = N*3;
                mo = mo + n;
                q(i,j) = mo;
            end

        elseif y(j)=='4'||'5'||'6'||'7'||'8'
            if y(j)=='4'
                mo = mo - H;% since in all the species, more than '3', is
                h = H*4;    % present for only 'H' in our data file. So,for
                mo = mo + h;% 4,5,6,7 and 8 we use value of H only.
                q(i,j) = mo;
            elseif y(j)=='5'
                mo = mo - H;
                h = H*5;
                mo = mo + h;
                q(i,j) = mo;
            elseif y(j)=='6'
                mo = mo - H;
                h = H*6;
                mo = mo + h;
                q(i,j) = mo;
            elseif y(j)=='7'
                mo = mo - H;
                h = H*7;
                mo = mo + h;
                q(i,j) = mo;
            elseif y(j)=='8'
                mo = mo - H;
                h = H*8;
                mo = mo + h;
                q(i,j) = mo;
            end
        end
    end
    p{i,1} = sprintf('Molecular weight of %s = %i g/mol',r(i),mo);
    if i == 49 % this is done since AR is only used ones in the file.
        p{49,1} = sprintf('Molecular weight of AR     = 40 g/mol');
    end
end
⦁ Secondly, the molecular weight of each species is calculated in the function called 'molweight' which takes 'x' and 'y' string arrays as inputs and returns 'p' which is a cell array containing the molecular weight of every species as output. In this program, standard atomic mass values of elements C, H, O, N and S are given as inputs. Also, I know that the number of species is 53 and the length of string for each element is 6 that we got from the extraction function is used as conditions to run for loops. For each and every element, 'mo' is initialized to 0 and it's value is incremented if the element used is compared with the string I produced, since I know that the string values contain only certain number of strings. So it is easy to compare the whole length of string with this for loop and 'mo' is incremented accordingly. Once all the inputs are evaluated, 'sprintf' command is used to print the values to 'p' cell array and 'disp' command is used to display the contents of 'p' in the command window. In case of 'Species 49', i.e., AR, which is having an atomic mass of ~40 amu is directly printed as output in the cell array because it is used only ones throughout the whole Thermodynamic data file.
% Function program to calculate Cp,H and S
function [Cp_high, Cp_low, H_high, H_low, S_high, S_low] = calculation(a, lcl_temp, savetxt)
for i=1:53
    R = 8.3145;% universal gas constant in J/mol.K
    filename = savetxt(i,:);%filename contains each line of savetxt char array
    high_temp = lcl_temp(i,2);
    low_temp = lcl_temp(i,1);
    mid_temp = lcl_temp(i,3)+100;% since mid is also in the low temp range
    T1 = mid_temp:100:high_temp; % we use mid as mid+100.
    T2 = low_temp:100:mid_temp-100;% to access mid as well in the low range
    for j=1:length(T1)% for all the temps in high range
        Cp_high = (a(i,1)+a(i,2).*T1+a(i,3).*T1.^2+a(i,4).*T1.^3+a(i,5).*T1.^4)*R;
        H_high = (a(i,1)+(a(i,2).*T1)/2+(a(i,3).*T1.^2)/3+(a(i,4).*T1.^3)/4+(a(i,5).*T1.^4)/5+ a(i,6)./T1)*R.*T1;
        S_high = (a(i,1).*log(T1)+a(i,2).*T1+(a(i,3).*T1.^2)/2+(a(i,4).*T1.^3)/3+(a(i,5).*T1.^4)/4+ a(i,7))*R;
    end

    for k=1:length(T2)% for all the temps in low range and mid as well
        Cp_low = (a(i,8)+a(i,9).*T2+a(i,10).*T2.^2+a(i,11).*T2.^3+a(i,12).*T2.^4)*R;
        H_low = (a(i,8)+(a(i,9).*T2)/2+(a(i,10).*T2.^2)/3+(a(i,11).*T2.^3)/4+(a(i,12).*T2.^4)/5+ a(i,13)./T2)*R.*T2;
        S_low = (a(i,8).*log(T2)+a(i,9).*T2+(a(i,10).*T2.^2)/2+(a(i,11).*T2.^3)/3+(a(i,12).*T2.^4)/4+ a(i,14))*R;
    end
    txt = ['Species ',num2str(i)];% To use in title
    figure(i);% to plot every figure, figure(i) is used inside 'i' for loop
    hold on;
    subplot(3,1,1);% splitting main plot into 3 subplots
    plot([Cp_low Cp_high],[T2 T1],'Displayname','Specific heat Cp','linewidth',3,'color','r');
    xlabel('Cp[J/mol.K]');% 1st plot is for Cp
    ylabel('T[K]');
    title(txt);
    legend('location','northwest');
    subplot(3,1,2);
    plot([H_low H_high],[T2 T1],'Displayname','Enthalpy H','linewidth',3,'color','b');
    xlabel('H[J/mol]');% 2nd plot is for H
    ylabel('T[K]');
    legend('location','northwest');
    subplot(3,1,3);
    plot([S_low S_high],[T2 T1],'Displayname','Entropy S','linewidth',3,'color','g');
    xlabel('S[J/mol.K]');% 3rd plot is for S. All subplots are inside one figure
    ylabel('T[K]');
    legend('location','northwest');
    hold off;
    % To create a folder and to save the figure as image in it.
    mkdir(filename);% makes a folder with 'filename' char array
    cd(filename);% changing directory location to this folder made
    f = sprintf('Species %s.png',filename);% sprintf to print text
    saveas(gcf,f);% 'saveas' gets the current figure and saves with name'f'

    cd('F:\Matlab workspace');% returning back to original direction inorder
                              % for the function to execute.

end
⦁ Finally, the main calculation and plotting of Cp, H and S with respect to local temperature ranges and formulae are carried out on a separate function program called 'calculation'. In this function program, 'a', 'lcl_temp' and 'savetxt' are taken as imputs and Cp_high, Cp_low, H_high, H_low, S_high and S_low are given as outputs. Also, the plot for Cp, H and S against local temperature range at standard deviation of 100 K for each and every species is plotted in such a way that after calculation of values of Cp, H and S for a particular species, the plot is done with a title of the species number in the order represented in the 'THERMO.dat' file and a folder is created using 'mkdir' command to make a directory in the current folder with this particular species name to this directory. In order to access this directory or folder from our current folder, 'cd' (change directory) command is used with specifying the path to this directory. Once this is done, the image file for the current plot figure is created using 'saveas' command inside which 'gcf' (get current figure) command along with the species name is provided. After that, the directory must return to it's original or current directory folder inorder for the program to continue, so, 'cd' command is again used to change the directiory to this function containing folder. This above process is done for all the 53 species inside a 'for' loop to get the plots and the folder and image creation for all the species to be done in this function program.
RESULTS:
Thus the program for study of NASA Thermodynamic data file parsing is coded successfully using Matlab software.
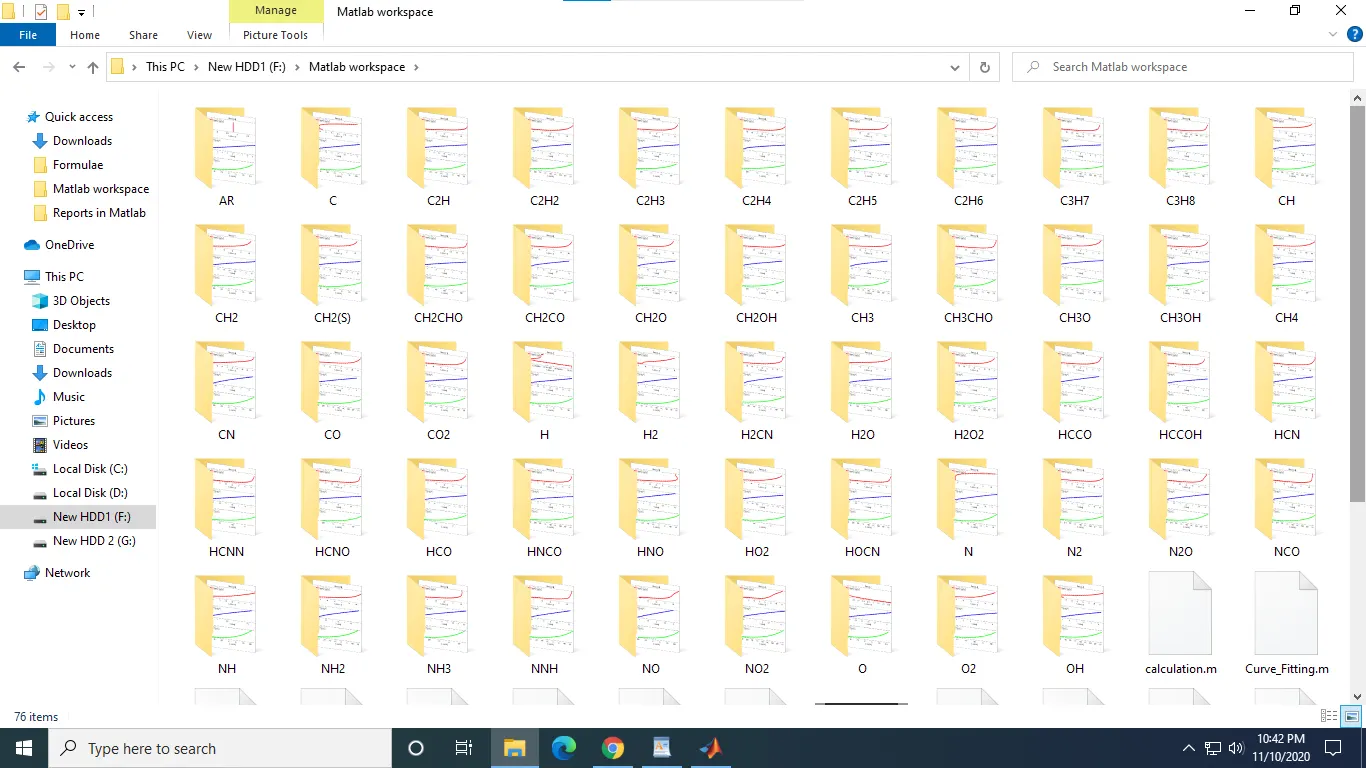
Also, the automatic generation of image file inside species specified folder for all the 53 species are done and an input dialogue box to return the user specified input species (if present), which is also case sensitive, is done successfully in this program.
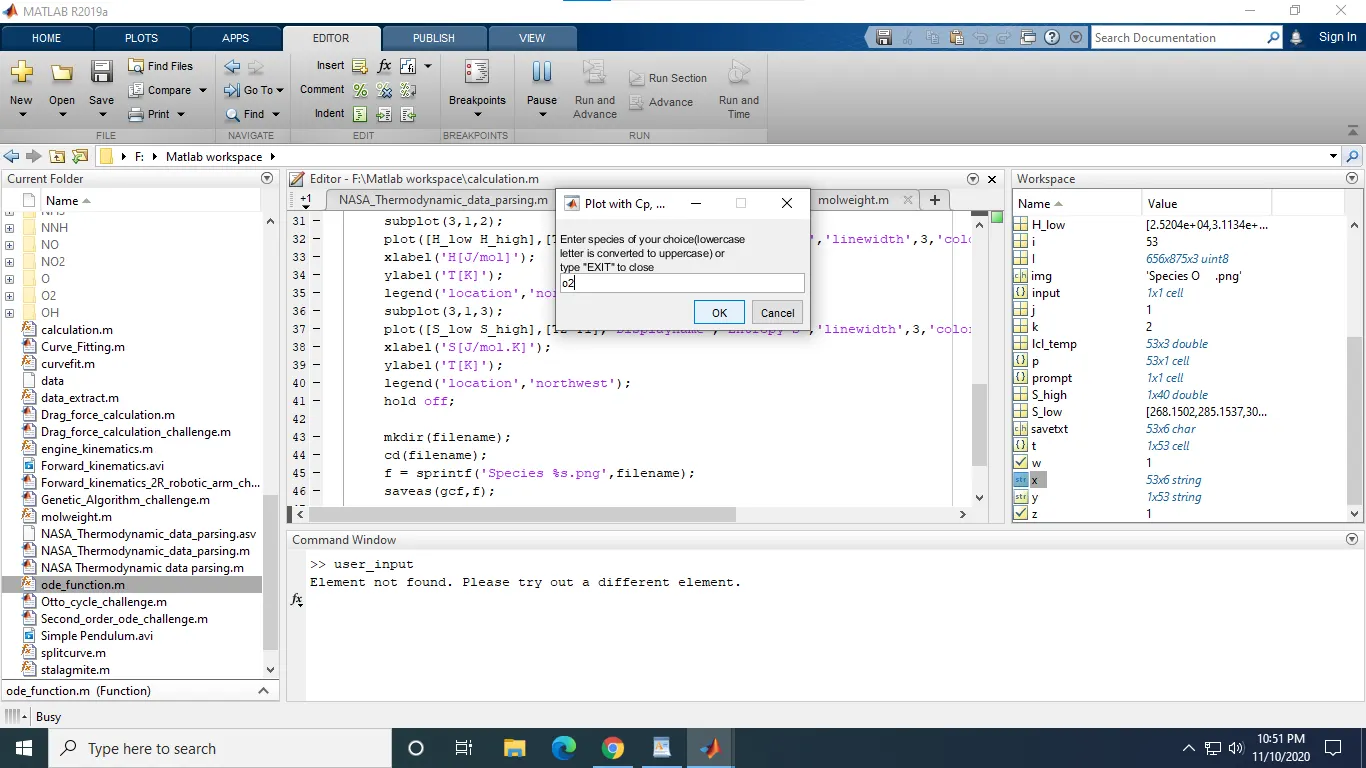
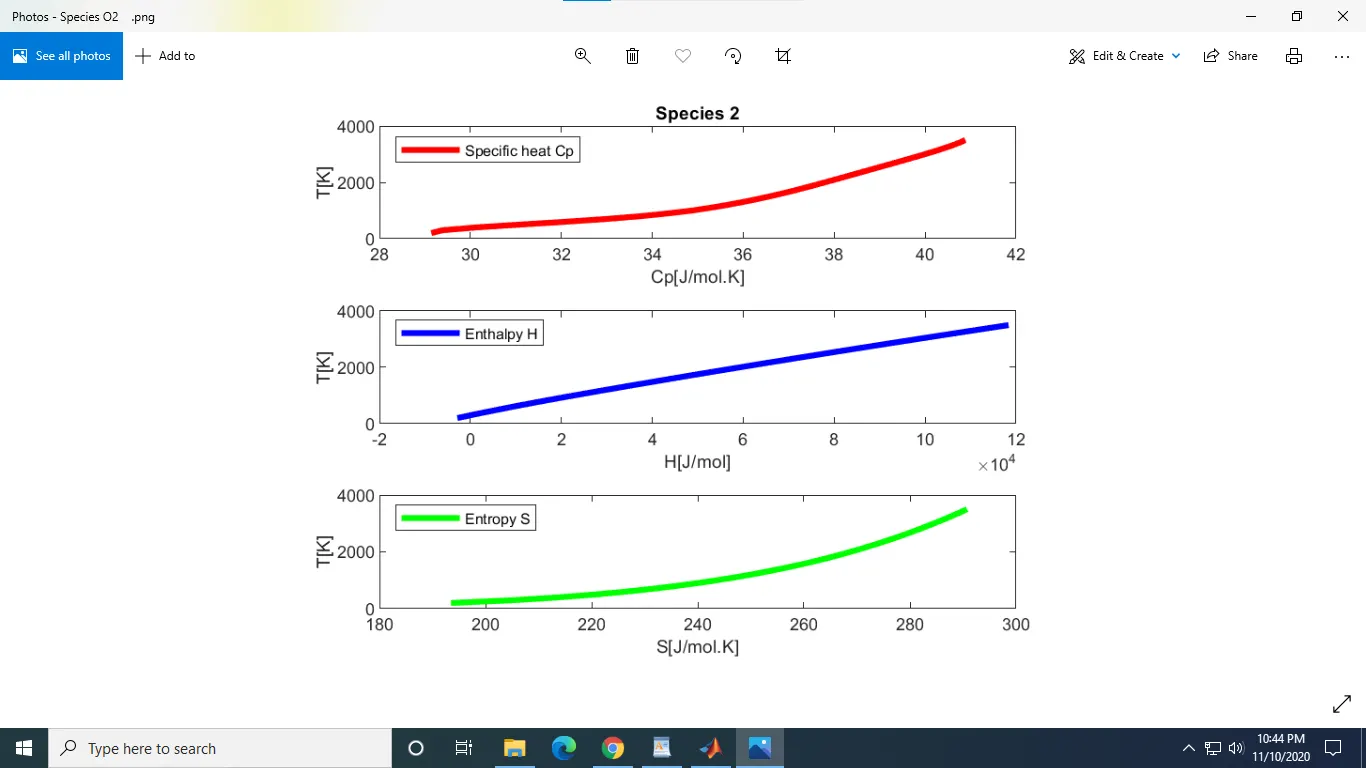
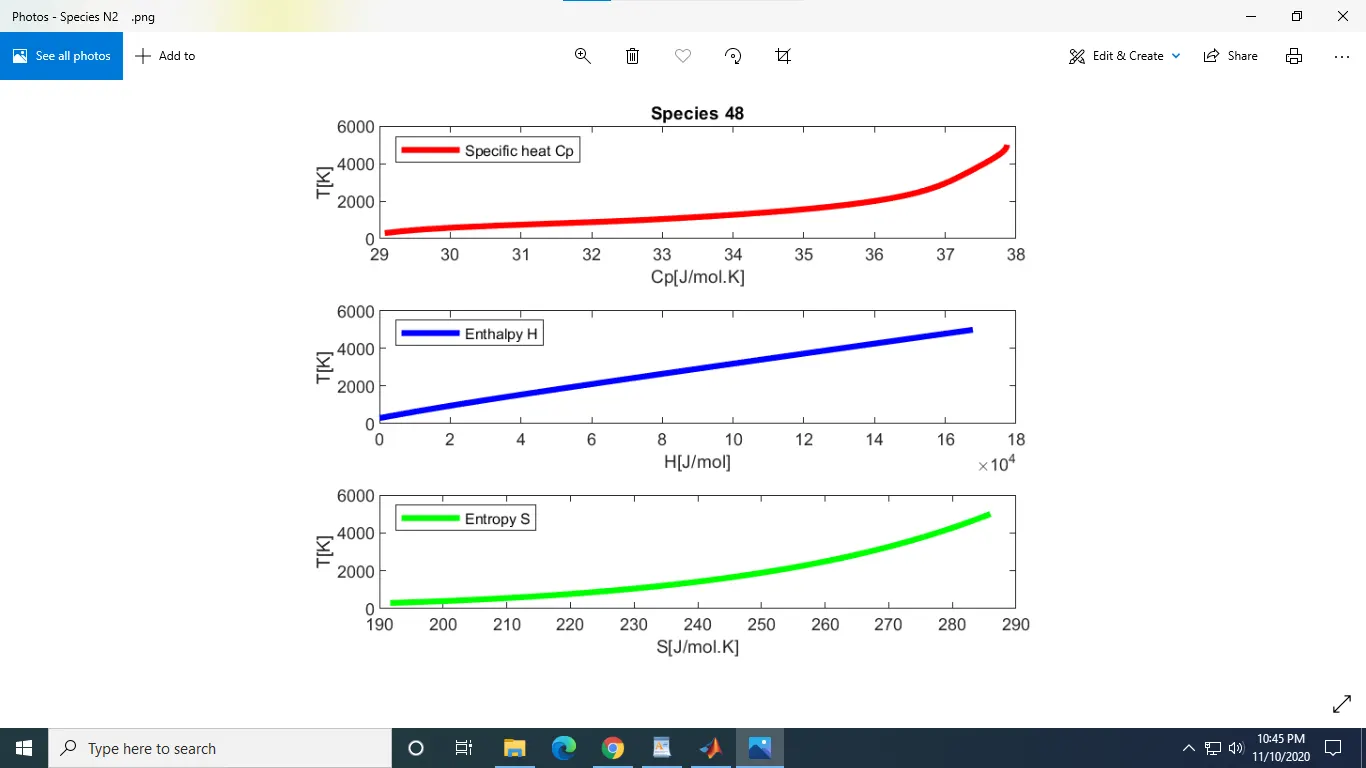
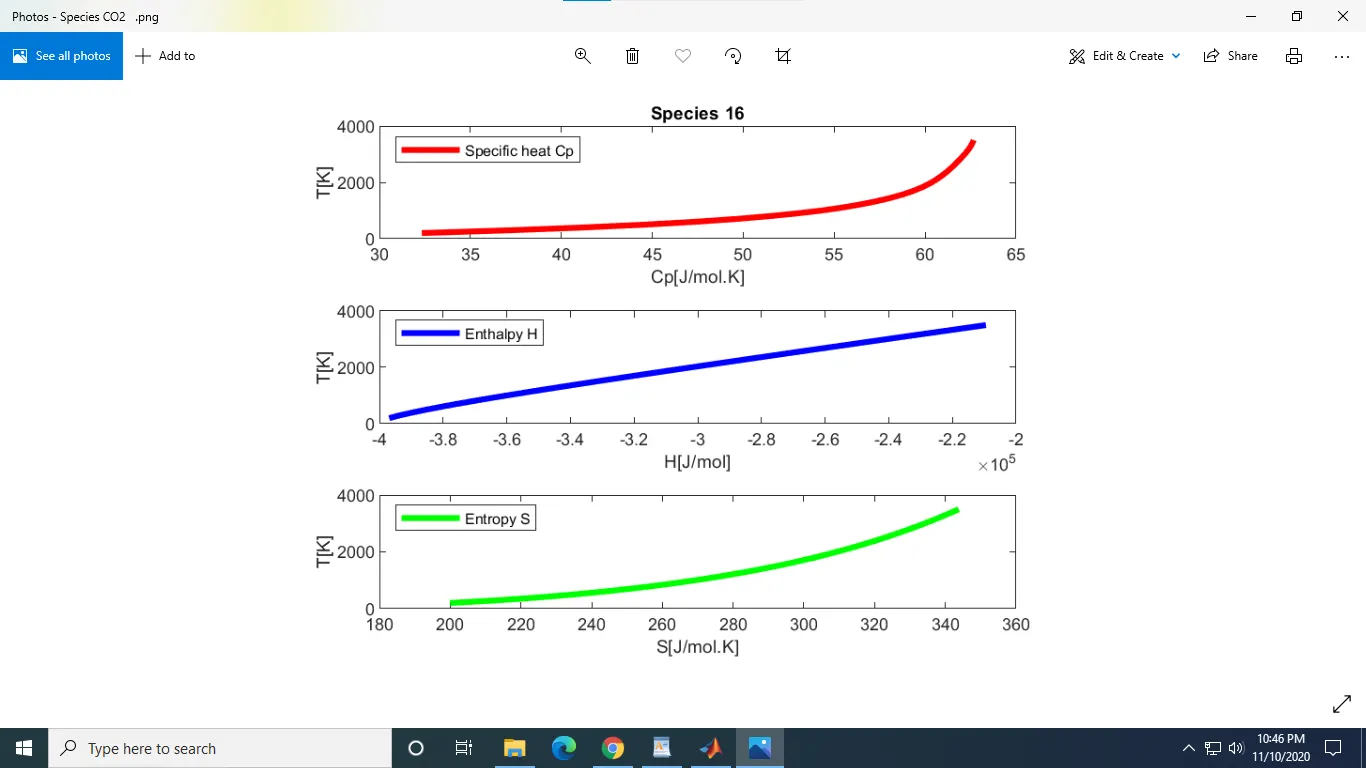
Plots of screen shots of O2, N2 and CO2 have been submitted, but it is asked for the submission of 'o2' plot and since our program inputs are case sensitive, an output message showing 'Element not found. Please try out a different element' is displayed on the command window with a fresh input dlgbox waiting for an input on the screen.
REFERENCES:
⦁ http://combustion.berkeley.edu/gri-mech/data/nasa_plnm.html
⦁ http://combustion.berkeley.edu/gri-mech/data/thermo_table.html
⦁ https://in.mathworks.com/help/matlab/ref/inputdlg.html#d122e663519
⦁ https://in.mathworks.com/help/matlab/ref/sprintf.html
⦁ https://in.mathworks.com/matlabcentral/answers/215976-how-to-create-a-newfolder-and-save-images-in-it