Project 1 - Parsing NASA thermodynamic data
AIM:
FILE PARSING OF NASA THERMODYNAMICS DATA FILE
OBJECTIVES:
- EXPLAIN FILE PARSING
- WRITE A PROGRAM TO EXTRACT THE 14-COEFFICIENTS AND CALCULATE ENTHALPY, ENTROPY, SPECIFIC HEAT.
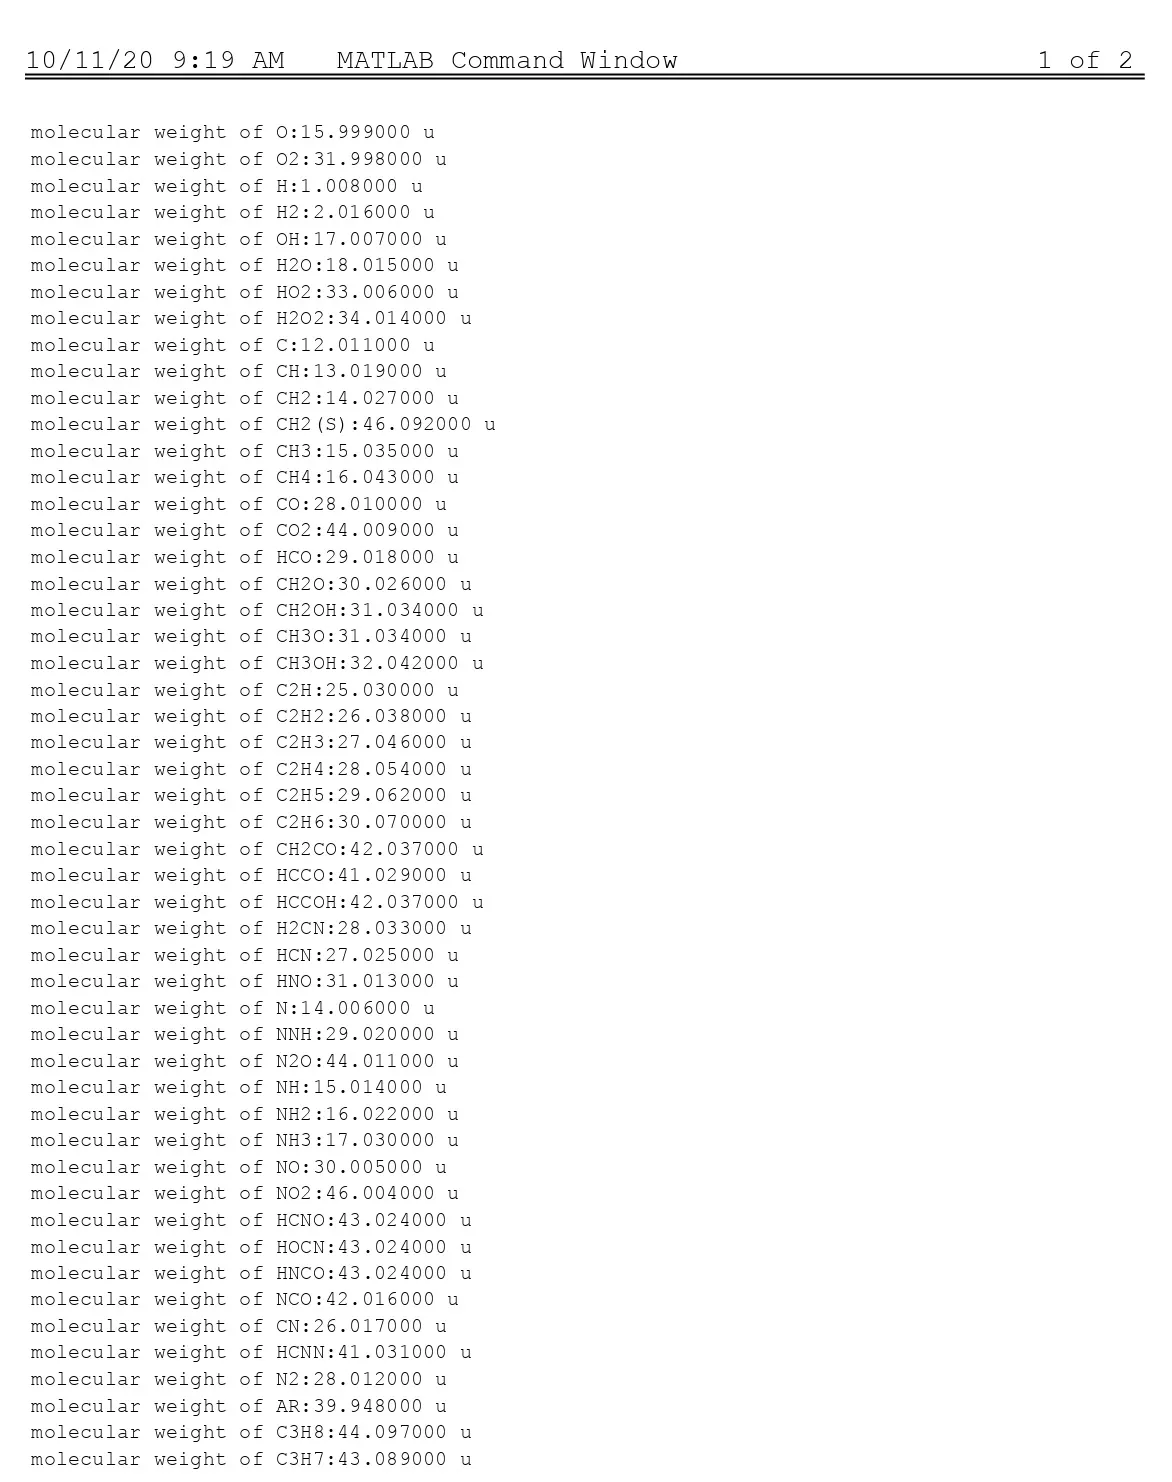
- CALCULATE THE MOLECULAR WEIGHT OF EACH SPECIES.
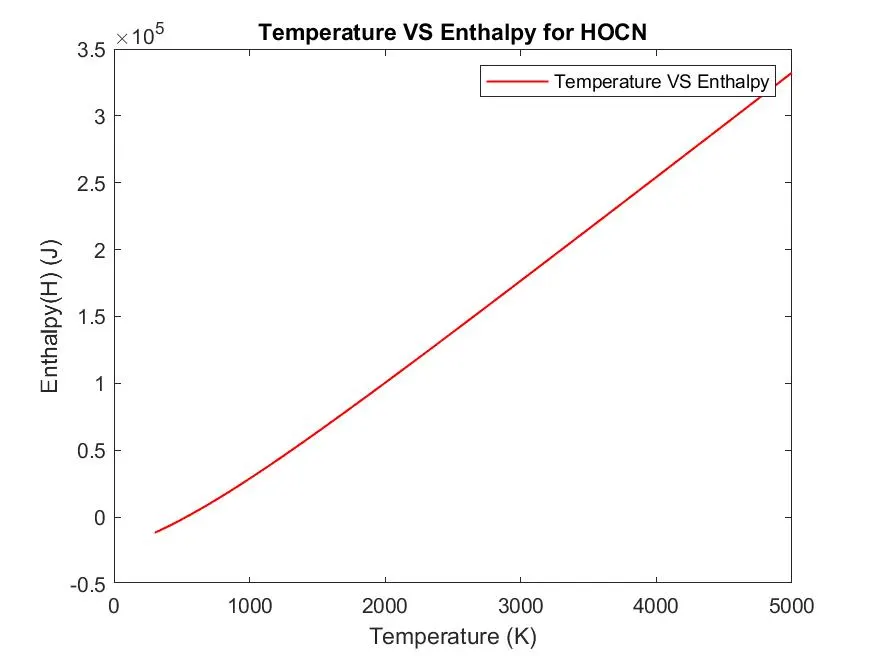
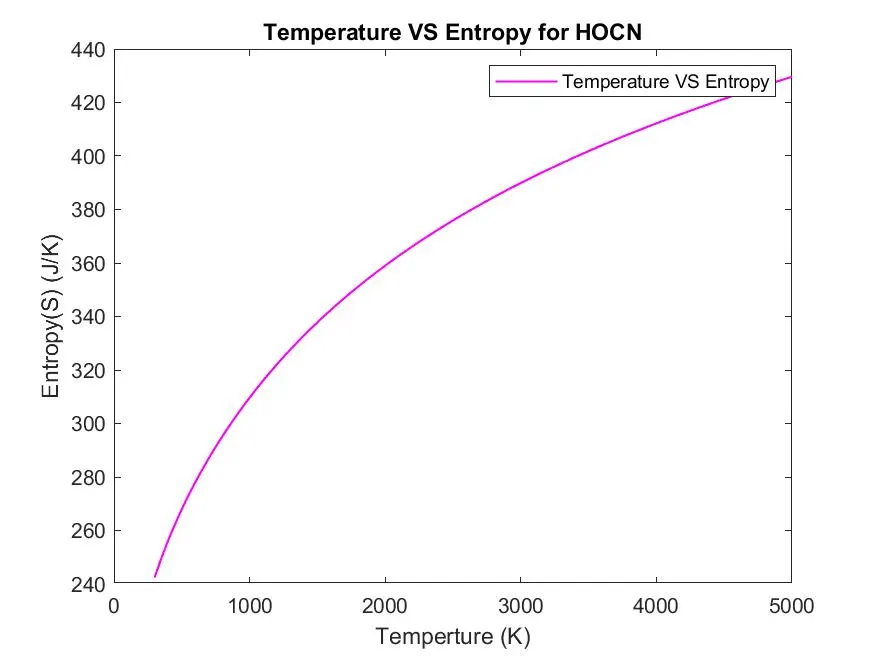
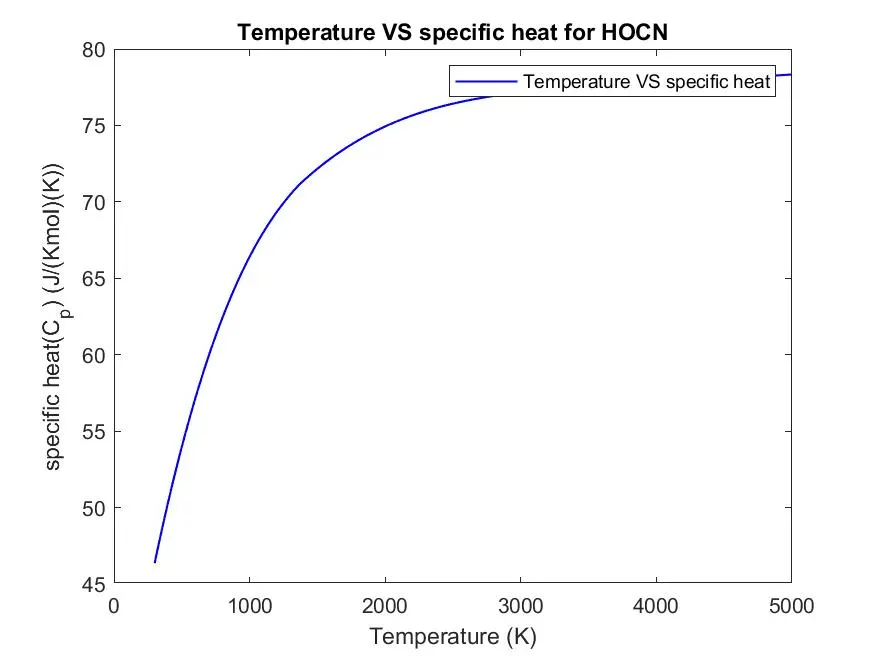
- PLOT THE GRAPHS FOR H, S, CP AND SAVE IT IN THE FOLDERS.
FILE PARSING:
File parsing basically represents or refers to how the information can read from a particular text file or any type of a file and that information can be used in computer programming. By knowing file parsing this helps to read the data from an external file or external database and the data can be calculated. It is usually the interface between the program and a large amount of data either the data is stored ina file or it's coming from a server, it can read a file take that data from it, and able to store user information in the files if the file is very important.
File parsing basically deals with two types, FILE WRITING, and FILE READING.
FILE WRITING:
File writing refers to the process of writing data to a particular file.
The command fopen keyword is basically a command to open a file. syntax of fopen is FileID = fopen('filename','permission') where, filename can be any type of the file. Permission is nothing but Read the data and Write the data. Which represents 'r' and 'w' for permission keyword.
For Example;
F = fopen('THERMO.dat', 'w') where F is filehandle, THERO.dat is the file name, and w is to write the data to the file.
If FileID is basically a filehandle or a pointer to the file, with file id, consider value is F then we can write the data and read the data to the F. when we get F as a positive number the vale of F is doesn't matter at all, but it shouldn't be Negative number.
Now how to WRITE THE DATA?
To write the data, we use the command keyword which is fprintf which stands for "file print the value". The syntax of the fprintf keyword is fprintf('FileId', 'formate specifier','statement or value to write the data').
where Formate specifiers are %s and %f which represents %s is for string and %f is for floating-point values. The string is basically a character that represents the alphabetical words or statements. The Floating-point is basically a numerical value which represents a decimal value or numbers.
For Example;
fprintf('F','%s',HELLO!) or fprintf('F','%f',543) or fprintf('F','%s %f',Time,12.00) Now fprintf is going to write the value in the particular file which is F file id and output display is taken in the text file form or word form which the values are written in text file.
FILE READING:
File reading is a kind of reverse process of file writing. File Reading refers to the process of reading the data to a particular file.
The command fopen keyword is basically a command to open a file. syntax of fopen is FileID = fopen('filename','permission') where, filename can be any type of the file. Permission is nothing but Read the data and Write the data. Which represents 'r' and 'w' for permission keyword.
For Example;
F = fopen('THERMO.dat', 'r') where F is filehandle, THERO.dat is the file name, and r is to read the data to the file.
If FileID is basically a filehandle or a pointer to the file, with file id, consider value is F then we can write the data and read the data to the F. when we get F as a positive number the vale of F is doesn't matter at all, but it shouldn't be Negative number.
Now how to READ THE DATA?
To read the data or contact of the file, we need to make a command that reads the data line by line. To do that manner we use a command called fgetl. basically, the command fgetl is to read the data in a file line by line. the syntax of fgetl is fgetl(File ID), how we use this command in the program when we use the keyword of fgetl(F) for 5 times, it reads the 5 lines of the data line by line.
Then the command fscanf helps to scan the data to know what data is present in the file.
FILE PARSING OF NASA THERMODYNAMICS DATA FILE USING MATLAB:
Now regarding the NASA THERMO.dat file, it contains coefficients for calculating the thermodynamics properties such as SPECIFIC HEAT (CP), ENTHALPY(H), ENTROPY (S). To calculate the values of specific heat, enthalpy, and entropy we use the coefficients of particular species, and based on the coefficient we use the formulas.

where R is UNIVERSAL GAS CONSTANT, SI unit is J/(Kmol.kalvin), the value for R = 8.3145.
The information in the THERMO.dat file is going to read the file and extract the information using the Matlab program. starting we going to open the THERMO.dat file for reading the data and to open the file we use the command "fopen" for opening the THERMO.dat file to scan the information or write the data. to read the information line by line to the file we use the command "fgetl".
from line 1 we get the header information which is the information THERMO and line 2 has the information for global temperature ranges to get each range of temperature from low, mid, and high values.
we going to split the data present inline 2 which gives the global low, mid, and high-temperature position in the data.
% OPENING THE FILE THERMO.dat, TO READ THE DATA AND EXTRACT THE INFORMATION AND CALCULATE THE VALUES OF SPECIFIC HEAT, ENTHALPY, ENTROPY.
f1 = fopen('THERMO.dat','r');
% header information from line 1
tline_1 = fgetl(f1); % HEADER NAME FROM LINE 1
% global temperature ranges from line 2
tline_2 = fgetl(f1); % GLOBAL TEMPERATURE RANGE FROM LINE 2
%spliting the data that present inline 2
A = strsplit(tline_2,' ');
global_low_tempreature = str2double(A{2});  %GLOBAL LOW TEMPERATURE
global_mid_tempreature = str2double(A{3});  %GLOBAL MID TEMPERATURE
global_high_temperature = str2double(A{4}); %GLOBAL HIGH TEMPERATURE
Now, we got the global temperature ranges and the next three lines are comment section information which can be skipped so by applying the "fgetl " command three times we can skip the information which presents in the comment section.
% commant section which has three lines
fgetl(f1); % line 3
fgetl(f1); % line 4
fgetl(f1); % line 5
The main information of the NASA THERMO.dat file is to extract the species name, local temperature ranges, Temperature coefficients. and calculate the values of specific heat, enthalpy, entropy.
% MAIN INFORMATION OF NASA THERMO.dat FILE
    % SPECIES NAME AND LOCAL TEMPERATURE RANGES INLINE 1
    % TEMPERATURE COEFFICIENTS INLINE 2,3,4
    % THE LINE 1,2,3,4 IS A SET OF ONE SPECIES INFORMATION
    % WE NEED TO EXTRACT THE INFORMATION FOR TOTAL 53 SPECIES
There are a total of 53 sets of species information which has the species name, local temperature ranges, Temperature coefficients. in a set of line 1 to line 4
for i = 1:53
In 53 sets of species information, line 1 has species name and local temperature ranges and line 2 to 4 has a temperature coefficient values. Now to extract the information line by line we use the command "fgetl". Now extract the information of line 1 which is species name and local temperature ranges for all 53 header species information. first, we split line 1 information using the command 'strsplit' which splits the string that present inline 1 from that we get by knowing the position of the data or place by giving the command to extract the data ' info = splitdata{position}' by this, we know the position is nothing but the place where the information is located.
For example:
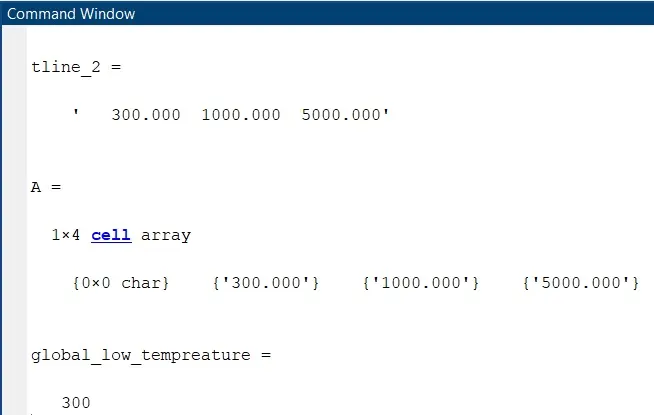
Now from this, we know how the line data which is string can split and how the position of the values we want is located. 300.00 is located at position 2. similarly, 1000 and 5000 positions at 3 and 4. to call this position which is a cell array. The cell array consists of both STRING and VARIABLES. To convert the values which are cell array into a numerical value we use a command called 'str2num or str2double ' which helps to convert the string data into numerical data.
For only cell array, we use the syntax to locate the data and convert it into numerical data which is ' line = str2num(string{postion})', like 'L_l_T = str2double(header_data{end-3})'. now we know the value of local low temperature which is 300.000.
 L1 = fgetl(f1);  % SPECIES NAME AND LOCAL TEMPERATURE RANGES IN LINE 1
% SPECIES NAME AND LOCAL TEMPERATURE RANGES INLINE 1
   header_data = strsplit(L1,' '); %spliting the line 1 to get the information on species name and temperature names.
% SPECIES NAME of all 53 compounds which present in position 1
    species     = header_data{1};  % NAME OF THE SPECIES OR COMPOUND MOLECULE
% LOCAL TEMPERATURE RANGES from all 53 sets of compounds located at end of the line.
    L_l_T  = str2double(header_data{end-3});   % LOCAL LOW TEMPERATURE present at end of the line - 3 position
    L_h_T  = str2double(header_data {end-2});  % LOCAL HIGH TEMPERATURE present at end of the line - 2 position
    L_m_T  = str2double(header_data {end-1});  % LOCAL MID TEMPERATURE present at end of the line - 1 position
EXTRACTING THE COEFFICIENT VALUES OF LOW TEMPERATURE AND HIGH TEMPERATURE:
Temperature coefficients are present inline 2 and 3 and 4 for all the 53 sets of species, the lines are L2 = fgetl(f1), L3 = fgetl(f1), L4 = fgetl(f1), for each line has the temperature coefficients values. to extract the coefficient from L2, L3, L4. we represent the data to split which is a string. a and a_1 and a_2 are to find a string which is 'E' using the command 'a = strfind(L2,'E')', similarly for a_1 and a_2 for L3 and L4. Now converting the string into the numerical value we get like 'a1 = str2double(L2(1:a(1)+3))', from the line 2.

For considering mono oxygen O is present at line 1 and temperature coefficient values at line 2,3,4. line 2 has 5 temperature coefficient and line 3 has 5 temperature coefficient and line 4 has 4 temperature coefficient.
There are a total of 14 temperature coefficients which are 7 high-temperature coefficients and 7 low-temperature coefficients. that is a1 to a7 are high-temperature coefficients and a8 to a14 are low-temperature coefficients.
% TEMPERATURE COEFFICIENTS INLINE 2,3,4 from THERMO.dat file for all 53 sets of species.
% LINE 2,3,4 HAS THE VALUES OF HIGH-TEMPERATURE COEFFICIENT AND LOW-TEMPERATURE COEFFICIENT.
% high-temperature coefficient from a1 to a7 FOR AL THE SPECIES

L2 = fgetl(f1); %TEMERTURE COEFFICIENTS IN LINE 2
a   = strfind(L2,'E'); % EXTRACTING COEFFICIENT FROM LINE 2
a1  = str2double(L2(1:a(1)+3));
a2  = str2double(L2(a(1)+4:a(2)+3));
a3  = str2double(L2(a(2)+4:a(3)+3));
a4  = str2double(L2(a(3)+4:a(4)+3));
a5  = str2double(L2(a(4)+4:a(5)+3));

L3 = fgetl(f1);  %TEMERTURE COEFFICIENTS IN LINE 3
a_1 = strfind(L3,'E'); % EXTRACTING COEFFICIENT FROM LINE 3
a6  = str2double(L3(1:a_1(1)+3));
a7  = str2double(L3(a_1(1)+4:a_1(2)+3));
a8  = str2double(L3(a_1(2)+4:a_1(3)+3));
a9  = str2double(L3(a_1(3)+4:a_1(4)+3));
a10 = str2double(L3(a_1(4)+4:a_1(5)+3));

L4 = fgetl(f1); %TEMERTURE COEFFICIENTS IN LINE 4
a_2 = strfind(L4,'E'); % EXTRACTING COEFFICIENT FROM LINE 4
a11 = str2double(L4(1:a_2(1)+3));
a12 = str2double(L4(a_2(1)+4:a_2(2)+3));
a13 = str2double(L4(a_2(2)+4:a_2(3)+3));
a14 = str2double(L4(a_2(3)+4:a_2(4)+3));
% Low-temperature coefficients from a8 to a14 FOR ALL THE SPECIES
CALCULATING THE VALUES OF SPECIFIC HEAT, ENTHALPY, ENTROPY USING TEMPERATURE COEFFICIENT:
We take the initial 1000 values from local low temperature to local high temperature by using the 'linspace command', we know that a1 to a7 are high-temperature coefficient and a8 to a14 are low-temperature coefficient. By if-condition main temperature which is T is greater than the local mid-temperature it takes a8 to a14 vales of low-temperature coefficient or it takes a1 to a7 values of high-temperature coefficients.
where R is UNIVERSAL GAS CONSTANT, SI unit is J/(Kmol.kalvin), the value for R = 8.3145. from this, we get the values of specific heat, enthalpy, and entropy. T is from low temperature to high temperature.
% TEMPERATURE T VALUE IS TAKEN FOR 1000 RANDOM VALUES FROM LOCAL LOW TEMPERATURE TO LOCAL HIGH TEMPERATURE.
T = linspace(L_l_T,L_h_T,1000);

for j = 1:length(T)
   if (T(j)<=L_m_T)

       % FORMULAE FOR SPECIFIC HEAT (CP) in low-temperature coefficient
       % FORMULAE FOR ENTHALPY (H) in low-temperature coefficient
       % FORMULAE FOR ENTROPY  (S) in low-temperature coefficient

       c_p(j) = (a8+a9*T(j)+a10*(T(j).^2)+a11*(T(j).^3)+a12*(T(j).^4))*(R);
        H(j)   = ((a8) + (a9*(T(j)/2)) + (a10*((T(j).^2)/3)) + (a11*((T(j).^3)/4)) + (a12*((T(j).^4)/5)) + (a13/T(j)))*(R*T(j));
        S(j)   = ((a8*(log(T(j)))) + (a9*T(j)) + (a10*((T(j).^2)/2))+a11*((T(j).^3)/3)+a12*((T(j).^4)/4)+a14)*(R);
   else
       % FORMULAE FOR SPECIFIC HEAT (CP) in high temperature coefficient
       % FORMULAE FOR ENTHALPY (H) in high temperature coefficient
       % FORMULAE FOR ENTROPY  (S) in high temperature coefficient

       c_p(j) = (a1+a2*T(j)+a3*(T(j).^2)+a4*(T(j).^3)+a5*(T(j).^4))*(R);
        H(j)   = (a1+a2*(T(j)/2)+a3*((T(j).^2)./3)+a4*((T(j).^3)./4)+a5*((T(j).^4)/5)+(a6/T(j)))*(R*T(j));
        S(j)   = (a1*log(T(j))+a2*T(j)+a3.*((T(j).^2)/2)+a4.*((T(j).^3)/3)+a5*((T(j).^4)/4)+a7)*(R);
   end
end

% plot for all species data.

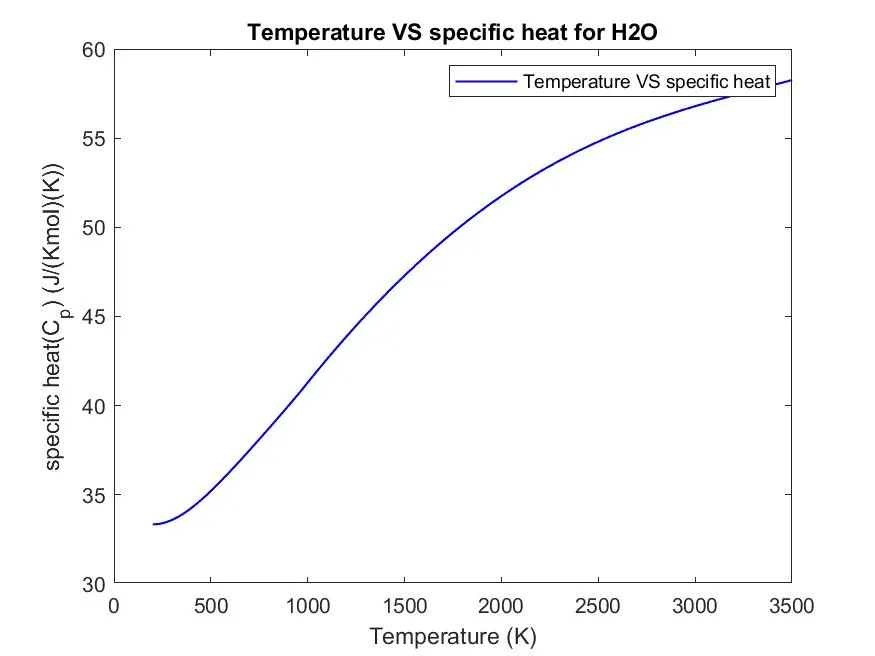
    figure(1) % ALL THE 53 SPECIES Temperature VS specific heat
    plot(T,c_p,'linewidth',1,'color','b')
    xlabel('Temperature (K)')
    ylabel('specific heat(C_p) (J/(Kmol)(K))')
    title(['Temperature VS specific heat for ',species])
    legend('Temperature VS specific heat')

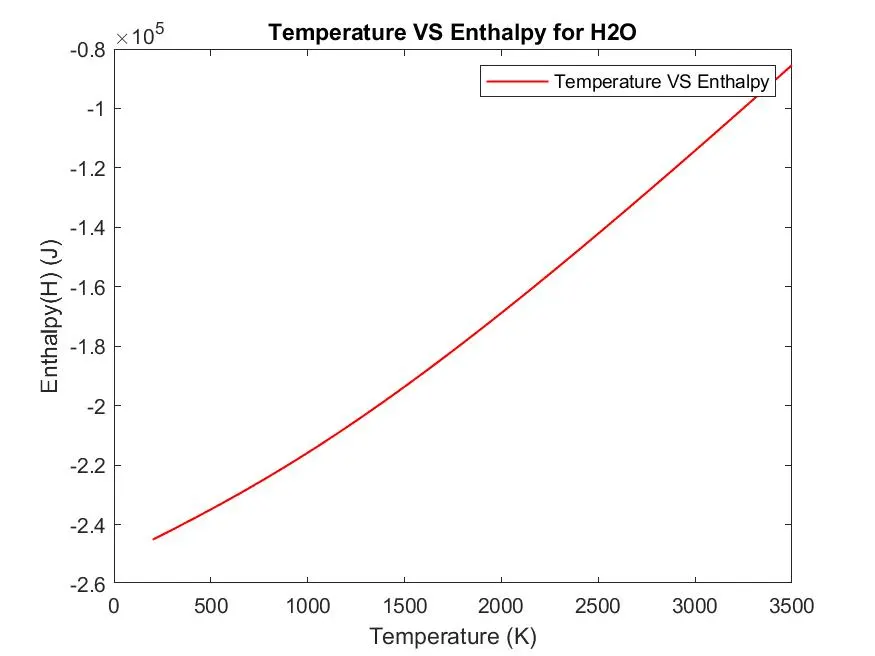
    figure(2) % ALL THE 53 SPECIES Temperature VS Enthalpy
    plot(T,H,'linewidth',1,'color','r')
    xlabel('Temperature (K)')
    ylabel('Enthalpy(H) (J)')
    title(['Temperature VS Enthalpy for ',species])
    legend('Temperature VS Enthalpy')

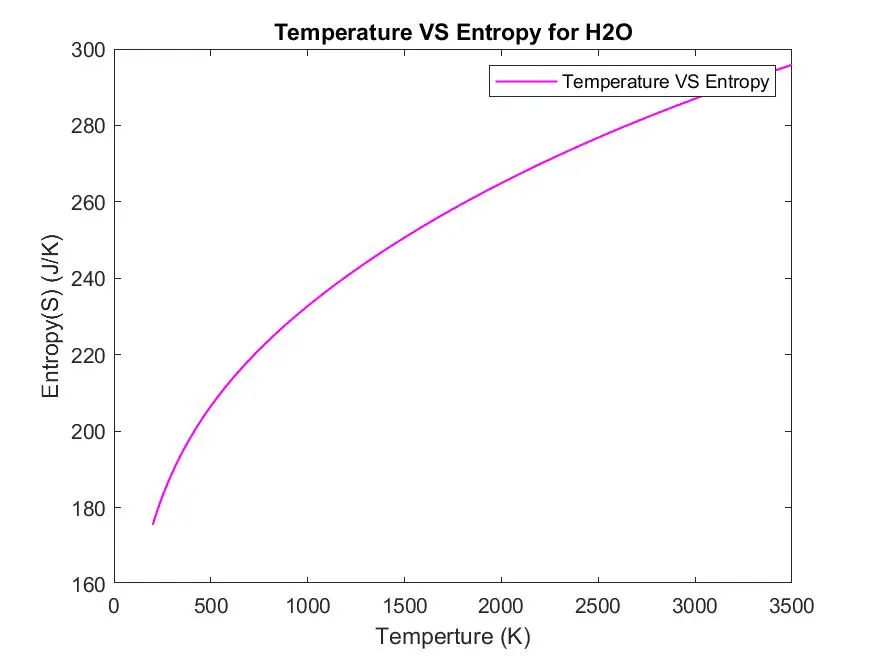
    figure(3) % ALL THE 53 SPECIES Temperature VS Entropy
    plot(T,S,'linewidth',1,'color','m')
    xlabel('Temperture (K)')
    ylabel('Entropy(S) (J/K)')
    title(['Temperature VS Entropy for ',species])
    legend('Temperature VS Entropy')
CREATING THE FOLDER FOR EACH SPECIES AND PASTING THE PLOTS IN SPECIFIED SPECIES FOLDER:
First, we create a folder so we need to make a folder by using the command 'mkdir' which creates folders and subfolders, where it creates the folder and its name to assign. from the plot we for three figures which are Temperature Vs specific heat and Temperature Vs Enthalpy and Temperature Vs Entropy. To past, these figures in specified species folder which are subfolders, we use the command which is 'cd' it helps to change the directory to the previous folders.
In mkdir command it gives the name for all the 53 species folders with its name attached to them and cd is helped to paste the figures in the specified species folders which are subfolders in the main folder
Now to save the figures we use the command 'saveas' which helps to create the figure name for each species and save it as a 'jpg file' in the subfolders.
 % CREATING A FOLDER FOR EACH SPECIES AND PASTING EACH PLOT IN SPECIFIED SPECIES FOLDER,
   mkdir(['F:\NASA THERMODYNAMIC DATA FOR SPECIES\'],species); % CREATING A SPECIES FOLDER
   figure(1)
   figure(2)
   figure(3)
   % CHANGING THE DIRECTORY FOR PASTING THE PLOTS IN SPECIFIED SPECIES FOLDER.
   cd(['F:\NASA THERMODYNAMIC DATA FOR SPECIES\',species]) % CHANGING THE DIRECTORY FOR PASTING THE PLOTS IN SPECIFIED SPECIES FOLDER.
   % SAVING THE FIGURE PLOTS OF ALL THREE. IN CHANGE DIRECTORY.
   saveas(figure(1),['Temperature VS specific heat for ',species],'jpg')
   saveas(figure(2),['Temperature VS Enthalpy for ',species],'jpg')
   saveas(figure(3),['Temperature VS Entropy for ',species],'jpg')
CALCULATING THE MOLECULAR WEIGHT FOR EACH SPECIES USING MATLAB:
To calculate the molecular weight for each species, each species is a compound molecule of carbon C, hydrogen H, nitrogen N, oxygen O, argon A, sulfur S, are atoms. so, the atomic weight of atoms are taken as
C = 12.011, H = 1.008, O = 15.999, N = 14.006, A = 39.948, S = 32.065.
To calculate the molecular weight for example:
The chemical formula for water is H2O, which means this molecule has 3 atoms: 2 of hydrogen (H) and 1 oxygen (O) atom. Using the periodic table of the elements to find atomic weights, we find that hydrogen has an atomic weight of 1, and oxygen is 16. To calculate the molecular weight of one water molecule, we add the contributions from each atom; that is, 2(1) + 1(16) = 18 grams/mole. here 1 is H and 16 is O.
In MatLab, the array of atoms and compounds are string so we compare the values of each by using the command ' strcmp(compound(k), atoms(m))'. if the value of compound and atoms are equal then it gives the value 0 and when the values are not the same it sends the value which we got to the loop.
% FIND THE MOLECULAR WEIGHT OF EACH SPECIES WHICH ARE IN MOLECULAR COMPOUND.

    compound = char(species); % taking each species as molecular compound
    % intial atoms are CARBON, HYDROGEN, OXYGEN, NITROGEN, ARGON, AND SULFUR
    atoms = ['C','H','O','N','A','S'];
    % assing the each atom with specified atomic weight for C, H, O, N, A, S.
    atoms_w = [12.011,1.008,15.999,14.006,39.948,32.065];
    molecular_weight = 0;
for k = 1:length(compound)
   for m =1:length(atoms)
       if strcmp(compound(k),atoms(m)) % compareing the data of two string which are compound and atoms.

          molecular_weight = molecular_weight + atoms_w(m); %assing the each atomic weight to the atoms
          each_atom = m; %taking single atom position which is C H O N A S
       end
   end
     n = str2double(compound(k)); % converting the each compoung string to the numerical values.
   if n>1

     % The chemical formula for water is H2O,
     % which means this molecule has 3 atoms: 2 of hydrogen (H) and 1 oxygen (O) atom.
     % Using the periodic table of the elements to find atomic weights,
     % we find that hydrogen has an atomic weight of 1, and oxygen is 16.
     % In order to calculate the molecular weight of one water molecule,
     % we add the contributions from each atom; that is, 2(1) + 1(16) = 18 grams/mole.

     molecular_weight =  molecular_weight + atoms_w(each_atom)*(n-1);
     % here n is the number of atoms and atows_w(each_atom) is the molecular weoght for each atoms.
   end
end
   % output of molecular weight for all species is display in the command window.
   fprintf('molecular weight of %s:%f u\n',compound,molecular_weight)
MAIN MATLAB PROGRAM FOR NASA THERMO.dat FILE:
% NASA FILE PARSING FOR THERMO.dat FILE
clear all
close all
clc

% input values for R is univarsal gas constant value
R = 8.3145; % units J/(Kmol.kalvin)
% OPENING THE FILE THERMO.dat, TO READ THE DATA AND EXTRACT THE INFORMATION AND CALCULATE THE VALUES OF SPECIFIC HEAT, ENTHALPY, ENTROPY.
f1 = fopen('THERMO.dat','r');
% header information from line 1
tline_1 = fgetl(f1); % HEADER NAME FROM LINE 1
% global temperature ranges from line 2
tline_2 = fgetl(f1); % GLOBAL TEMPERATURE RANGE FROM LINE 2
%spliting the data that present inline 2
A = strsplit(tline_2,' ');
global_low_tempreature = str2double(A{2});  %GLOBAL LOW TEMPERATURE
global_mid_tempreature = str2double(A{3});  %GLOBAL MID TEMPERATURE
global_high_temperature = str2double(A{4}); %GLOBAL HIGH TEMPERATURE

% commant section which has three lines
fgetl(f1); % line 3
fgetl(f1); % line 4
fgetl(f1); % line 5

% MAIN INFORMATION OF NASA THERMO.dat FILE
    % SPECIES NAME AND LOCAL TEMPERATURE RANGES INLINE 1
    % TEMPERATURE COEFFICIENTS INLINE 2,3,4
    % THE LINE 1,2,3,4 IS A SET OF ONE SPECIES INFORMATION
    % WE NEED TO EXTRACT THE INFORMATION FOR TOTAL 53 SPECIES
for i = 1:53
    L1 = fgetl(f1);  % SPECIES NAME AND LOCAL TEMPERATURE RANGES IN LINE 1
% SPECIES NAME AND LOCAL TEMPERATURE RANGES INLINE 1
   header_data = strsplit(L1,' '); %spliting the line 1 to get the information on species name and temperature names.
% SPECIES NAME of all 53 compounds which present in position 1
    species     = header_data{1};  % NAME OF THE SPECIES OR COMPOUND MOLECULE
% LOCAL TEMPERATURE RANGES from all 53 sets of compounds located at end of the line.
    L_l_T  = str2double(header_data{end-3});   % LOCAL LOW TEMPERATURE present at end of the line - 3 position
    L_h_T  = str2double(header_data {end-2});  % LOCAL HIGH TEMPERATURE present at end of the line - 2 position
    L_m_T  = str2double(header_data {end-1});  % LOCAL MID TEMPERATURE present at end of the line - 1 position

% TEMPERATURE COEFFICIENTS INLINE 2,3,4 from THERMO.dat file for all 53 sets of species.
% LINE 2,3,4 HAS THE VALUES OF HIGH-TEMPERATURE COEFFICIENT AND LOW-TEMPERATURE COEFFICIENT.
% high-temperature coefficient from a1 to a7 FOR AL THE SPECIES

L2 = fgetl(f1); %TEMERTURE COEFFICIENTS IN LINE 2
a   = strfind(L2,'E'); % EXTRACTING COEFFICIENT FROM LINE 2
a1  = str2double(L2(1:a(1)+3));
a2  = str2double(L2(a(1)+4:a(2)+3));
a3  = str2double(L2(a(2)+4:a(3)+3));
a4  = str2double(L2(a(3)+4:a(4)+3));
a5  = str2double(L2(a(4)+4:a(5)+3));

L3 = fgetl(f1);  %TEMERTURE COEFFICIENTS IN LINE 3
a_1 = strfind(L3,'E'); % EXTRACTING COEFFICIENT FROM LINE 3
a6  = str2double(L3(1:a_1(1)+3));
a7  = str2double(L3(a_1(1)+4:a_1(2)+3));
a8  = str2double(L3(a_1(2)+4:a_1(3)+3));
a9  = str2double(L3(a_1(3)+4:a_1(4)+3));
a10 = str2double(L3(a_1(4)+4:a_1(5)+3));

L4 = fgetl(f1); %TEMERTURE COEFFICIENTS IN LINE 4
a_2 = strfind(L4,'E'); % EXTRACTING COEFFICIENT FROM LINE 4
a11 = str2double(L4(1:a_2(1)+3));
a12 = str2double(L4(a_2(1)+4:a_2(2)+3));
a13 = str2double(L4(a_2(2)+4:a_2(3)+3));
a14 = str2double(L4(a_2(3)+4:a_2(4)+3));
% Low-temperature coefficients from a8 to a14 FOR ALL THE SPECIES

% TEMPERATURE T VALUE IS TAKEN FOR 1000 RANDOM VALUES FROM LOCAL LOW TEMPERATURE TO LOCAL HIGH TEMPERATURE.
T = linspace(L_l_T,L_h_T,1000);

for j = 1:length(T)
   if (T(j)<=L_m_T)

       % FORMULAE FOR SPECIFIC HEAT (CP) in low-temperature coefficient
       % FORMULAE FOR ENTHALPY (H) in low-temperature coefficient
       % FORMULAE FOR ENTROPY  (S) in low-temperature coefficient

       c_p(j) = (a8+a9*T(j)+a10*(T(j).^2)+a11*(T(j).^3)+a12*(T(j).^4))*(R);
        H(j)   = ((a8) + (a9*(T(j)/2)) + (a10*((T(j).^2)/3)) + (a11*((T(j).^3)/4)) + (a12*((T(j).^4)/5)) + (a13/T(j)))*(R*T(j));
        S(j)   = ((a8*(log(T(j)))) + (a9*T(j)) + (a10*((T(j).^2)/2))+a11*((T(j).^3)/3)+a12*((T(j).^4)/4)+a14)*(R);
   else
       % FORMULAE FOR SPECIFIC HEAT (CP) in high temperature coefficient
       % FORMULAE FOR ENTHALPY (H) in high temperature coefficient
       % FORMULAE FOR ENTROPY  (S) in high temperature coefficient

       c_p(j) = (a1+a2*T(j)+a3*(T(j).^2)+a4*(T(j).^3)+a5*(T(j).^4))*(R);
        H(j)   = (a1+a2*(T(j)/2)+a3*((T(j).^2)./3)+a4*((T(j).^3)./4)+a5*((T(j).^4)/5)+(a6/T(j)))*(R*T(j));
        S(j)   = (a1*log(T(j))+a2*T(j)+a3.*((T(j).^2)/2)+a4.*((T(j).^3)/3)+a5*((T(j).^4)/4)+a7)*(R);
   end
end


    figure(1) % ALL THE 53 SPECIES Temperature VS specific heat
    plot(T,c_p,'linewidth',1,'color','b')
    xlabel('Temperature (K)')
    ylabel('specific heat(C_p) (J/(Kmol)(K))')
    title(['Temperature VS specific heat for ',species])
    legend('Temperature VS specific heat')

    figure(2) % ALL THE 53 SPECIES Temperature VS Enthalpy
    plot(T,H,'linewidth',1,'color','r')
    xlabel('Temperature (K)')
    ylabel('Enthalpy(H) (J)')
    title(['Temperature VS Enthalpy for ',species])
    legend('Temperature VS Enthalpy')

    figure(3) % ALL THE 53 SPECIES Temperature VS Entropy
    plot(T,S,'linewidth',1,'color','m')
    xlabel('Temperture (K)')
    ylabel('Entropy(S) (J/K)')
    title(['Temperature VS Entropy for ',species])
    legend('Temperature VS Entropy')


   % CREATING A FOLDER FOR EACH SPECIES AND PASTING EACH PLOT IN SPECIFIED SPECIES FOLDER,
   mkdir(['F:\NASA THERMODYNAMIC DATA FOR SPECIES\'],species); % CREATING A SPECIES FOLDER
   figure(1)
   figure(2)
   figure(3)
   % CHANGING THE DIRECTORY FOR PASTING THE PLOTS IN SPECIFIED SPECIES FOLDER.
   cd(['F:\NASA THERMODYNAMIC DATA FOR SPECIES\',species]) % CHANGING THE DIRECTORY FOR PASTING THE PLOTS IN SPECIFIED SPECIES FOLDER.
   % SAVING THE FIGURE PLOTS OF ALL THREE. IN CHANGE DIRECTORY.
   saveas(figure(1),['Temperature VS specific heat for ',species],'jpg')
   saveas(figure(2),['Temperature VS Enthalpy for ',species],'jpg')
   saveas(figure(3),['Temperature VS Entropy for ',species],'jpg')

    % FIND THE MOLECULAR WEIGHT OF EACH SPECIES WHICH ARE IN MOLECULAR COMPOUND.
    compound = char(species); % taking each species as molecular compound
    % intial atoms are CARBON, HYDROGEN, OXYGEN, NITROGEN, ARGON, AND SULPHR
    atoms = ['C','H','O','N','A','S'];
    % assing the each atom with specified atomic weight for C, H, O, N, A, S.
    atoms_w = [12.011,1.008,15.999,14.006,39.948,32.065];
    molecular_weight = 0;
for k = 1:length(compound)
   for m =1:length(atoms)
       if strcmp(compound(k),atoms(m)) % compareing the data of two string which are compound and atoms.

          molecular_weight = molecular_weight + atoms_w(m);
          each_atom = m;
       end
   end
     n = str2double(compound(k));
   if n>1
     molecular_weight =  molecular_weight + atoms_w(each_atom)*(n-1);
   end
end
   fprintf('molecular weight of %s:%f u\n',compound,molecular_weight)
end
MOLECULAR WEIGHT OF ALL SPECIES:

EXAMPLE OUTPUT PLOTS OF SPECIES:
1. H20 FOLDER DATA
2. HOCN FOLDER DATA