Project 1 - Parsing NASA thermodynamic data
AIM : To write a MATLAB code for parsing NASA thermodynamic data.
OBJECTIVES :
1. To write a function that extracts the 14 co-efficients and calculate the enthalpy,entropy and specific heats for all the species in data file.
2. To calculate the molecular weight of each species and to display it in the command window.
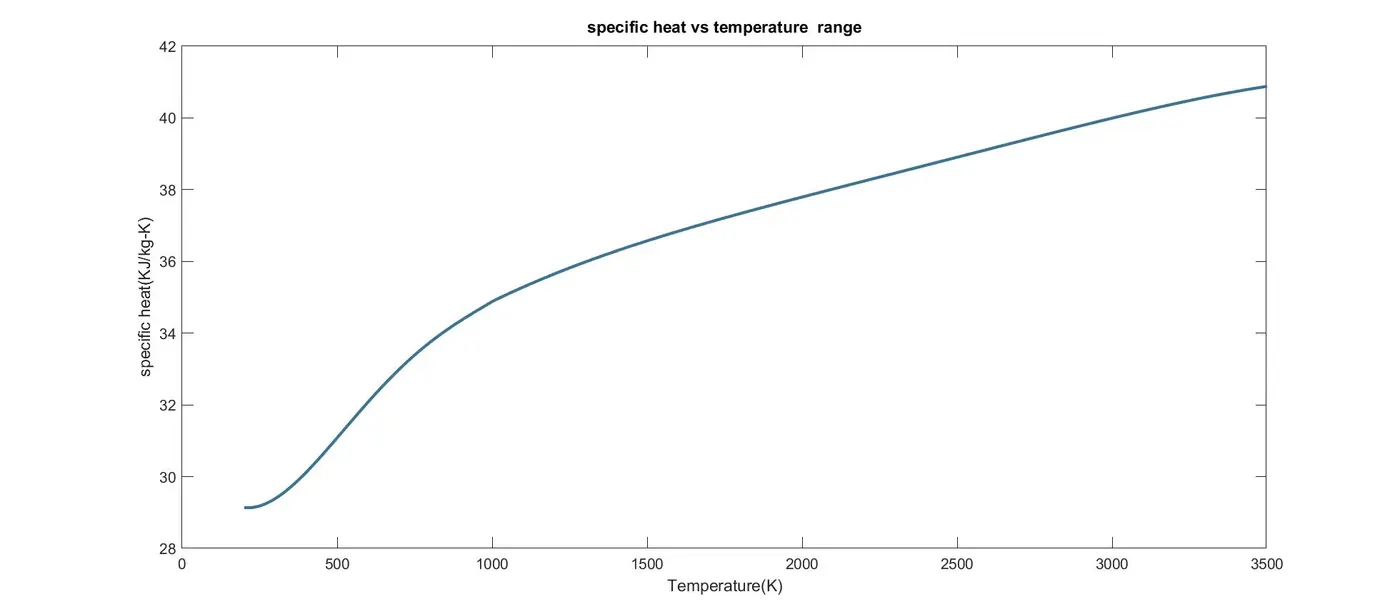
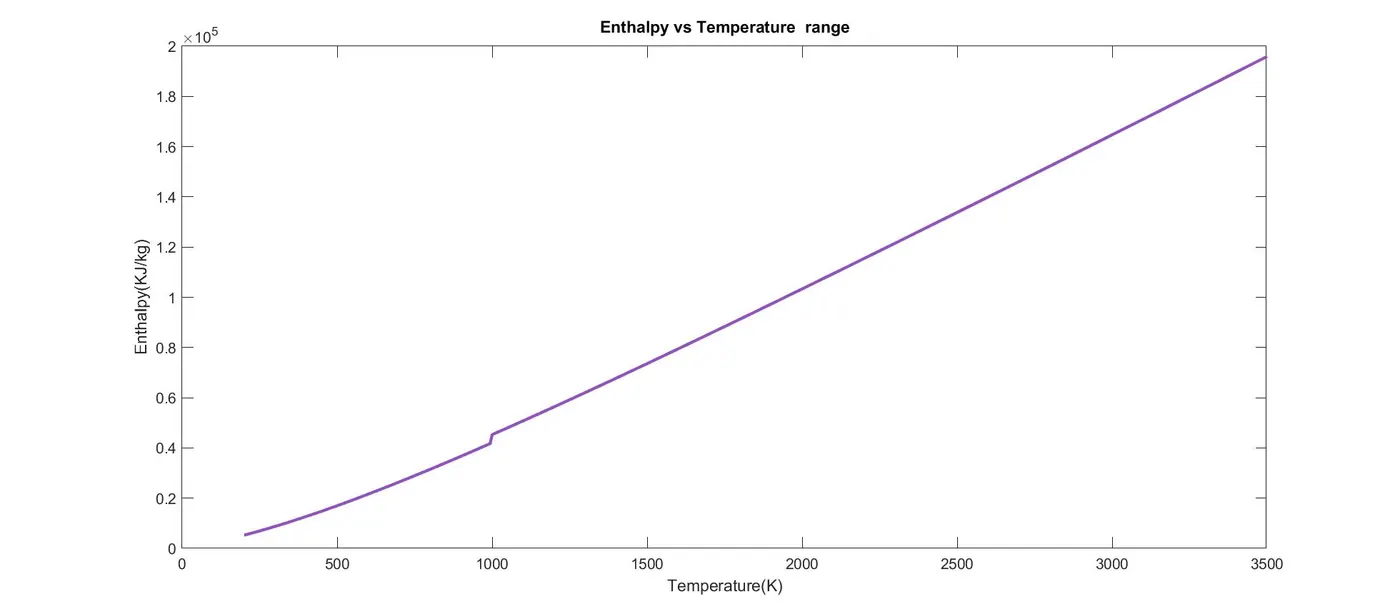
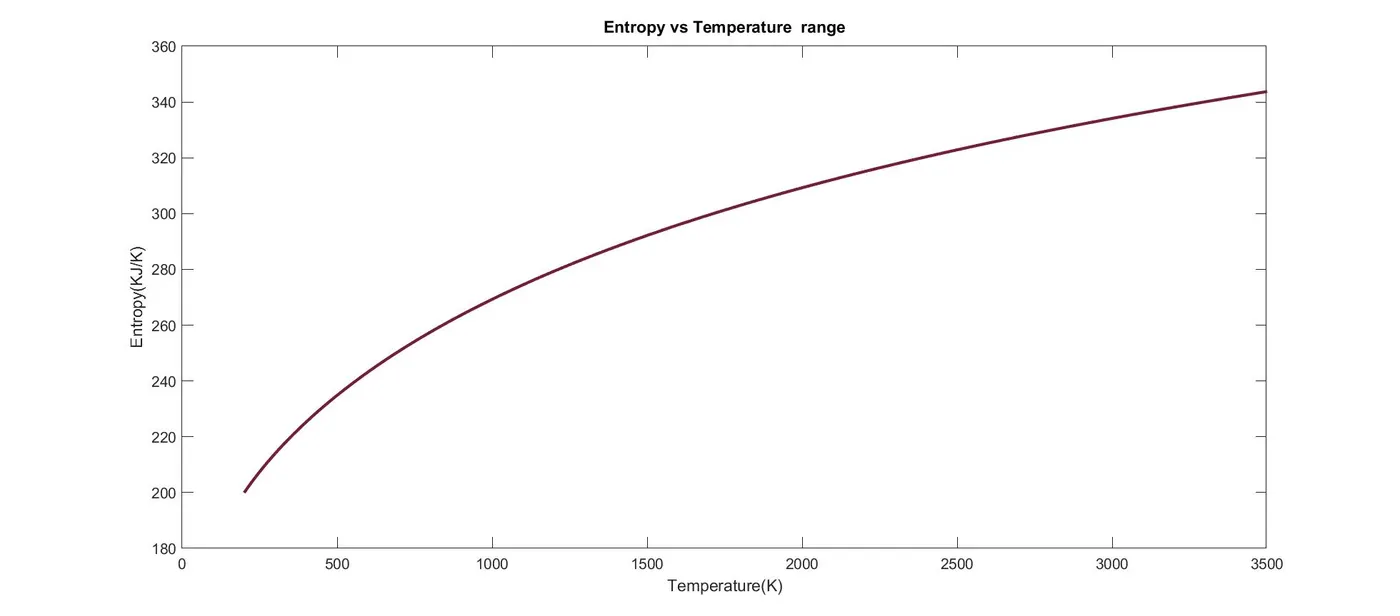
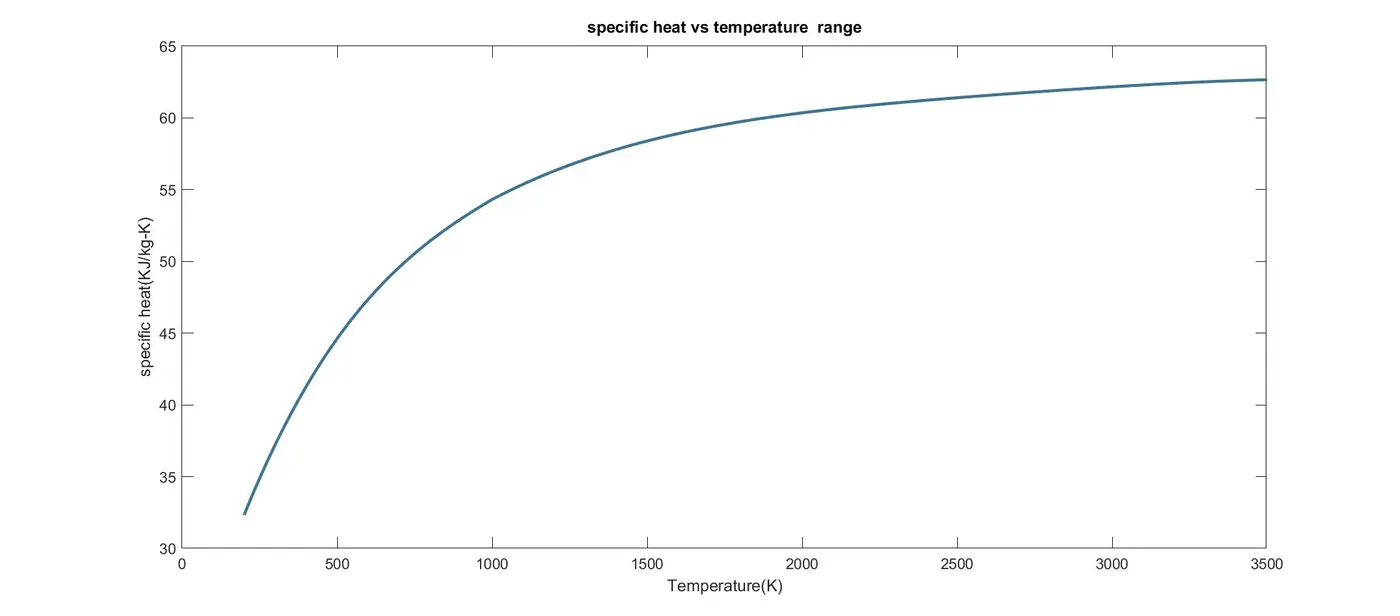
3. To plot Cp,Enthalpy and Entropy for the local temperature range.
4. To save the plots as images with appropriate names and dump them in separate folders for each species with suitable name. All these should be generated automatically.
5. The main program that will be submitted should just take the "THERMO.dat" file as an input and generate Cp, H and S plots.
File parsing :
'THERMO.dat' file is NASA thermodynamic file in which there are temperature ranges and 53 species are given in this data file and each species contains 14 coefficients and temperature ranges.
By using File parsing method we have to parse these 14 coefficients to find specific heat,Enthalpy and Entropy.
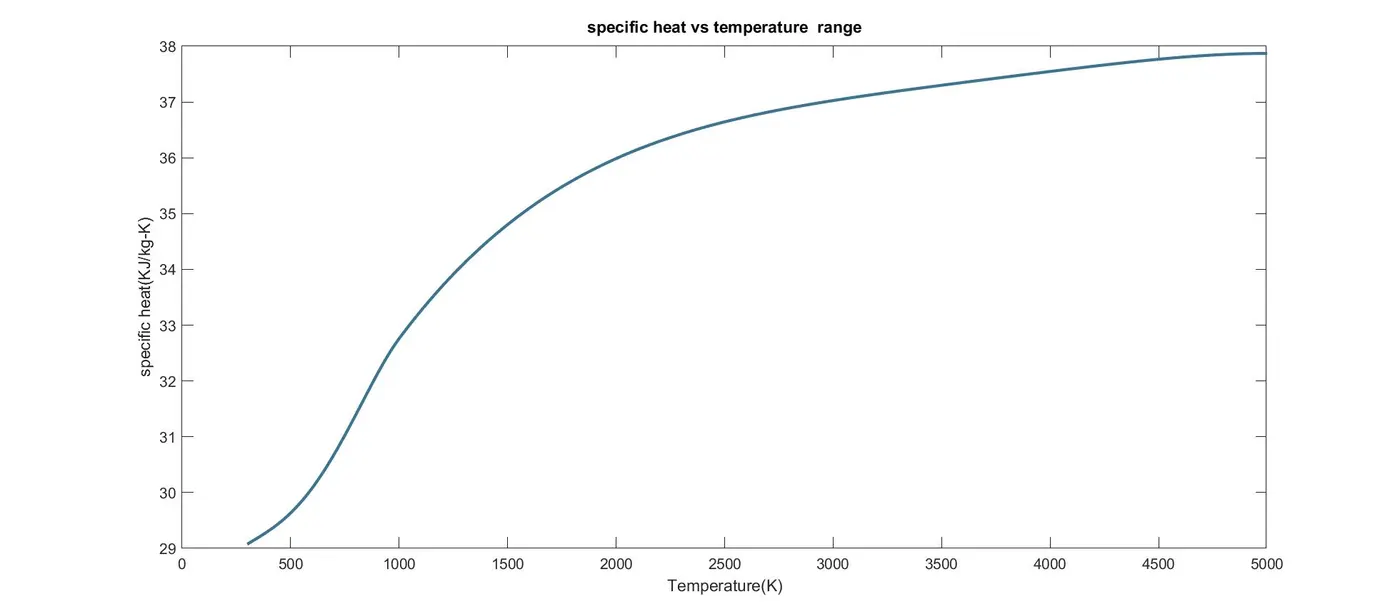
Specific heat : Specific heat capacity is defined as the amount of heat required to raise the temperature of 1 kilogram of a substance by 1 kelvin (SI unit of specific heat capacity J kg−1 K−1).The relationship between heat and temperature range is usually expressed in the form of Cp.
where Cp is Specific heat
`C_p/R = a1 + a2T + a3 T^2 + a4 T^3 + a5 T^5`
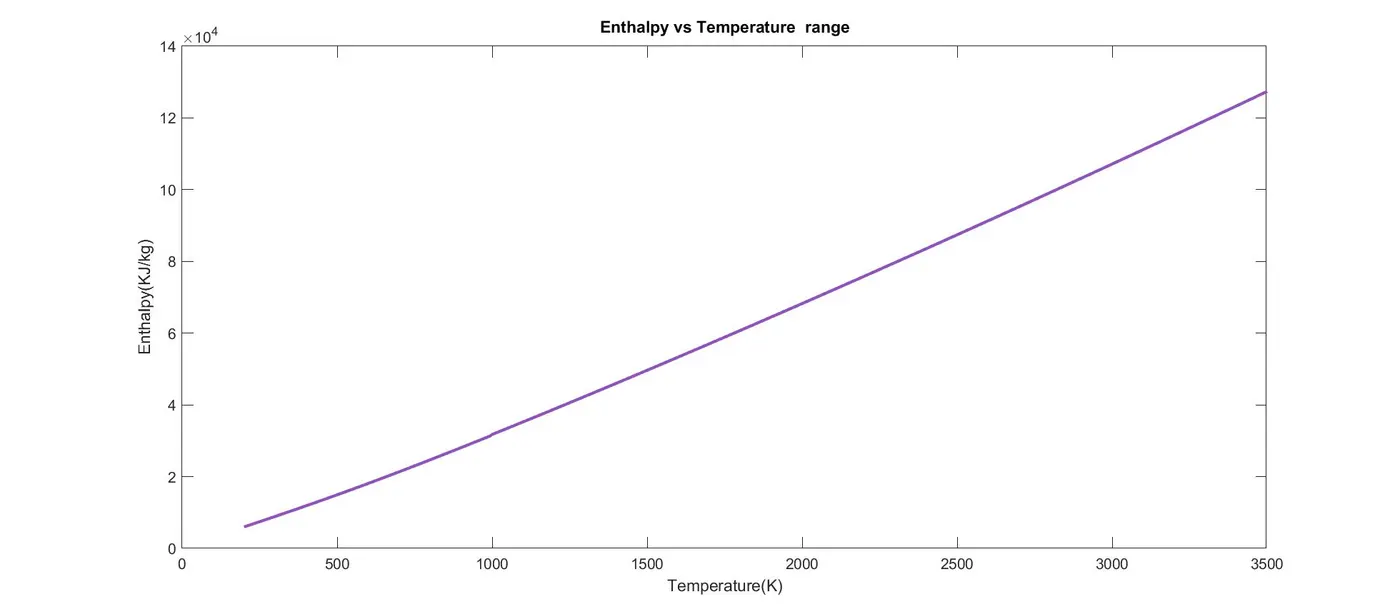
Enthalpy : Enthalpy is a thermodynamic property of a system. It is the sum of the internal energy added to the product of the pressure and volume of the system. It reflects the capacity to do non-mechanical work and the capacity to release heat.
Where H is enthalpy
`H / (RT) = a1 + a2 T/2 + a3 T^2/3 + a4 T^3/4+a5 T^4/5 +a6 / T`
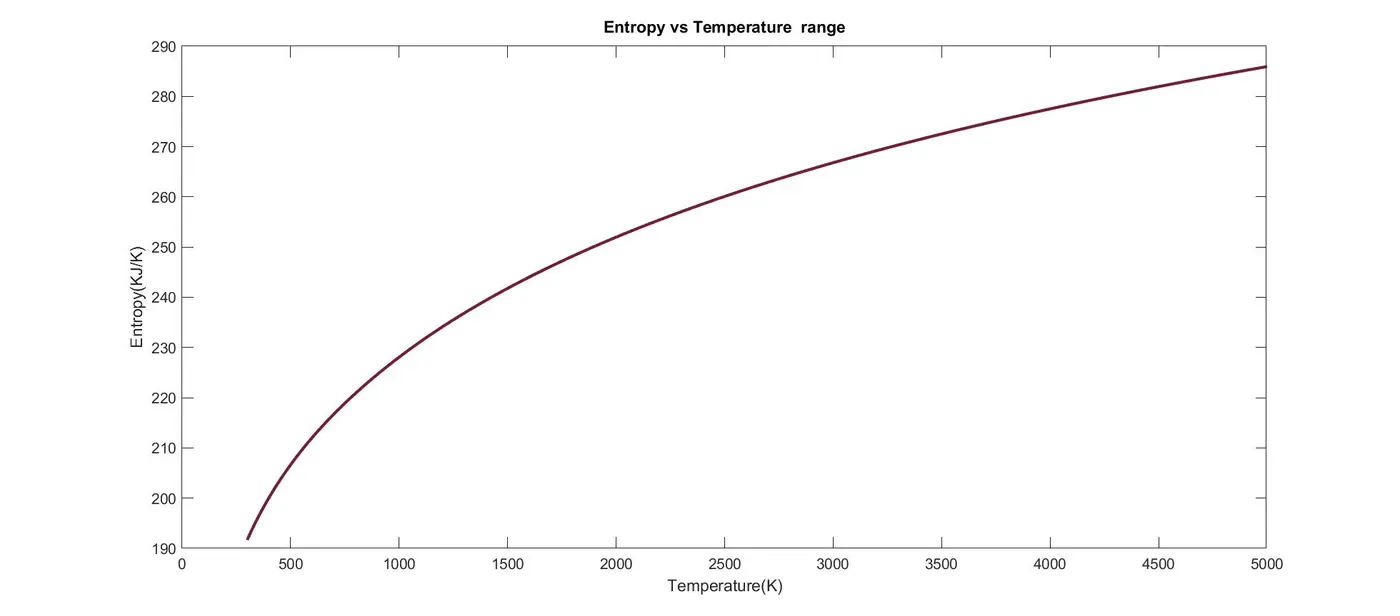
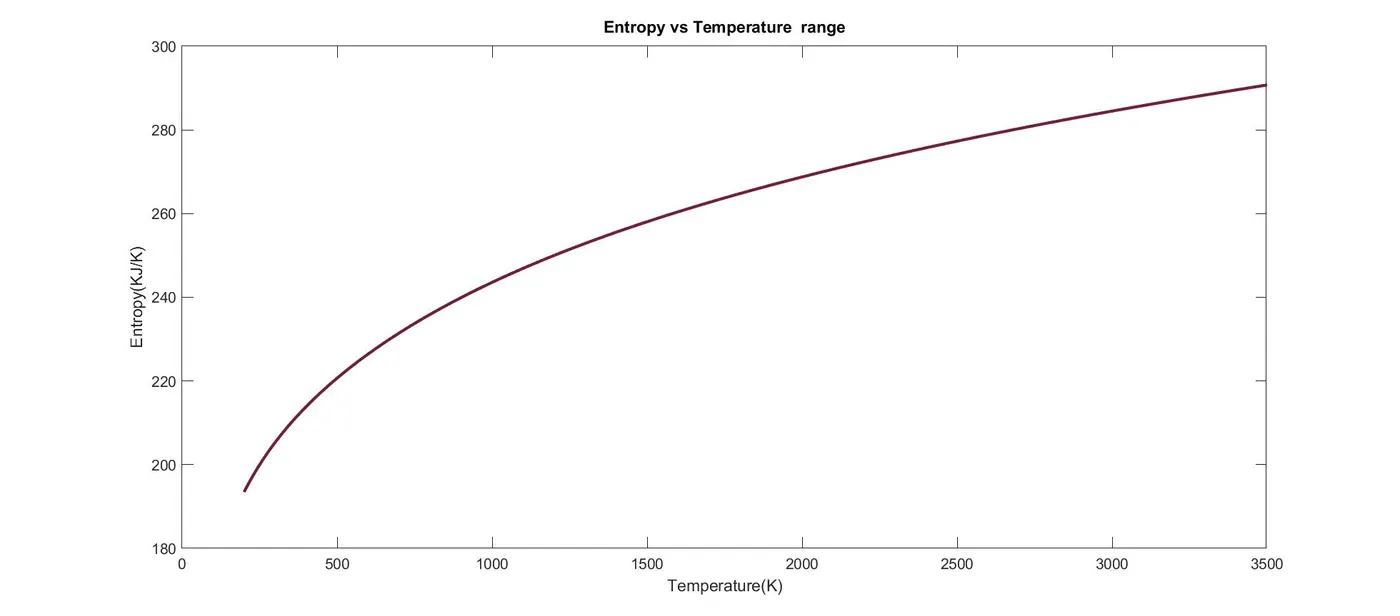
Entropy : Entropy, the measure of a system’s thermal energy per unit temperature that is unavailable for doing useful work. Because work is obtained from ordered molecular motion , the amount of entropy is also a measure of the molecular disorder, or randomness, of a system.
Where S = entropy
`S/R = a1 lnT + a2T + a3 T^2/2 +a4 T^3/3 +a5 T^4/4 + a7`
EXPLANATION OF THE CODE :
The program begins with clear all,close all and clc to clear and free up the command window and workspace .
Firstly,universal gas constant R is given as an input and we will raed the external NASA thermodynamic file THERMO.dat using fopen(to open the file)command and the data in the file can be read line by line using fgetl command.
We will use strsplit command to split the temperature values and it converts them in to cell array.
To convert this cell array from string to a number mun2str command is used to find low,mid and high temperatures.
The data that is to be extracted for all 53 species mentioned in the file are 14 coefficients (7 for higher temperature and 7 for lower temperatures),species name and the local temperature limits.
By using for loop we will find the 53 elements in the data file by assigning fgetl command and then splitting the cell array to find the species line, then species name and the number of temperatures in the species line .
To read the coefficient in the data file we will first find the string 'E' by using strfind coomand to find before and after numbers of the coefficients and then we will read the remaining 14 coefficients.
To convert these coefficients from string to a number we will use str2num command.
Calculation of specific heat,enthalpy,entropy and molecular weight can be done in separate functions and will called in main program.
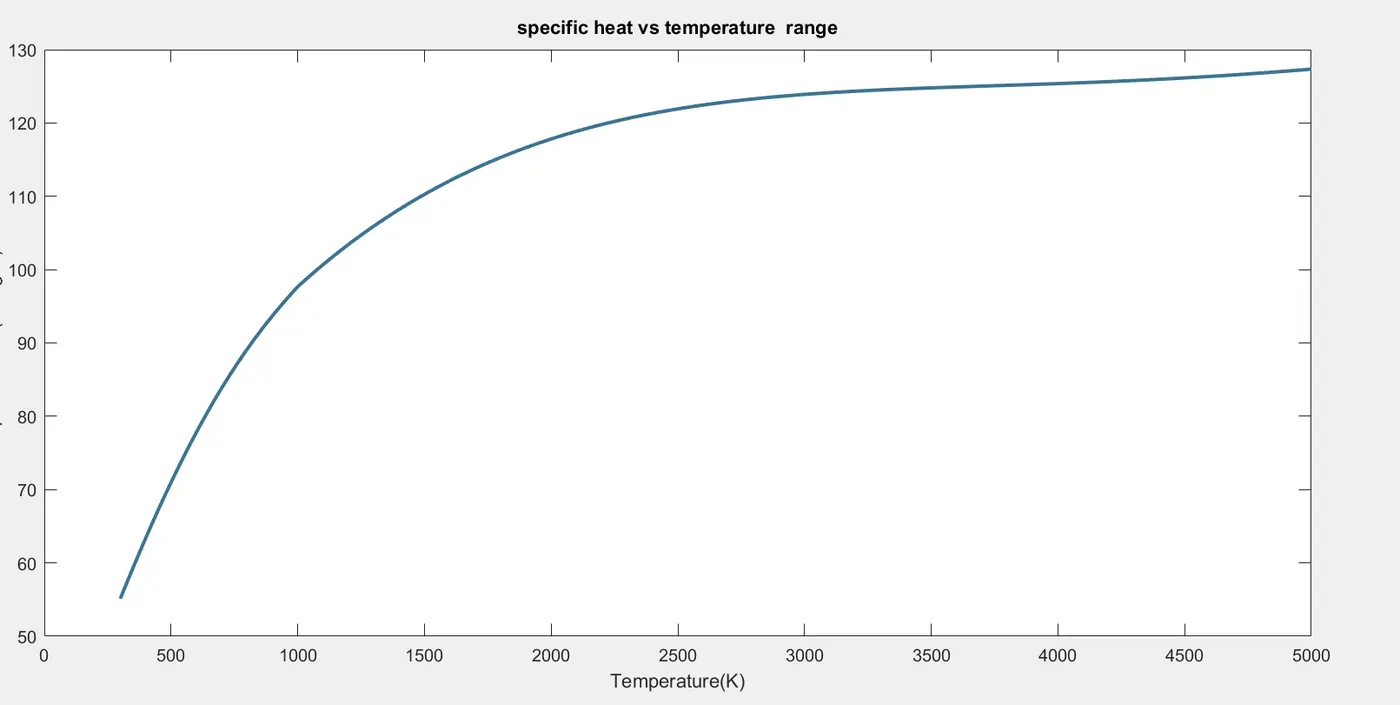
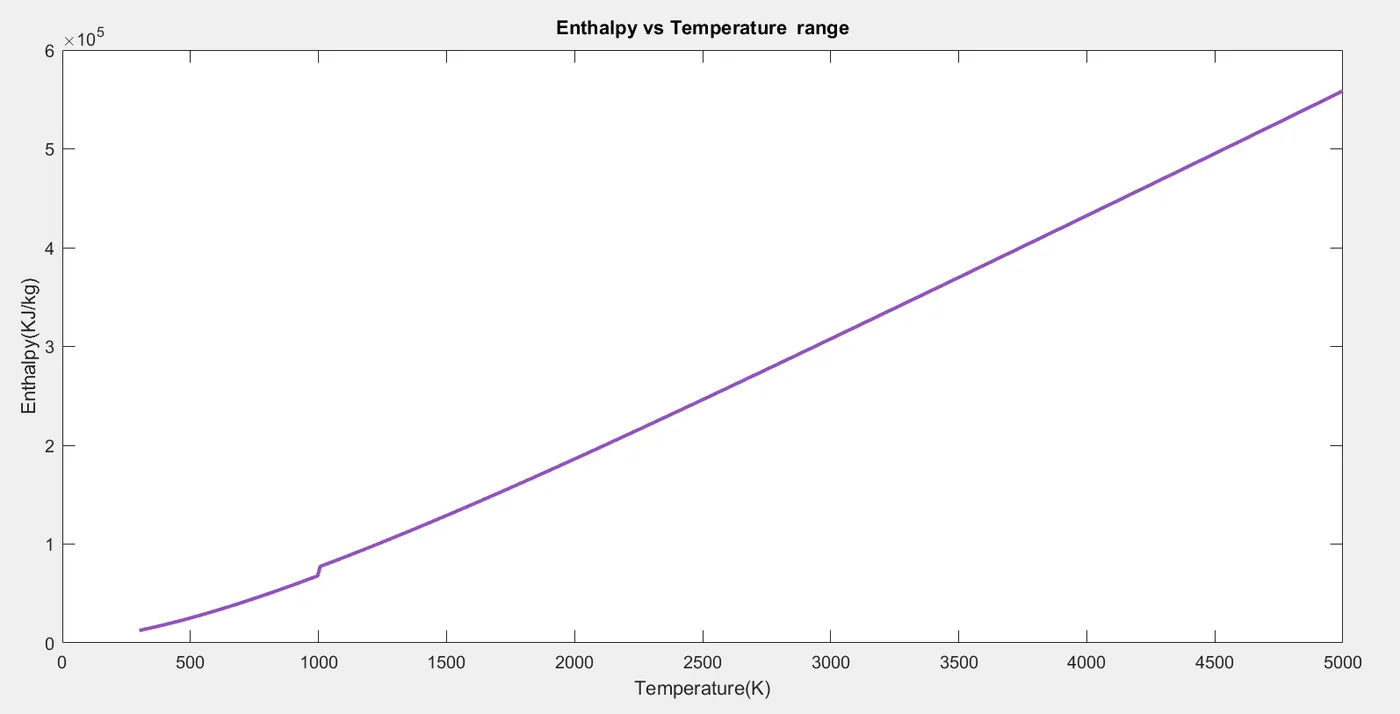
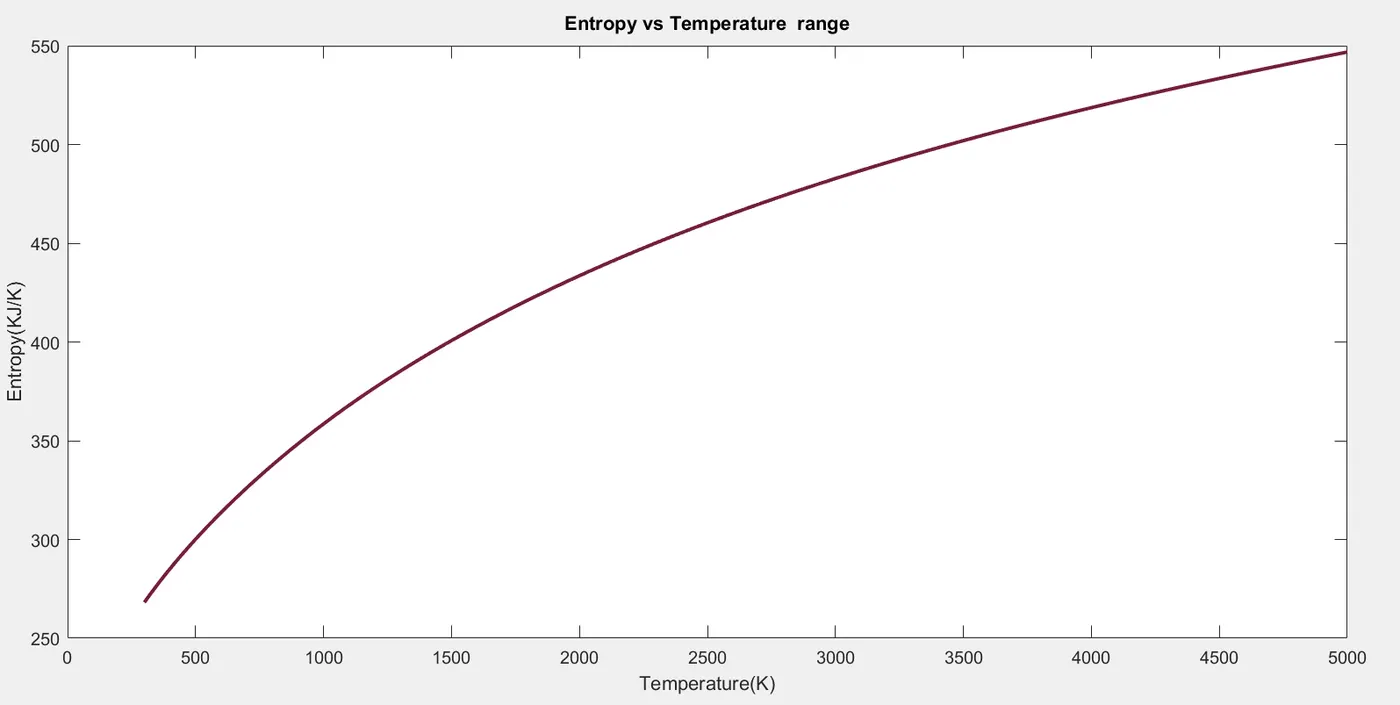
Then we will create plots for specific heat(Cp) vs temperature,Enthalpy(H) vs temperature,Entropy(S) vs temperature for all 53 species and these 3 plots will be saved in separate folders for each species in jpg format.
The molecular weight of all these species will be displayed in the command window.
We will saveas command to save the plots of different species in the directory command.
MATLAB CODE :
MAIN PROGRAM
clear all
close all
clc

%Inputs
R = 8.314; %Universal gas constant

% Reading data file
% open file and read 'THERMO.dat' file
f1 = fopen('THERMO.dat','r')
line_1 = fgetl(f1); % skipping this line
line_2 = fgetl(f1);

% obtaining global temperature values
% storing them as numbers in separate values
global_values = strsplit(line_2,' ')
g_low_temp  = str2num(global_values{2})
g_mid_temp  = str2num(global_values{3})
g_high_temp = str2num(global_values{4})

line_3 = fgetl(f1); %skipping this line
line_4 = fgetl(f1); %skipping this line
line_5 = fgetl(f1); %skipping this line

for i = 1:53
    T = fgetl(f1);
%extracting species name
species_name = T(1:9);
species_name = deblank(species_name); %removing blank spaces
%extracting local temperatures
species_temp = T(49:75);
local_values = strsplit(species_temp,' ');
local_low_temp = str2num(local_values{1});
local_mid_temp = str2num(local_values{3});
local_high_temp = str2num(local_values{2});
%storing the local temperature values in a variable
temp = [local_low_temp local_mid_temp local_high_temp]
temp_range = linspace(local_low_temp,local_high_temp,500);

coeff = fgetl(f1)
coeff1 = strfind(coeff,'E');

%Extracting the coefficients
a1 = coeff(1:coeff1(1)+3);
a1 = str2num(a1);
a2 = coeff(coeff1(1)+4:coeff1(2)+3);
a2 = str2num(a2);
a3 = coeff(coeff1(2)+4:coeff1(3)+3);
a3 = str2num(a3);
a4 = coeff(coeff1(3)+4:coeff1(4)+3);
a4 = str2num(a4);
a5 = coeff(coeff1(4)+4:coeff1(5)+3);
a5 = str2num(a5);

new_line = fgetl(f1);
coeff2 = strfind(new_line,'E');

%Extracting the coefficients
a6 = new_line(1:coeff2(1)+3);
a6 = str2num(a6);
a7 = new_line(coeff2(1)+4:coeff2(2)+3);
a7 = str2num(a7);
a8 = new_line(coeff2(2)+4:coeff2(3)+3);
a8 = str2num(a8);
a9 = new_line(coeff2(3)+4:coeff2(4)+3);
a9 = str2num(a9);
a10 = new_line(coeff2(4)+4:coeff2(5)+3);
a10 = str2num(a10);

new_line1 = fgetl(f1);
coeff3 = strfind(new_line1,'E');

%Extracting the coefficients
a11 = new_line1(1:coeff3(1)+3);
a11 = str2num(a11);
a12 = new_line1(coeff3(1)+4:coeff3(2)+3);
a12 = str2num(a12);
a13 = new_line1(coeff3(2)+4:coeff3(3)+3);
a13 = str2num(a13);
a14 = new_line1(coeff3(3)+4:coeff3(4)+3);
a14 = str2num(a14);

% Calculation of specific heat
Cp = specific_heat(a1,a2,a3,a4,a5,a8,a9,a10,a11,a12,temp,temp_range,R);

%Calculation of enthalpy
[H] = enthalpy(a1,a2,a3,a4,a5,a6,a8,a9,a10,a11,a12,a13,temp,temp_range,R);

% Calculation of entropy
S = entropy_1(a1,a2,a3,a4,a5,a7,a8,a9,a10,a11,a12,a14,temp,temp_range,R);

%Calculation of Molecular weight
m_weight = weight(species_name);

% saving molecular weight
species_w = fopen('species_mass.txt','w');
fprintf(species_w,'molecular mass of %s is %f',species_name,m_weight);
fclose(species_w);

%plotting Cp,H,S with temperature
cd('C:/Users/bhargavi/Desktop/bhargavi/matlab files/species_name')

%Each folder in different species
cd(species_name);

%plot 1 Cp vs temp_range
figure(1)
plot(temp_range,Cp,'linewidth',2,'color',[0.2345 0.4675 0.5679])
xlabel('Temperature(K)');
ylabel('specific heat(KJ/kg-K)');
title('specific heat vs temperature _ range');

%plot 2 H vs temp_range
figure(2)
plot(temp_range,H,'linewidth',2,'color',[0.5678 0.3232 0.7478])
xlabel('Temperature(K)')
ylabel('Enthalpy(KJ/kg)')
title('Enthalpy vs Temperature _ range')

% plot 3 S vs temp_range
figure(3)
plot(temp_range,S,'linewidth',2,'color',[0.4532 0.1324 0.3324])
xlabel('Temperature(K)')
ylabel('Entropy(KJ/K)')
title('Entropy vs Temperature _ range')

%Saving the plots in separate folder for each species
saveas(1,'specific heat.jpg');
saveas(2,'Enthalpy.jpg');
saveas(3,'Entropy.jpg');

cd('C:/Users/bhargavi/Desktop/bhargavi/matlab files');%changing directory to original data path

%printing the molecular weight of the species
sprintf('molecular weight of %s = %f',species_name,m_weight)

end

%closing the file
fclose(f1)
FUNCTION TO FIND SPECIFIC HEAT :
To find specific heat we should create specific heat function and assign it to its related coefficients i.e., 14 coefficients,temp_range,gas constant, and temperature.
To specify temperature high coefficient we are using if condition where temp_range is less than or equal to mid temperature.
Then we will use else condition to specify low temperature coefficients
Finally end the loop and the function to calculate specific heat.
function[Cp] = specific_heat(a1,a2,a3,a4,a5,a8,a9,a10,a11,a12,temp,temp_range,R)
% a1 a2 a3 a4 a5 are high temperature coefficients
% a8 a9 a10 a11 a12 are low temperature coefficients
for i = 1:length(temp_range)
if temp_range(i)<= temp(2)
   Cp(i) = R*(a8+(a9*temp_range(i))+(a10*(temp_range(i).^2))+(a11*(temp_range(i).^3))+(a12*(temp_range(i).^4)));
else
   Cp(i) = R*(a1+(a2*temp_range(i))+(a3*(temp_range(i).^2))+(a4*(temp_range(i).^3))+(a5*(temp_range(i).^4)));

end
end
FUNCTION TO FIND ENTHALPY :
To find Enthalpy we should create enthalpy function and assign it to its related coefficients i.e., 14 coefficients , temp_range, gas constant and temperature.
To specify low temperature coefficient we are using if condition where temp_range less than or equal to mid temperature.
Then we will use else condition to specify high temperature coefficients.
Finally end the loop and the function to calculate enthalpy.
function[H] = enthalpy(a1,a2,a3,a4,a5,a6,a8,a9,a10,a11,a12,a13,temp,temp_range,R)
%a1 a2 a3 a4 a5 are high temperature coefficients
%a8 a9 a10 a11 a12 are low temperature coefficients

for i = 1:length(temp_range)
    if temp_range(i)<=temp(2)
        H(i) = R*((a8*temp_range(i))+(a9*((temp_range(i).^2)/2))+(a10*((temp_range(i).^3)/3))+(a11*((temp_range(i).^4)/4))+(a12*((temp_range(i).^5)/5)));
    else
        H(i) = R*((a1*temp_range(i))+(a2*((temp_range(i).^2)/2))+(a3*((temp_range(i).^3)/3))+(a4*((temp_range(i).^4)/4))+(a5*((temp_range(i).^5)/5)));
    end
end
FUNCTION TO FIND ENTROPY :
To find Entropy we should create entropy function and assign it to its related coefficients i.e., 14 coefficients , temp_range, gas constant and temperature.
To specify low temperature coefficient we are using if condition where temp_range less than or equal to mid temperature.
Then we will use else condition to specify high temperature coefficients.
Finally end the loop and the function to calculate entropy.
function[S] = entropy_1(a1,a2,a3,a4,a5,a7,a8,a9,a10,a11,a12,a14,temp,temp_range,R)
% a1 a2 a3 a4 a5 are high temperature coefficients
%a8 a9 a10 a11 a12 are low temperature coefficients
 for i = 1:length(temp_range)
     if temp_range(i)<=temp(2)
         S(i) = R.*((a8*log(temp_range(i)))+(a9*(temp_range(i)))+(a10*((temp_range(i).^2)/2))+(a11*((temp_range(i).^3)/3))+(a12*((temp_range(i).^4)/4))+a14);
     else
         S(i) = R.*((a1*log(temp_range(i)))+(a2*(temp_range(i)))+(a3*((temp_range(i).^2/2))+(a4*((temp_range(i).^3)/3))+(a5*((temp_range(i).^4)/4))+a7));
     end
 end
FUNCTION TO FIND MOLECULAR WEIGHTS OF DIFFERENT SPECIES :
Create an molecular weight function (m_weight) and assign species_name input to it.
Then create an array 'element' which defines the main element of all 53 species i.e., 'H','O','N','Ar','C','S'.
By using above elements we will create an which defines the atomic mass of the elements.Those atomic mass values can be considered from using internet source.
Now we will assign molecular weight as zero and then create for loops. 1st for loop runs throughout the length of the species name and 2nd for loop runs throughout the length of the element.
By using if condition and strcmp condition we will compare the species name and elements to calculate the molecular weights.If by comparison both strings found same we will assign its molecular weight.
By running if condition if there are anyspecies that contains more than one element i.e., b>1 then we will molecular weight by multiply position and b-1 to the molecular weight array.End the loop and the function.
function[m_weight] = weight(species_name)

element = {'H','O','N','Ar','C','S'};
atomic_mass = [1.008,15.999,14.007,39.948,12.011,32.065];
m_weight = 0;
for i=1:length(species_name)
    for j = 1:length(element)
        if strcmp(species_name(i),element(j))
            m_weight = m_weight+atomic_mass(j);
            a= j;
        end
    end
    b = str2num(species_name(i));
    if b>1
        m_weight = m_weight+atomic_mass(a)*(b-1);
    end
end
end
PLOTS FOR SPECIFIC HEAT,ENTHALPY AND ENTROPY :
- Screenshots showing location of folders created for different species



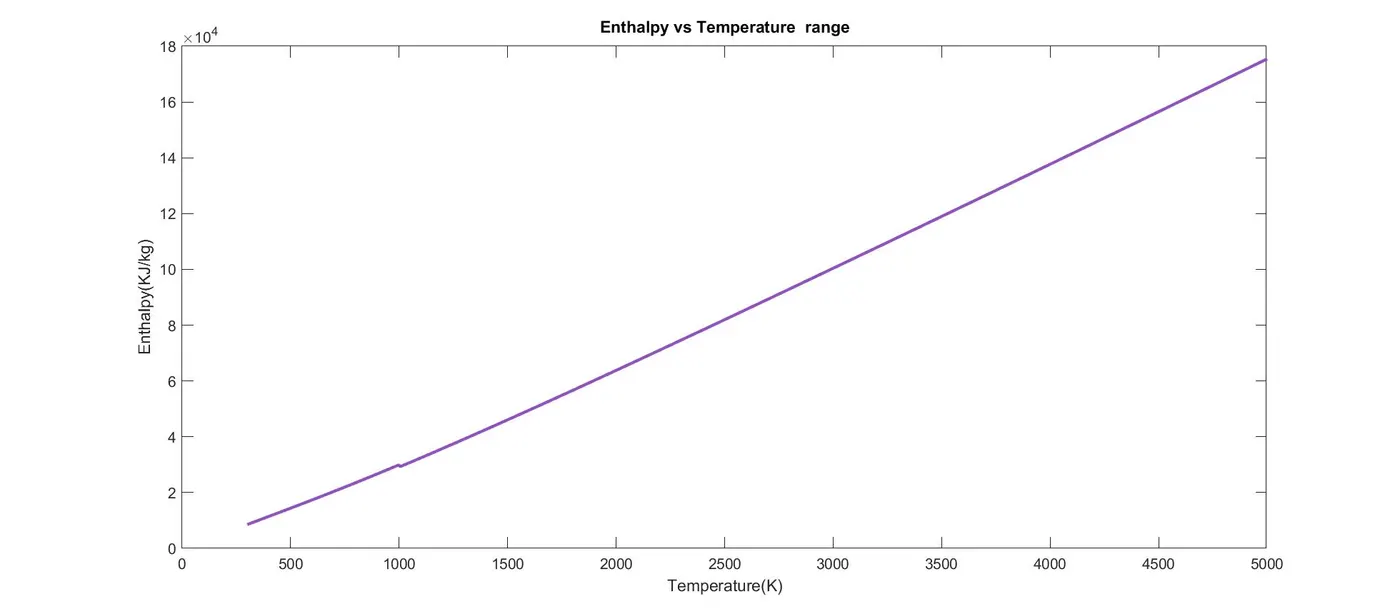
PLOTS OF SPECIFIC HEAT,ENTHALPY AND ENTROPY FOR N2,O2 AND CO2 :
PLOT OF N2:
PLOT OF O2
PLOTS OF CO2
OUTPUT OF COMMAND WINDOW:
In the output of command window the molecuar weights of different species will be displayed.
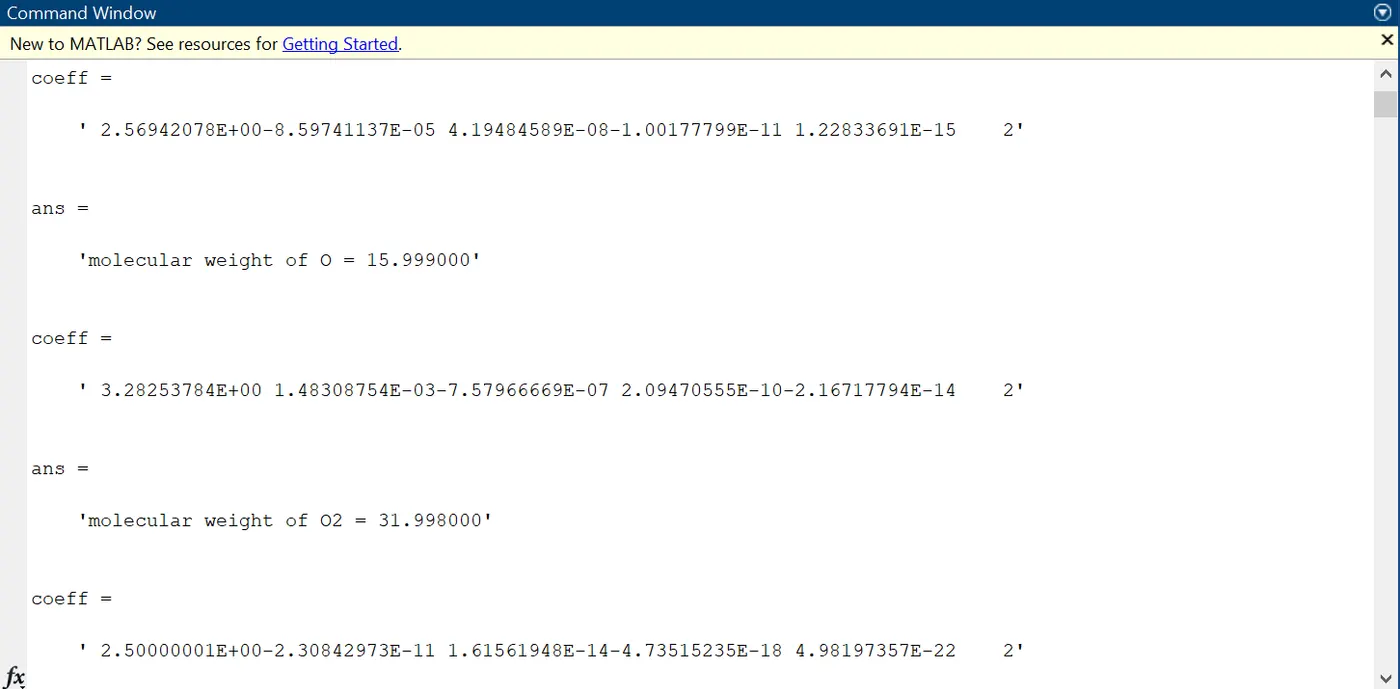
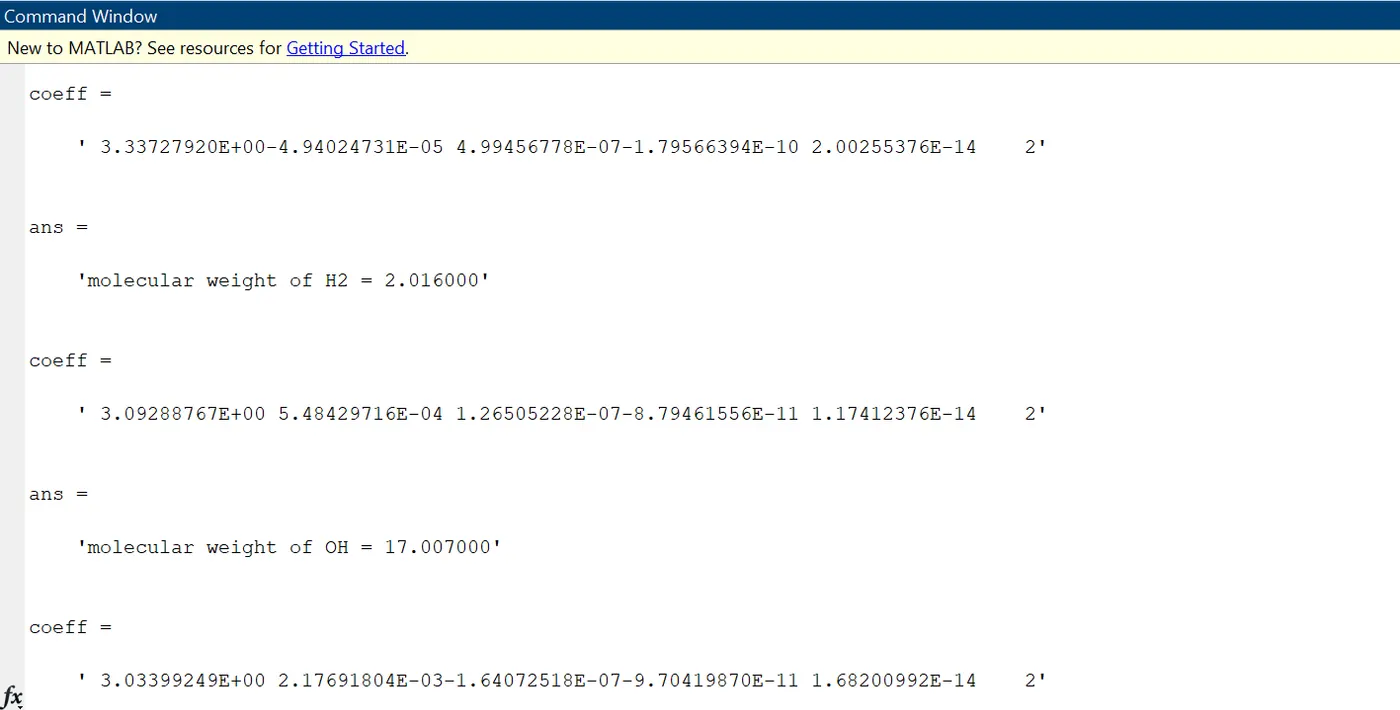
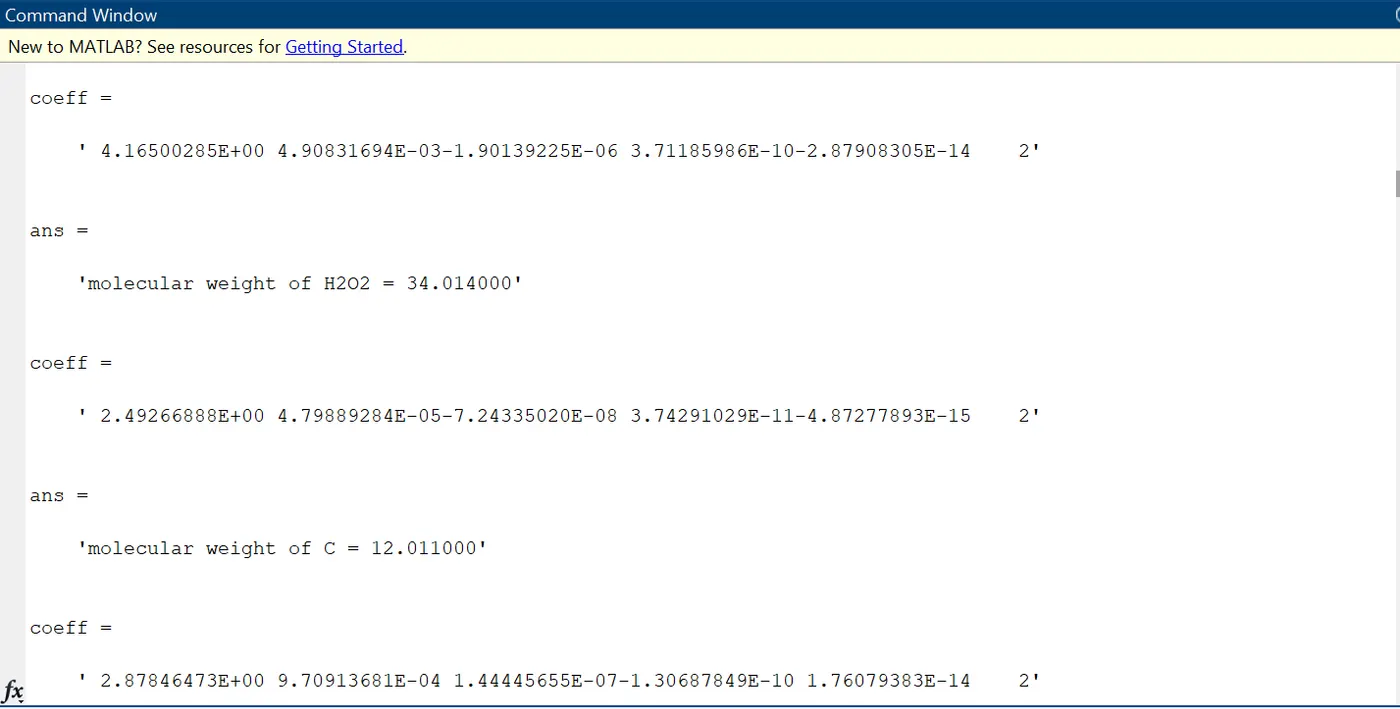
Similarly,the molecular weights of all 53 species will be displayed in the command window.
REFERENCES :
https://www.mathworks.com/help/matlab/ref/mkdir.html
http://matlab.izmiran.ru/help/techdoc/ref/strfind.html
https://www.mathworks.com/matlabcentral/answers/106320-make-a-loop-to-calculate-molecular-weight
https://www.mathworks.com/help/matlab/ref/strcmp.html
http://www.thermix.net/2012/05/enthalpy-entropy-and-specific-heat.html