Parsing NASA thermodynamic data
Aim:-To Write a Code On File Parsing Of Nasa Thermodynamic Data By Using Mat-Lab And Evaluate The Following Things:-
- Write a Function That Extract The 14 Coefficient And Calculate The Enthalpy(H),Entropy(s, Specific Heat (Cp) For All The Species In Data.
- Where R Is The Universal Gas Constant,T Is Temperature.The First 7 Coefficient Are High Temperature Coefficient And The Second 7 Coefficient Are Low Temperature Coefficients.Also Use The Local Temperature Range Which Is Unique For Each Individual Species, Not The Global Temperature Range.
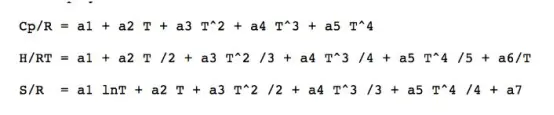
- And Save The Plots As Images With Appropriate Names And Dump Them In a Separate Folders For Each Species With Suitable Name. All These Should Be Generate Automatically.
- Also Calculate The Molecular Weight Of Each Species And Display In The Command Window.
Theory:-
Parsing in computer languages refers to syntactic analysis of the input code into its components parts in order to facilitate the writing of compilers and interpreters. Parsing a file means reading in a data stream of some sort and building an in memory model of the semantic content of that data.
Commands which is used in the code
- Fopen=To Open Fileor Obtain Information About Open Files.
- Fgetl=Read Line From File, Removing Newline Characters.
- While loop=While loop to repeat when condition is tru
- Frewind=Move file position indicator to beginning of open file
- Strsplit=Split string or character vector at specified delimiter.
- Strnum=Convert character array or string to numeric array.
- Strcmp=compare strings.
- Findst=Find string within another, longer string.
- Mkdir=make new folder.
- CD=change current folder.
- Fprintf=write data to text file.
Mat-lab code:-
%file parcing on nasa thermodynamic data
clear all
close all
clc

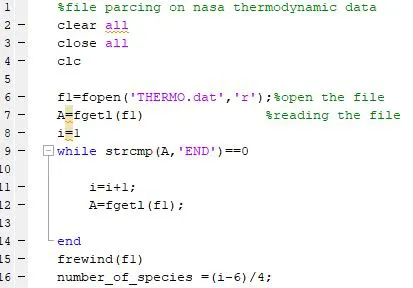
f1=fopen('THERMO.dat','r');%open the file
A=fgetl(f1)               %reading the file
i=1
while strcmp(A,'END')==0

    i=i+1;
    A=fgetl(f1);

end
frewind(f1)
number_of_species =(i-6)/4;

%header
F1=fopen('THERMO.dat','r');
tline=fgetl(F1);
tline1=fgetl(F1);
tline2=strsplit(tline1);

global_low_temper=str2num(tline2{2});
global_medium_temper=str2num(tline2{3});
global_high_temper=str2num(tline2{4});
tline3=fgetl(F1);
tline4=fgetl(F1);
tline5=fgetl(F1);


for i=1:number_of_species
    tline6 = fgetl(F1);  %reading the file
    tline7 = strsplit(tline6);
    a=length(tline7);
    species_name = tline7{1};


    local_low_temper = str2num(tline7{a-3});
    local_high_temper = str2num(tline7{a-2});
    local_mid_temper= str2num(tline7{a-1});

    % line1 reading coefficients
    coffline1=fgetl(F1);
    tline8=strsplit(coffline1);

    X=findstr(coffline1,'E');
    a1=coffline1(1:X(1)+3);
    a1=str2double(a1);            %storing 1st coefficients
    a2=coffline1(X(1)+4:X(2)+3);
    a2=str2double(a2) ;           %storing 2nd coefficients
    a3=coffline1(X(2)+4:X(3)+3);
    a3=str2double(a3);            %storing 3rd coefficients
    a4=coffline1(X(3)+4:X(4)+3);
    a4=str2double(a4);            %storing 4th coefficients
    a5=coffline1(X(4)+4:X(5)+3);
    a5=str2double(a5);            %storing 5th coefficients


     %line2 reading coefficients
    coffline2=fgetl(F1);
    tline9=strsplit(coffline2);

    Y=findstr(coffline2,'E');
    a6=coffline2(1:Y(1)+3);
    a6=str2double(a6);             %storing  6th coefficients
    a7=coffline2(Y(1)+4:Y(2)+3);
    a7=str2double(a7);             %storing  7th coefficients
    a8=coffline2(Y(2)+4:Y(3)+3);
    a8=str2double(a8);             %storing  8th coefficients
    a9=coffline2(Y(3)+4:Y(4)+3);
    a9=str2double(a9);             %storing  9th coefficients
    a10=coffline2(Y(4)+4:Y(5)+3);
    a10=str2double(a10);           %storing  10th coefficients


     %line3 reading coefficients
    coffline3=fgetl(F1);
    tline10=strsplit(coffline3);

    Z=findstr(coffline3,'E');
    a11=coffline3(1:Z(1)+3);
    a11=str2double(a11);            %storing  11th coefficients
    a12=coffline3(Z(1)+4:Z(2)+3);
    a12=str2double(a12);            %storing  12th coefficients
    a13=coffline3(Z(2)+4:Z(3)+3);
    a13=str2double(a13);            %storing  13th coefficients
    a14=coffline3(Z(3)+4:Z(4)+3);
    a14=str2double(a14);            %storing  14th coefficients

    T=linspace(local_low_temper,local_high_temper,100);
    t1=local_low_temper;
    t2=local_mid_temper;
    t3=local_high_temper;
    R=8.314;
 for i=1:length(T)
if T(i)> t2

     CP(i)=(a1+a2*T(i)+a3*T(i)^2+a4*T(i)^3+a5*T(i)^4)*R;
     H(i)=(a1+(a2*(T(i)))/2+(a3*(T(i))^2)/3+(a4*(T(i))^3)/4+((a5*(T(i))^4)/5)+(a6/(T(i))))*R*(T(i));
     S(i) =(a1*log(T(i))+a2*T(i)+(a3*T(i)^2)/2+(a4*T(i)^3)/3+(a5*T(i)^4)/4+a7)*R;

else
     CP(i)=(a8+a9*T(i)+a10*T(i)^2+a11*T(i)^3+a12*T(i)^4)*R;
     H(i)=(a8+(a9*(T(i)))/2+(a10*(T(i))^2)/3+(a11*(T(i))^3)/4+((a12*(T(i))^4)/5)+(a13/(T(i))))*R*(T(i));
     S(i) =(a8*log(T(i))+a9*T(i)+(a10*T(i)^2)/2+(a11*T(i)^3)/3+(a12*T(i)^4)/4+a14)*R;

end
 end
 %creating the plot
    figure(1)
    plot(T,CP ,'linewidth',3,'color','r')

   xlabel('(T)temperature')
   ylabel('CP(specific heat)')
   title(species_name)
   grid on

   figure(2)
   plot(T,H ,'linewidth',3,'color','c')

   xlabel('(T)temperature')
   ylabel('H(enthalpy)')
   title(species_name)
   grid on

   figure(3)
   plot(T,S ,'linewidth',3,'color','y')

  xlabel('(T)temperature')
  ylabel('S(entropy)')
  title(species_name)
  grid on
 %creating the folder and saving the plot as image in separate folder
  mkdir(['F:nasa',species_name])
  cd(['F:nasa',species_name])
  saveas(1,'t vs cp.jpg')
  saveas(2,'t vs h.jpg')
  saveas(3,'t vs s.jpg')

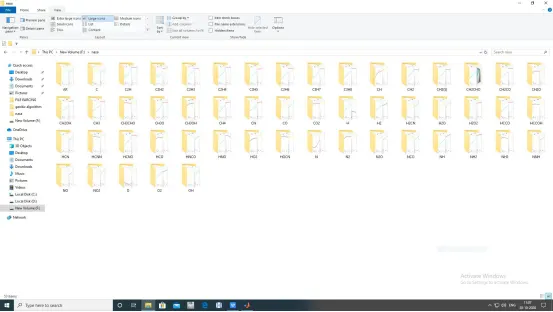
  D=['H','C','N','O','A'];
  aw=[1,12,14,16,40];
  M=0;

for i=1:length(species_name)
 for j=1:length(aw);
 if strcmp(species_name(i),D(j));
    M=M+aw(j);
         x=j;
 end
 end
    n=str2double(species_name(i));
 if n>1
    M=M+(aw(x)*(n-1));
 end
end
   fprintf('molmass %s = %fn',species_name,M)
end
Steps to write a code :-
Step1:-Firstly We Define a Function(f1) And Open The File(Thermo) By Using Fopen Command.After This Use Fgetl Command To Read The File Lines.
Now Use While Loop And Compare The A(Variable) With The ‘End’ By Using The Strcmp And After This Get The Value Of Number_Of_Species By Skipping The 6 Line.
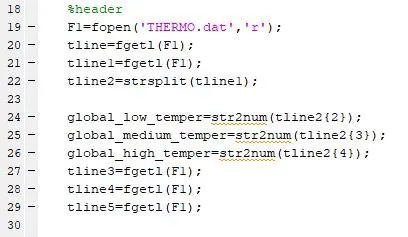
Step2:- Open The File And Split The String By Using Strsplit Command.And Convert The String Into Number By Strnum Command And We Separate The Value Of Global_Low_Temperature, Global_Medium_Temperature& Global_High_Temperature.
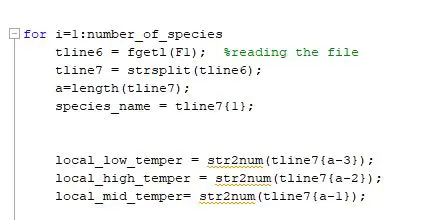
Step 3:- Now Using The For Loop And The No. Of Cycle Of Loop Is Depends Upon The Number_Of_Species. And Inside The Loop Call The Data And Store The Species Value In The Variable Species_Name .
After That Taking The Value Of Local Temperature From The Left Side So ,That Equal Gapes Is Maintain.And Code Become Generic.
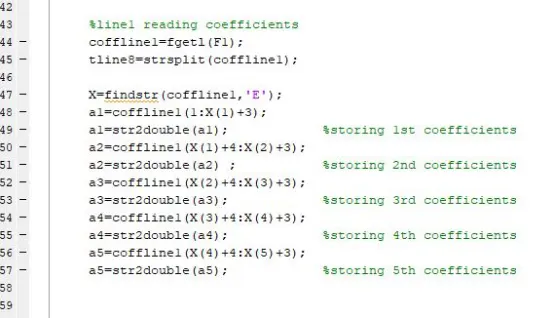
Step 4:- Now Separating The Coefficient From The Given Thermo Data. To Get The Coefficient Takes The Referance And Find a Value Whose Position Is Fix And Common In All Lines As ‘E’.
And Separating The Coefficient Which Is a1,a2,a3,a4,a5.
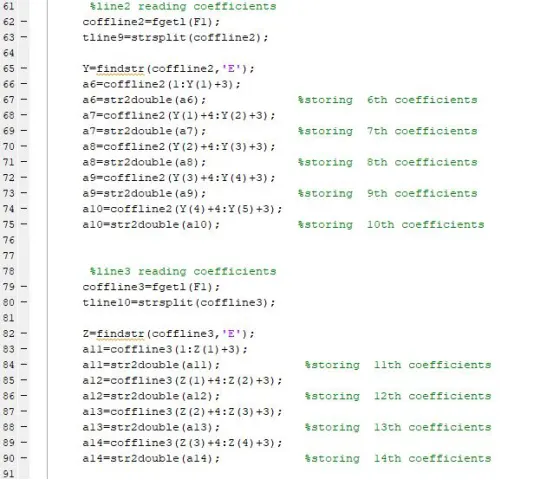
Step 5:- Similarly Line1,Calculate The Coefficient Of Remaining Line 2 & Line 3 Which Is a6,a7,a8,a9,a10,a11,a12,a13,a14
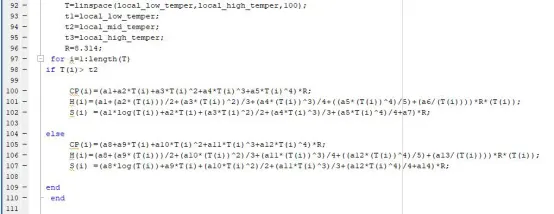
Step 6:-Now Calculating The Value Of Specific_Heat(Cp),Enthalpy(H),Entropy(s) By Using The Given Formula,Where R Is 8.314 Which Is Universal Gas Constant.And T Is Local Temperature Value.
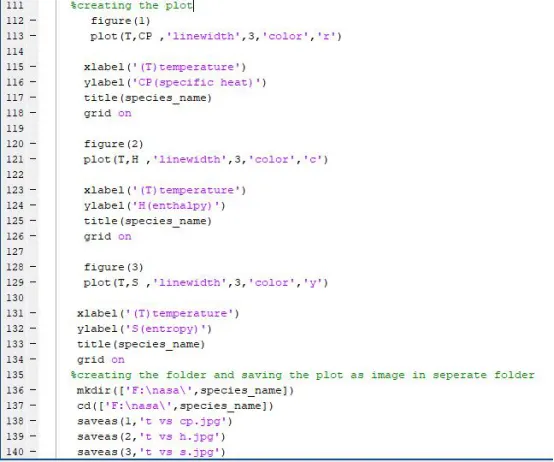
Step 7:-Creating Plot And Saving The Plot As Image In Separate Folder.By Using Mkdir(Make The Folder) & Change The Directory By Cd (Change Directory) Command.
Step 8:-Calculating The Molecular Weight And Showing In The Command Window.
- For Calculating The Molecular Weight Take The Value Of Atomic Weight Of (H,C,N,O,A) And Store It In To a Function D & Aw .
- Now Use For Loop And The Length Range Is Depends Upon The Species_Name .
- Again Use The For Loop And The Length Range Is Depends Upon The Aw.
- Now Compare The Value Of Species_Name(1) With D(j).And Applying The If Condition.After Compersion If Both The Value Is Satisfied Then It Stored In M Variable
If Any Value Store The Number Then This Value Is Stored In X Variable .Now ,The X Is Evaluating With The M=M+(Aw(x)*(n-1)) And We Get The Molecular_Weight Of Each Species Which Is Stored In The M Variable.
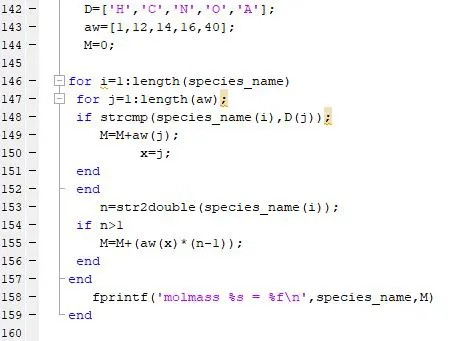
Picture of all the species and stored in a separated folder are shown below:-
Plots for O2
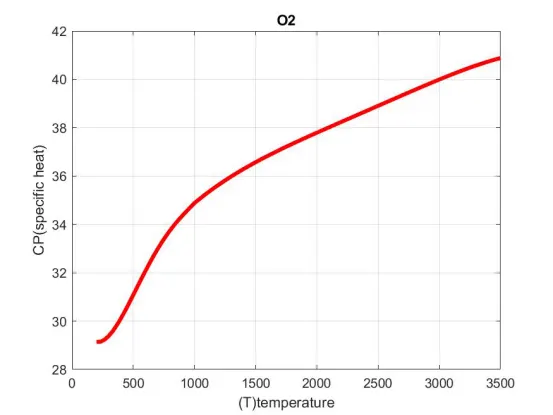
Fig1.Temperature(T) vs cp(specific heat)
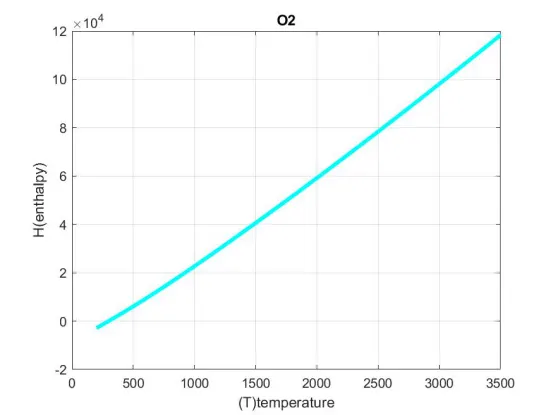
Fig2.Temperature(T) vs H(enthalpy)
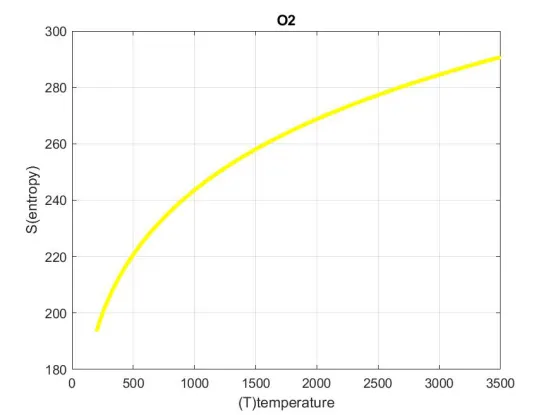
Fig3.Temperature(T) vs S(entropy)
Plots for N2
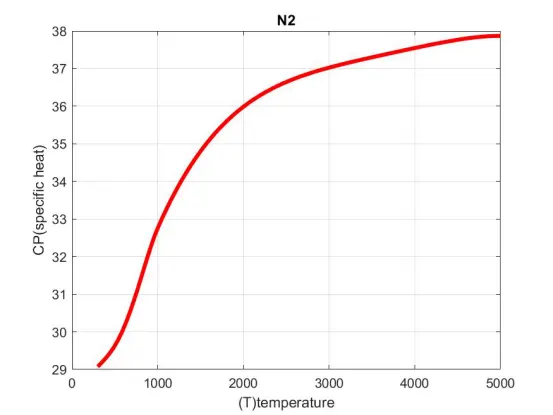
Fig4.Temperature(T) vs Cp(specific heat)
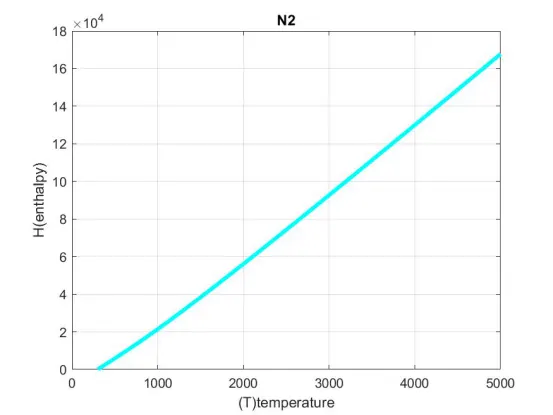
Fig5.Temperature(T) vs S(enthalpy)
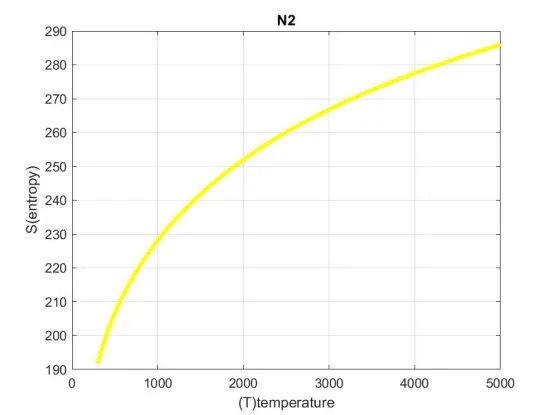
Fig6.Temperature(T) vs S(entropy)
Plots for CO2
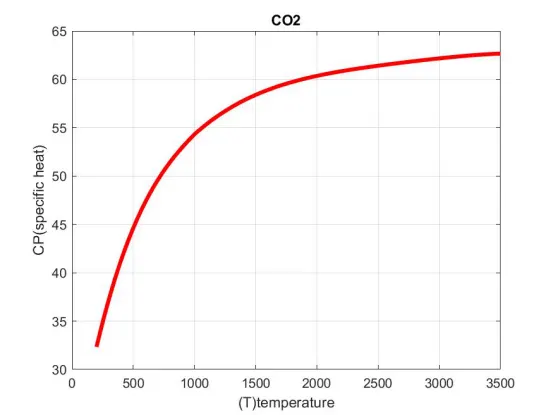
Fig7.Temperature(T) vs Cp(specific heat)
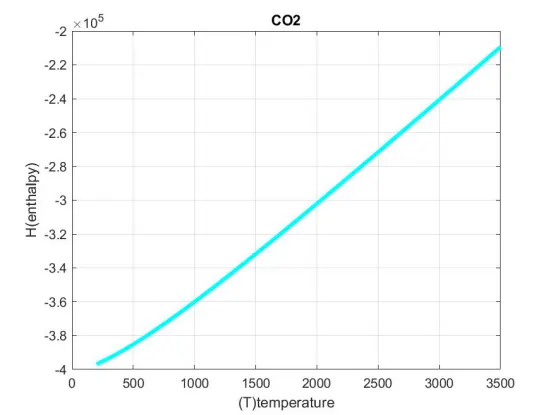
Fig8.Temperature(T) vs S(enthalpy)
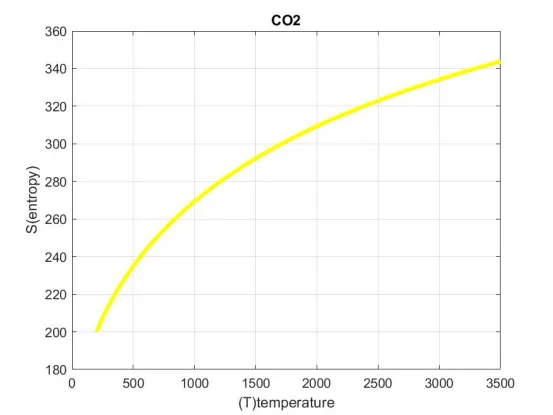
Fig9.Temperature(T) vs S(entropy)