Parsing NASA thermodynamic data
Aim:
- To read the provided NASA thermodynamic data and to extract the coefficients for the required gas species.
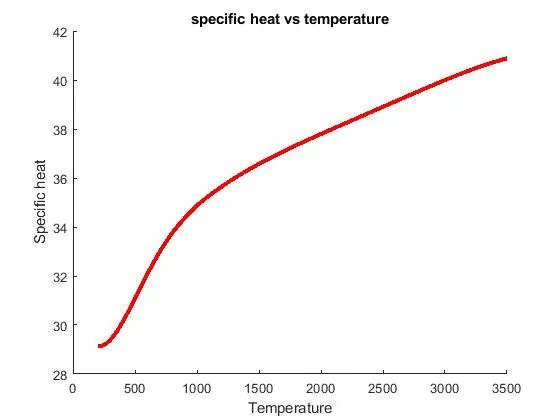
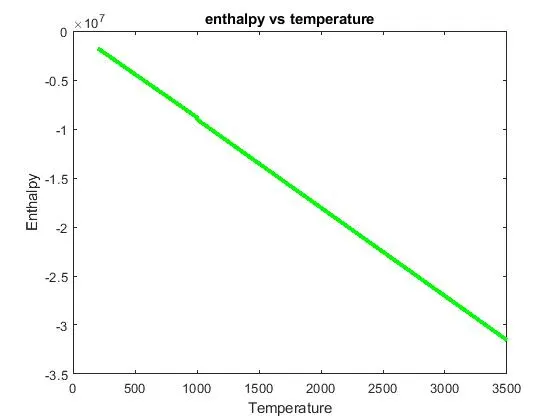
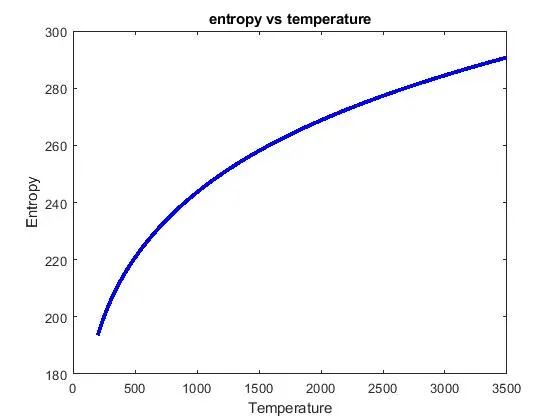
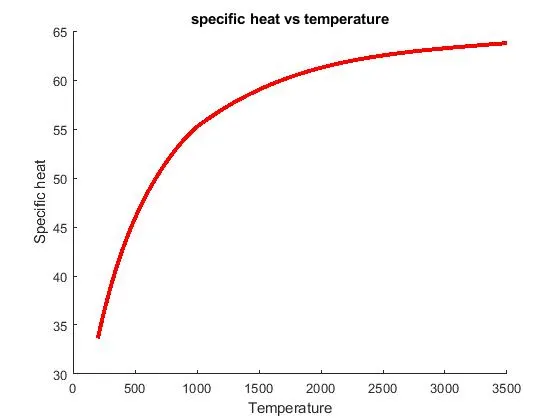
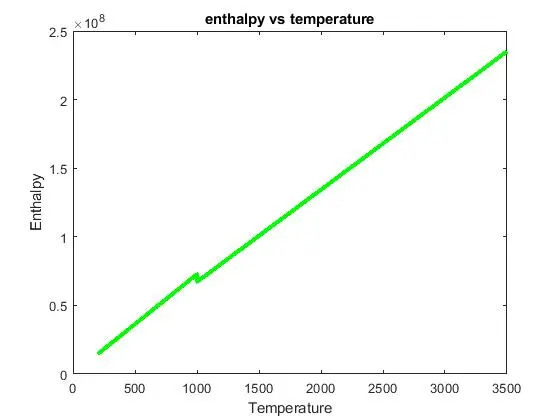
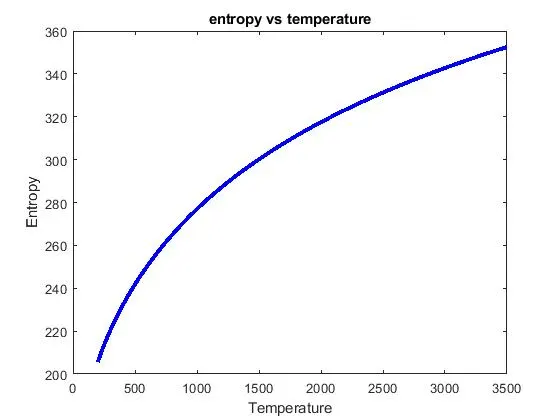
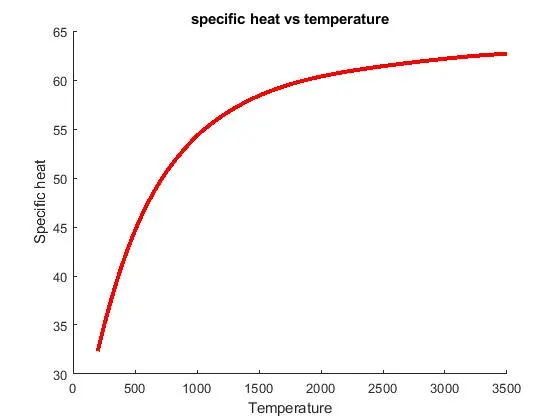
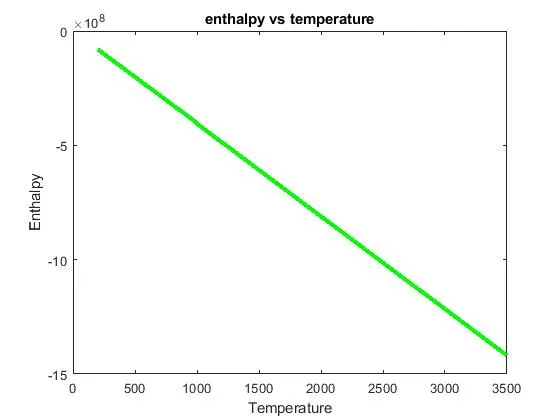
- To calculate the specific heat, enthalpy, entropy and molecular mass of the required gas species and to plot a curve for specific heat, enthalpy and entropy against temperature.
Objectives:
- Parse the provided data file into MatLab and to read the data.
- Select and locate the required species in the given data and to obtain the coefficients of the selected gas species.
- Calculate the specific heat, enthalpy, entropy and molecular weight of the required gas species.
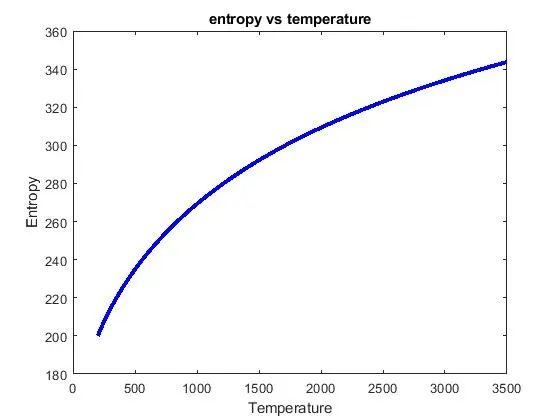
- Plot graph for specific heat vs temperature, enthalpy vs temperature and entropy vs temperature.
Formula used:

Where,
- Cp is the specific heat of the required species
- H is the enthalpy of the required species
- S refers to the entropy of the required species
- T is the temperature
- R is the universal gas constant 8.314 `J.K^-1.mol^-1`
- a1-a7 are the coefficients of the required species
Explanation about the data:
NASA thermodynamic data contains a set of coefficients using which, the properties of the required gas species can be found out. It provides 14 coefficients for both low and high-temperature ranges along with its local and global temperature range. It also describes every species at the beginning of a set of data. It also contains mid-temperature. There are 53 different species present in the data file.
Code:
Calculation function:
function [results] = calculation(t)
d = 1;
R = 8.3144;

for c = 200:1000 %calculation for low temp range
cp = (t(8) + t(9)*c + t(10)*c^2 + t(11)*c^3 + t(12)*c^4)*R;
H = (t(8) + t(9)*c/2 + t(10)*c^2/3 + t(11)*c^3/4 + t(12)*c^4/5 + t(13))*R*c;
S = (t(8)*log(c) + t(9)*c + t(10)*c^2/2 + t(11)*c^3/3 + t(12)*c^4/4 + t(14))*R;
%as we know that the coeff 8-14 is for low temp range,they were assigned

%assigning the array of values to the results array
results(d,1) = cp;
results(d,2) = H;
results(d,3) = S;
d = d+1;
end

for b = 1001:3500 %calculation for high temperature range
cph = (t(1) + (t(2)*b) + (t(3)*b^2) + (t(4)*b^3) + (t(5)*b^4))*R;
Hh = (t(1) + (t(2)*(b/2)) + (t(3)*((b^2)/3)) + (t(4)*((b^3)/4)) + (t(5)*((b^4)/5)) + t(6))*R*b;
Sh = ((t(1)*log(b)) + (t(2)*b) + (t(3)*((b^2)/2)) + (t(4)*((b^3)/3)) + (t(5)*((b^4)/4)) + t(7))*R;

results(d,1) = cph;
results(d,2) = Hh;
results(d,3) = Sh;
d = d+1;
end
Here, the function gets the array of data from the main program (i.e the coefficients of the selected species) and the low-temperature coefficients are used to calculate the properties of gases from low temperature to mid-temperature while the high-temperature coefficients are used to calculate the properties at high-temperature ranges. The obtained array of data are assigned to the results array which is sent back to the main program.
Molecular weight calculation function:
function weight = molwei(ginput,lengthl)
stype = upper(ginput);
constituents = {'H','C','N','O','A'};
at_weight = [1 12 14 16 40];

weight = 0;
for b = 1:lengthl
    for c = 1:length(constituents)
        if strcmp(stype(b),constituents(c))
            weight = weight + at_weight(c);
            u = c;
        end
    end
    n = str2double(stype(b));
    if n>1
        weight = weight + at_weight(u)*(n-1);
    end
end
fprintf('molecular weight of %s: ',ginput)
fprintf('%d',weight)
fprintf(' amu')
fprintf('n')
end
Here, in this function, the required gas species and its length are given as input and initially, the molecular weight is considered as 0. A character array and an integer array are made to assign atomic mass of the individual species. The constituents are compared with the required input gas species and the weights are added. The Numeric part is converted into a scalar number and if it has more than one (for example N2), the number is assigned to the variable and based on the value, weights are added and the resultant variable I.e weight is returned to the main function.
Main Function:
clear all;
close all;
clc;
gc = 1;
temperature = linspace(200,3500,3301); %Local temperature range
f1 = fopen('THERMO.dat','r') %opens NASA data
fgetl(f1); %Gets the Header line
temp_line = fgetl(f1); %Gets the global temperature line
A = strsplit(temp_line,' ');  %to separate the character array into smapper parts
glob_low_temp = str2num(A{2}); %Assigns the temperature after converting it to number
glob_mid_temp = str2num(A{3});
glob_high_temp = str2num(A{4});

for i = 1:3
fgetl(f1); %gets the comment line
end
j = 1;
k = 1;

ginput = input('enter the species: ','s'); %user provides the required gas species
lengthl = strlength(ginput);  %Assigns the length of the input species to lengthl
condition = 0;   %initial condition for main while loop

while condition~=1      %MAIN WHILE LOOP
tm_line = fgetl(f1);  %Gets the description line
co = strcmpi(tm_line(1:lengthl),ginput); %compares the input with the data in that line

if co==1   %if the boolean is 1, calc and assignments are performed
while (j<=3) %3 lines that has the 14 coefficients
    t_line = fgetl(f1);
    a = strfind(t_line,'E');
    for m = 1:length(a)
        if m==1
            tempd = t_line(1:a(1)+3);  %for the first coefficient in each line
        else
            tempd = t_line(a(m-1)+4:a(m)+3);
        end

        t(k) = str2double(tempd); %converts to num and assigns to the array t
        m = m+1;
        k = k+1;
    end
    j = j+1;
end

%calculating results and molecular weight
[results] = calculation(t);
weight = molwei(ginput,lengthl);

%plotting
hold on
figure(1)
plot(temperature,results(:,1),'linewidth',3,'color','r')
title('specific heat vs temperature')
xlabel('Temperature')
ylabel('Specific heat')
figure(2)
plot(temperature,results(:,2),'linewidth',3,'color','g')
title('enthalpy vs temperature')
xlabel('Temperature')
ylabel('Enthalpy')
figure(3)
plot(temperature,results(:,3),'linewidth',3,'color','b')
title('entropy vs temperature')
xlabel('Temperature')
ylabel('Entropy')

else
    disp('Species is not present in this set') %moves to the next set of data
    for i = 1:3
        fgetl(f1);
    end
end
condition = co; % new condition is provided based on the string comparison
end
The main program reads the file and assigned to another variable. The initial lines assign the global temperature values to the required variables and the comment lined are excluded. Then the required species are given as input and it compares with the line at which the pointer is currently located. If the condition is satisfied, the coefficients are allocated to the array variable t from the set of data. If the condition is not satisfied, it moves the pointer to the next set of data by skipping the lines using the else part and the condition is returned to the while loop. While loop is repeated till the required species is found in the data file and the calculation, plots are performed.
Errors obtained during file parsing and programming:
- String comparison between the input and character in the data file
- Looping the conditions to move the pointer to the next set of data if the condition is not satisfied
- Function definition and arguments that had size lesser than the code part
- Plot curve errors
Solving the errors:
We know that every species has different string length, so a variable is assigned to length of the input string for comparison. If-else and while loop with the initial condition is provided to solve the problem. While loop is performed till the condition is satisfied. Required variables are provided to the arguments and function is saved with the exact provided name. Due to error in calculation, plot errors were obtained.
Results:
OXYGEN:
DINITROGEN:
CARBON DIOXIDE:
Links:
https://drive.google.com/file/d/1eT1ShDK23bGHuD5qABBG04RQyzpCCa9Y/view?usp=sharing
https://drive.google.com/file/d/1Ibw42RtnZ31_3AENTl9cQ9ZWPf0ZRZUt/view?usp=sharing
https://drive.google.com/file/d/1vfAyA1AAbBU6nyLOfV6Rhq6R2KA5_M9a/view?usp=sharing
https://drive.google.com/file/d/1f1yk5s5ZWxR_ZxTn8wL3yHNS9qL32ut5/view?usp=sharing
https://drive.google.com/file/d/1ZBC6KJo1DjzH6EQH36f_k5XnK9rXVx2y/view?usp=sharing
https://drive.google.com/file/d/13hnUV7l6Pa4e_OGS7F4YfO1Tof8Y819Q/view?usp=sharing
References: