Project 1 - Parsing NASA thermodynamic data
File parsing program using MATLAB
Aim
To write a program for parsing the given file and its data and to find the required parameters.
File parsing
Parsing in computer languages refers to the syntactic analysis of the input code into its components parts in order to facilitate the writing of compilers and interpreters. It can be used to describe split or separation.
Parsing a file means reading in a data stream of some sort and building an in-memory model of the semantic content of that data. This aims at facilitating performing some kind of transformation on the data.
Function program
A function code is created to be later called into the main code.
The function code is written to calculate the values of Enthalpy, Specific heat, and Entropy using the 14 coefficients of each species in the data file.
NASA came up with polynomials to calculate these values and coefficients for each element.
The coefficients are obtained using the code in the main program and the polynomials to calculate H, Cp and S were entered as a function code.
- A for loop is created to iterate the values of the temperature range which ranges from local low temperature to local high temperature.
- The if condition is used to utilize the high-temperature coefficients when the temperature is greater than the local mid-temperature and to make use of the low-temperature coefficients when it is lesser.
- The inputs for the function code include temperature range, universal gas constant (R), the local mid-temperature and the high and low temperature coefficients obtained from the data file.
%function code for calculating enthalpy(S), entropy(H), and specific heat(Cp)
%for each species in the data

function [S,H,Cp] = thermo_func(T,R,hc1,hc2,hc3,hc4,hc5,hc6,hc7,lc1,lc2,lc3,lc4,lc5,lc6,lc7,temp_mid)

for i = 1:length(T)

if T(i) > temp_mid
%When the temperature is greater than the local mid-temperature the high-temperature coefficients are used in the polynomials.
S(i) = (hc1*log(T(i)) + hc2*T(i) + hc3*T(i)^2/2 + hc4*T(i)^3/3 + hc5*T(i)^4/4 + hc7)*R;
H(i) = (hc1 + hc2*T(i)/2 + hc3*T(i)^2/3 + hc4*T(i)^3/4 + hc5*T(i)^4/5 +hc6/T(i))*R*T(i);
Cp(i) = (hc1 + hc2*T(i) + hc3*T(i)^2 + hc4*T(i)^3 + hc5*T(i)^4)*R;

else %low temperature coefficients use these set of polynomials
S(i) = (lc1*log(T(i)) + lc2*T(i) + lc3*T(i)^2/2 + lc4*T(i)^3/3 + lc5*T(i)^4/4 + lc7)*R;
H(i) = (lc1 + lc2*T(i)/2 + lc3*T(i)^2/3 + lc4*T(i)^3/4 + lc5*T(i)^4/5 +lc6/T(i))*R*T(i);
Cp(i) = (lc1 + lc2*T(i) + lc3*T(i)^2 + lc4*T(i)^3 + lc5*T(i)^4)*R;

end

end
The computed values are then plotted to visualize the curves.
Main Code
The main code contains the following;
- File parsing code.
- Code to call in the function which calculates H, S and Cp.
- The program to compute molecular weight of the elements.
- Program to plot the results on separate graphs and to store these graphs in separate folders.
The code begins with the fopen command followed by the name of the .dat file and 'r'.(permission to read)
fgetl command is used to obtain one line at a time from the data file. The useful information is obtained and the unnecessary comments are ignored.
str2num command is used wherever a string has to be converted into a number.
while true command is used. This command is like an infinite loop and it is ended using an if condition.
strtok command is used to obtain the first value of a line (the name of the species in this case)
A common pattern is noticed in the coefficients of each element and this is used to our advantage while parsing the data.
The findstr command is used to locate the position of "E" in each line.
The characters preceding and succeeding "E" are entered in such a way that it gives us the separate coefficients in a string. str2num or str2double can be used to convert the string to a number.
The function code is then called in after programming the code for its necessary inputs. The values of S, H, Cp can be obtained.
In order to find the molecular weight of each species a nested for loop is being used. Each element of a species enters in first and is compared with the element array which consists of the elements that make up the entire list of species.
strcmpi compares the atoms and if it is true goes ahead and computes the molecular weight for that element alone.
Another if command is used to calculate the molecular weight when there is more than one atom present.
This loop goes on until the molecular weight for that particular species is computed.
The result is printed out using the sprintf command.
The plots for T vs H, T vs Cp, T vs S are coded in and the appropriate titles are given.
These plots are then saved into a new directory using the mkdir and cd commands.
saveas syntax is used to save the three separate figures in separate folders for each species.
This way we have access to the plots for each individual species.
The cd command is used again to run the loop for the next species in the Matlab directory.
clear all
close all
clc

tic
%Opening the .dat file and reading its contents
A = fopen('THERMO.dat','r');

%Document Header
file_header = fgetl(A);

%Sub-Header containing the global temperatures
t = str2num(fgetl(A));
global_lt = t(1);  %Global low temperature
global_mt = t(2);  %Global mid temperature
global_ht = t(3);  %Global high temperature

%Lines 3-5 containing comments -  to be ignored
for i = 1:3
fgetl(A);
end

%Input parameters
R = 8.314; % Universal gas constant in J/Kmol

%Loop which obtains the species, local temperatures and coefficients.

while true

line1 = fgetl(A);
line2 = fgetl(A);
line3 = fgetl(A);
line4 = fgetl(A);

if line1 == "END"
    break
end    %break the while loop when line1 reaches "END"

%Name of the species
species = strtok(line1); %Gives the name of the element/species

%Local temperatures for each element
line1 = strsplit(line1,' ');
temp_mid = str2double(line1{end-1}); %Local mid temperature
temp_high= str2double(line1{end-2}); %Local high temperature
temp_low = str2double(line1{end-3}); %Local low temperature
T = linspace(temp_low,temp_high,50); %Temperature range

%Locating the Coefficients for specific species using 'E'
q = findstr(line2,'E');
r = findstr(line3,'E');
s = findstr(line4,'E');

%High temperature coefficients
hc1 = str2double(line2(1:q(1)+3));
hc2 = str2double(line2(q(1)+4:q(2)+3));
hc3 = str2double(line2(q(2)+4:q(3)+3));
hc4 = str2double(line2(q(3)+4:q(4)+3));
hc5 = str2double(line2(q(4)+4:q(5)+3));
hc6 = str2double(line3(1:r(1)+3));
hc7 = str2double(line3(r(1)+4:r(2)+3));

%Low temperature coefficients
lc1 = str2double(line3(r(2)+4:r(3)+3));
lc2 = str2double(line3(r(3)+4:r(4)+3));
lc3 = str2double(line3(r(4)+4:r(5)+3));
lc4 = str2double(line4(1:s(1)+3));
lc5 = str2double(line4(s(1)+4:s(2)+3));
lc6 = str2double(line4(s(2)+4:s(3)+3));
lc7 = str2double(line4(s(3)+4:s(4)+3));

%function to determine S,Cp,H
[S,H,Cp] = thermo_func(T,R,hc1,hc2,hc3,hc4,hc5,hc6,hc7,lc1,lc2,lc3,lc4,lc5,lc6,lc7,temp_mid);

%Molecular weights of the species
E = ['C' 'H' 'O' 'N' 'A' 'S' ]; %elements constituting the species in the data file
Mm_E = [12 1 16 14 40 32]; %molecular masses for C, H, O, N, Ar and S
mm = 0; %initial molecular mass

for i = 1:length(species);
    for j =1:length(E);

        if strcmpi(species(i),E(j));
            mm  = mm + Mm_E(j);
            position = j;
    end
    end
        n = str2num(species(i));
        if n>1
           mm = mm + Mm_E(position)*(n-1);
        end
end

Result=sprintf('molecular weight of %s is %d',species,mm)

%Plots of resulting values
figure(1)
plot(T,S,'linewidth',2,'color','r')
xlabel('Temperature')
ylabel('Entropy')
title(sprintf('Temperature vs entropy of %s',species))
grid on

figure(2)
plot(T,Cp,'linewidth',2,'color','b')
xlabel('Temperature')
ylabel('Specific heat')
title(sprintf('Temperature vs Specific Heat of %s',species))
grid on

figure(3)
plot(T,H,'linewidth',3,'color','r')
xlabel('Temperature')
ylabel('Enthalpy')
title(sprintf('Temperature vs Enthalpy of %s',species))
grid on

%Saving the resulting graphs of each species in separate folders
mkdir('C:\Users\Student-51\Desktop\JB_Matlab_temp\File_parsing_project\',species)
cd(['C:\Users\Student-51\Desktop\JB_Matlab_temp\File_parsing_project\',species])
saveas(1,'Entropy.png')
saveas(2,'Specific_heat.png')
saveas(3,'Enthalpy.png')
cd('C:\Users\Student-51\Desktop\JB_Matlab_temp')

end
time_taken = toc
The while true loop greatly reduces the number of lines of code while also making the program generic and adaptable to a new collection of data having a similar format.
Using an if condition within a nested for loop to calculate the molecular weight is also an efficient method of coding this particular problem.
Results
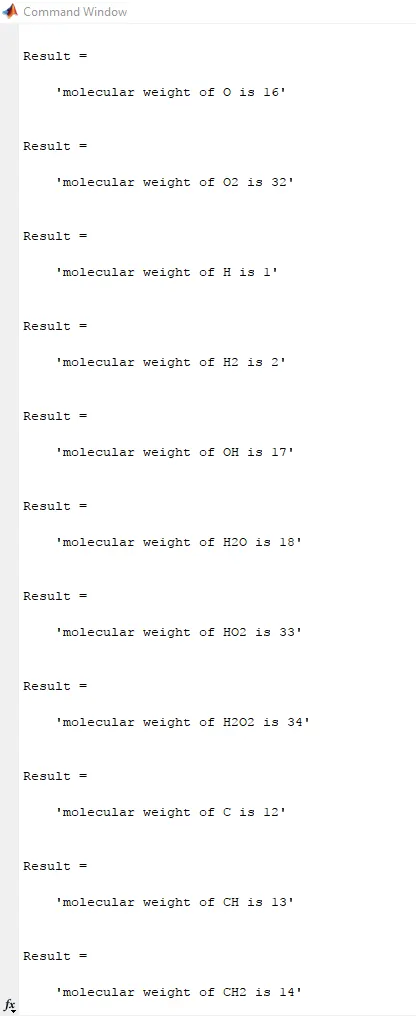
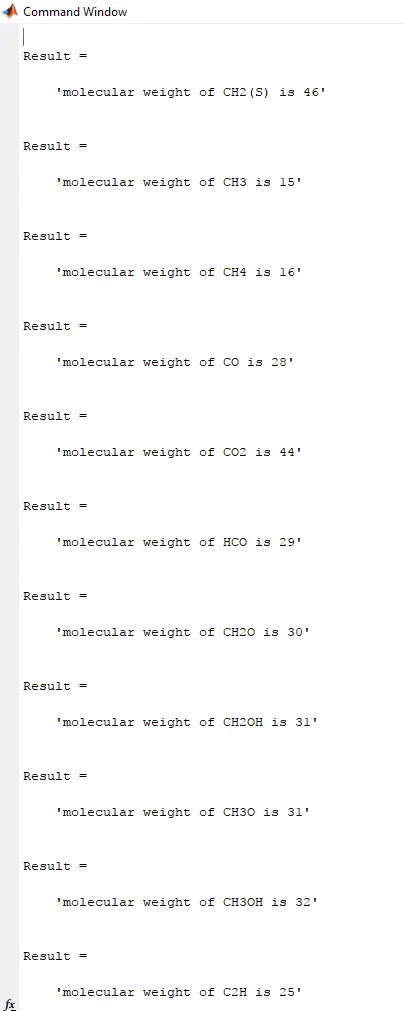
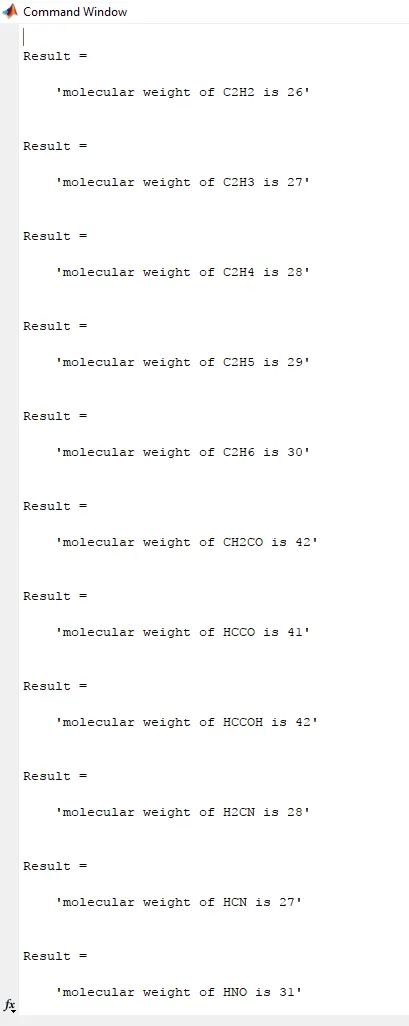
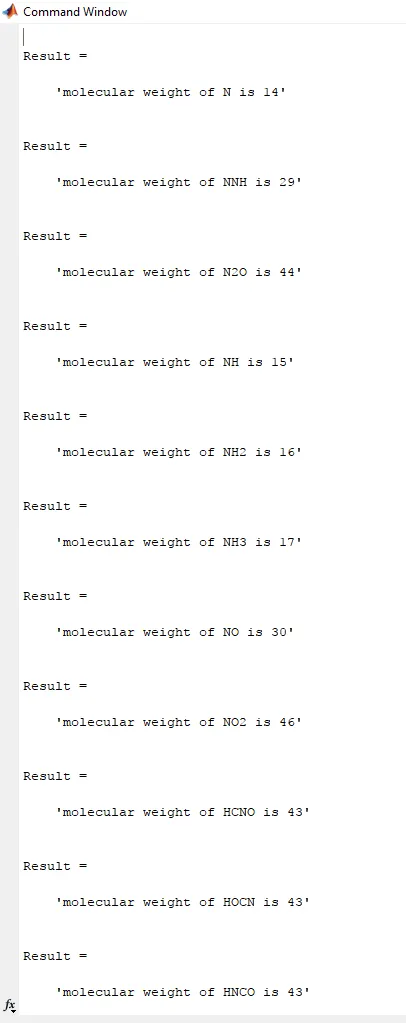
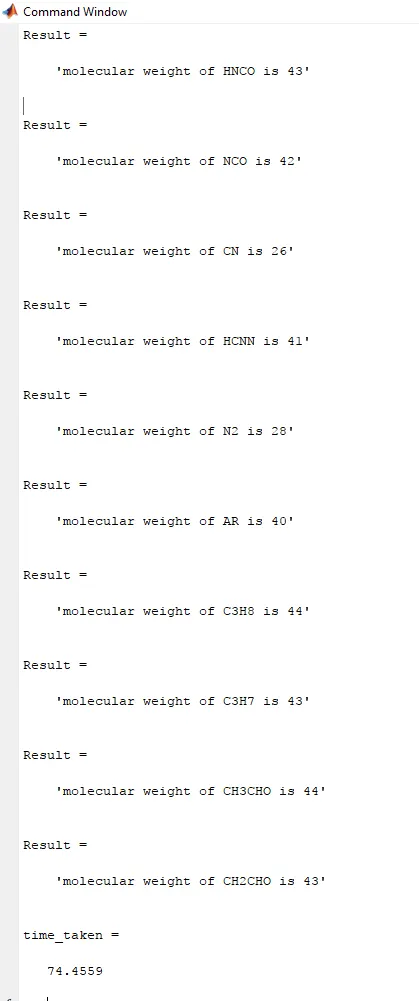
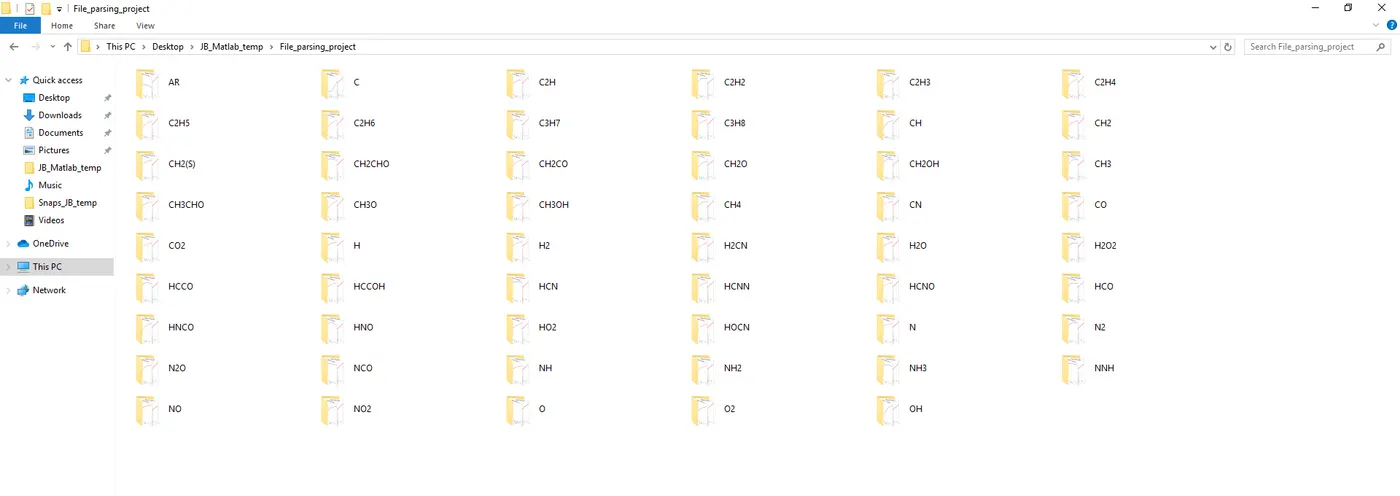
Screenshot of the window containing all the files
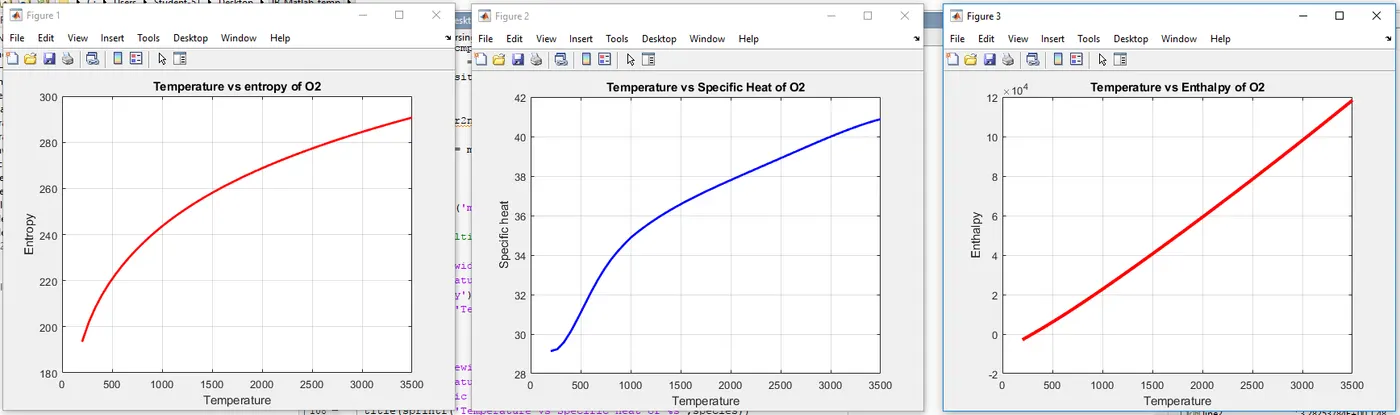
Plots for `O_2`
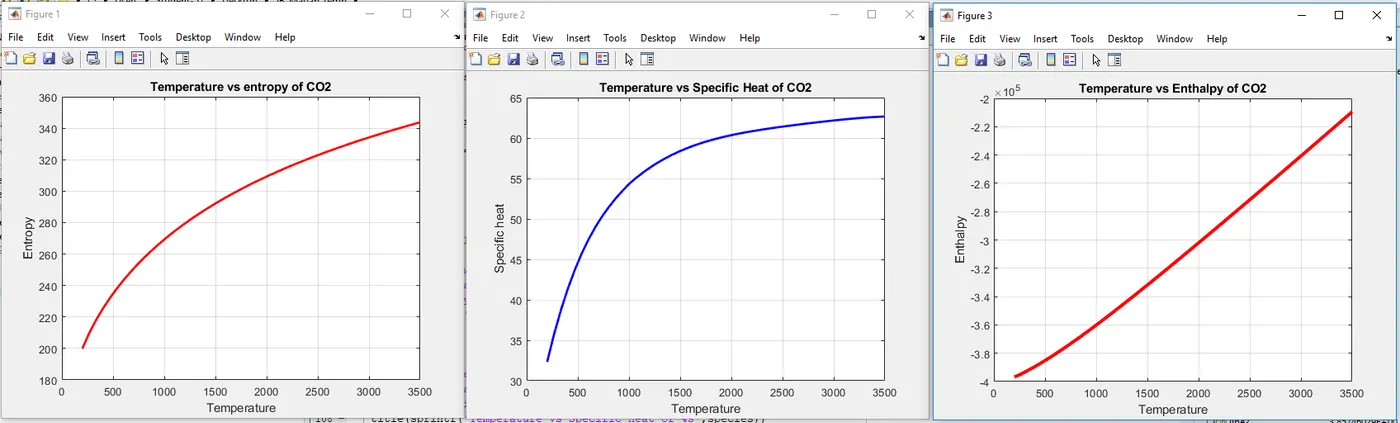
Plots for `CO_2`
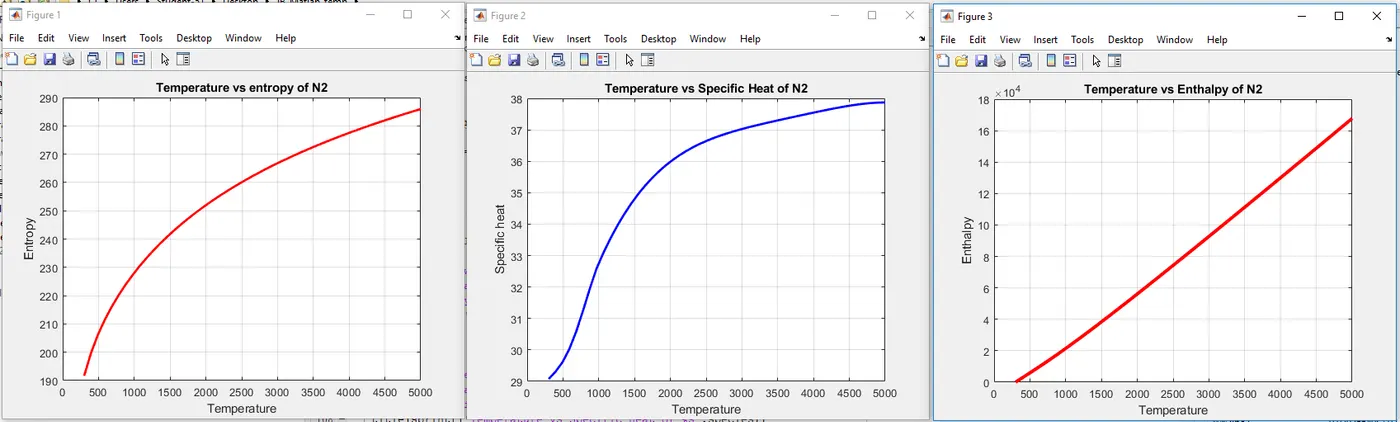
Plots for `N_2`
Conclusion
- The program for parsing the data from the given data file and using it to obtain useful outputs for user-specified inputs has been coded and well optimized.
- The results for molecular weight can be obtained from the command window and plots for T vs H, T vs Cp, T vs S are sent to separate folders. These processes are automatically carried out by the program.