Project 1 - Parsing NASA thermodynamic data
Aim : To extract the low temperature and high temperature co-efficients for given no. of species and and calculate CP,H,S using the formula and plot the graph of CP,H,S vs Temperature for all the species and to store them in separate folder with species names as folder name.
Formula

where a1-a7 are the high temperature co-efficients and a8 - a14 are low temperature co-efficients.
R - universal gas constant in Jk^-1mol-^1.
Cp is specific heat in KJ/KgK
H is enthalpy in J
S is entropy in J/K
All in SI units.
Logic:
1.Extract global temperatures.
2. Skip the comment lines.
3. Then extract species name and local temperatures of that species.
4. create a for loop to extract 14 co-efficients of the species.
5. Create a function to calculate CP,H,S values for high and low temperature and plot the graph of the same.
6. Create another function to calculate the molecular weight of the species.
7.Give user input inorder to find the find the molecular weight of the interested species and also to show the Ch,H,S vs temperature plots of that species.
Main Script:
close all
clear all
clc
% Input from the user
prompt1 =  'Enter the first element (1/3):  ';
prompt2 =  'Enter the second element (2/3):  ';
prompt3 =  'Enter the third element (3/3):  ';
x1 = input(prompt1, 's');
x2 = input(prompt2, 's');
x3 = input(prompt3, 's');
%load the THERMO data file to matlab
f1 = fopen('THERMO.dat','r');


fgetl(f1); %<-- fgetl command is used to read the heading of the data file
A = fscanf(f1,'%f',[1,3]); %<-- fscanf is used to read the global temperatures of the species.

% Storing the global temperature values in different variables.
global_low_temp = A(1);
global_mid_temp = A(2);
global_high_temp = A(3);

%for loop is used to skip comment lines in the data.
for ii=1:4

    fgetl(f1);

end

% mkdir is used to create a separate folder for file parsing project to
% store all the plots of the species.
mkdir Parsing;

%For loop is created to extract the 14 co-efficients and to calculate the
%Cp,H,S values for low,mid and high temperatures for all the species.

for i = 1:53

    %fgetl is in line 6
    l6 = fgetl(f1);
    %strsplit command is used to split between spaces inorder to extract
    %species name and local temperatures of them.
    l6= strsplit(l6,' ');

    Element(i) = l6(1);  %<--Element stores the species name.
    t_mid = str2num(l6{end-1});
    t_min = str2num(l6{end-3});
    t_max = str2num(l6{end-2});

    j=1;%<-- incremental value to store co-efficients of the species.

    for k=1:3

        %b reads the first line co-efficients of the species and for loop
        %is created to continue to read all 14 coefficients for particular
        %species and store them.
        b = fgetl(f1);

        %strfind helps to locate the position of E which helps store the
        %values of co-efficients.
        B = strfind (b,'E');
        a(j) = str2num(b(1:B(1)+3));
        a(1+j)= str2num(b(B(1)+4:B(2)+3));
        a(2+j)= str2num(b(B(2)+4:B(3)+3));
        a(3+j)= str2num(b(B(3)+4:B(4)+3));

       %Since the third line of the co-efficient line has only 4
       %co-efficients this if else statement is used to break the for loop
       %when it comes to the third line.
        if (length(B)==4)
            break
        end

        % This line extracts fifth co-efficients of all the species.
         a(4+j)= str2num(b(B(4)+4:B(5)+3));
         j=j+5;

    end

    %Universal gas constant.
    R = 8.314;

    %Call for the function to calculate the CP,H,S values for the species.
   [CP,H,S,T] = cal_thermo(a,t_min,t_max,t_mid,R);

%    Plotting CP,H,S for different temperature values.
    fig=figure(i);
    subplot (3,1,1)
    plot (T, CP)
    title ('Plot for Species',Element(i))
    xlabel('temperature K')
    ylabel('Specific Heat in KJ/KgK')
    subplot (3,1,2)
    plot (T,H)
    xlabel('temperature in K')
    ylabel('enthalpy KJ/Kg')
    subplot(3,1,3)
    plot (T,S)
    xlabel('temperature in K')
    ylabel('entropy J.K^-1.Kg^-1')

    %Storing of species name is variable name inorder to calculate the
    %molecular weigth of that species.
    name = Element(i);

    %Call for the function to calculate the molecular weight.
    [molecular_weight] = molecular_wt(name);
    weight = molecular_weight;
    %table is created to display species name and molecular weight.
    tab = table(name,weight)

    %the code is directed to parsing folder inorder to save the plots for
    %different species in their respective folder.
    cd Parsing; %<-- helps in changing the directory to parsing folder
    mkdir (Element{i}); %<-- Creates the folder with the Species name.
    %directs the code to folder created in species name to save the plots
    %created for the particular species.
    cd (Element{i});
    % saveas command saves the plot in the specific folder.
    saveas (i,Element{i},'jpg')
    cd ../..%<-- This command returns directory to the intial folder since different folders are created for different species.

    %This command is used to convert cell array into character array.
    y = cell2mat(name);

    %if else statement is used to compare the userinput and display the plots for the user input species and close other plots.
    if  (strcmpi(x1,y)||strcmpi(x2,y)||strcmpi(x3,y))


    else
        close (fig);
    end

end
This inputs prompts the user to input the interested species.
prompt1 = 'Enter the first element (1/3): ';
prompt2 = 'Enter the second element (2/3): ';
prompt3 = 'Enter the third element (3/3): ';
x1 = input(prompt1, 's');
x2 = input(prompt2, 's');
x3 = input(prompt3, 's');
THERMO Data file is loaded into the matlab using fopen command.
fgetl command is used to read the global temperature and fscanf is used to store the temperature values in array A
fgetl(f1);
A = fscanf(f1,'%f',[1,3]);
Then with the help of this array
global low,mid and high temperature are stored in the specific variables
global_low_temp = A(1);
global_mid_temp = A(2);
global_high_temp = A(3);
Since fgetl command reads line by line of the data file for loop is used to skip the 4 comment lines in data file.
for ii=1:4
fgetl(f1);
end
mkdir command is used to create a folder for parsing inorder to store the plots in species specific folder.
mkdir Parsing;
another for loop is created to extract all species name and 14 co-efficients for all the species in the data file.
The following commands are in the for loop running for 53 element species.
The Element(i) stores the species name.
Element(i) = l6(1);
str2num command is used since fgetl output is cell array and temperature values are numeric. {} is used to extract particular element in the cell array.
{end-1} is used since temperatures are placed at the end of the line it is easier to assign temperature values.
t_mid = str2num(l6{end-1});
t_min = str2num(l6{end-3});
t_max = str2num(l6{end-2});
After extracting local temperatures of the species another for loop is created to extract the 14 coefficients of the species.
The data had E for every co-efficient and strfind command is used to find the location of E and assigned it to matrix B
With location of E the co-efficients are assign to specific variables.
B = strfind (b,'E');
a(j) = str2num(b(1:B(1)+3));
a(1+j)= str2num(b(B(1)+4:B(2)+3));
a(2+j)= str2num(b(B(2)+4:B(3)+3));
a(3+j)= str2num(b(B(3)+4:B(4)+3));
Since the 3rd line of the co-efficients line has only 4 variables if else statement is created to find the current line has 5 co-efficients or not.
Since B contains position of E in the co-efficient line and the length of E of repesents the no.of co-efficients. If length of B is 4 then the for loop will break else it will assign the 5 co-efficient.
if (length(B)==4)
break
end
a(4+j)= str2num(b(B(4)+4:B(5)+3));
j=j+5;
Function is called to calculate CP,H,S.
[CP,H,S,T] = cal_thermo(a,t_min,t_max,t_mid,R);
Plotting is done between CP,H,S vs Temperature in the same figure using subplot.
Function is called for calculation of molecular weight and table is created displaying species name and molecular weight of that species.
[molecular_weight] = molecular_wt(name);
weight = molecular_weight;
tab = table(name,weight)
cd,mkdir and saveas command is used to create folder with species specific name and save plots of the CP,H,S vs Temperature to species folder.
cd Parsing;
mkdir (Element{i});
cd (Element{i});
saveas (i,'CP,H,S vs Temperature.jpg')
cd ../..
Since the plots to display are user specific if else statement is used. Logical OR and strcmpi is used to compare the species name of the user input and species name in the data. Here user input 3 species with which strcmpi compares with the species name in the data file. The use of logical OR is that if the user inputs three species name and one of them is not matching with the species in the data file it will still display the correct species entered.
if (strcmpi(x1,y)||strcmpi(x2,y)||strcmpi(x3,y))
else
close (fig);
Function to calculate CP,H,S
%fucntion to calculate the CP,H,S for the high,low temperature
%co-efficients.

function [CP,H,S,T] = cal_thermo(a,t_min,t_max,t_mid,R)


% tmin = t_min;
% tmax = t_max;
% t = linspace(t1,t2,500);
% tm = t_mid;


%Calculating CP,H,S for high temperature co-efficients.
t1 = linspace(t_mid,t_max,500);

    cp1 = (a(1)+a(2).*t1+a(3).*(t1.^2)+a(4).*(t1.^3)+a(5).*(t1.^4)).*R;

    h1 = (a(1)+(a(2).*t1)./2+ (a(3).*(t1.^2))./3 + (a(4).*(t1.^3))./4 + (a(5).*(t1.^4))./5 + a(6)./t1 ).*R.*t1;

    s1 = (a(1).*log(t1) + a(2).*t1 + a(3).*(t1.^2)./2 + (a(4).*(t1.^3))./3 + (a(5).*(t1.^4))./4 + a(7)).*R;

%Calculating CP,H,S for low temperature co-efficients.
    t2 = linspace(t_min,t_mid,500);

    cp2 = (a(8)+a(9).*t2+a(10).*(t2.^2)+a(11).*(t2.^3)+a(12).*(t2.^4)).*R;

    h2 = (a(8)+(a(9).*t2)./2+ (a(10).*(t2.^2))./3 + (a(11).*(t2.^3))./4 + (a(12).*(t2.^4))./5 + (a(13)./t2) ).*R.*t2;

    s2 = ((a(8).*log(t2)) + (a(9).*t2) + (a(10).*(t2.^2))./2 + (a(11).*(t2.^3))./3 + (a(12).*(t2.^4))./4 + a(14)).*R;

%creating a single array containing CP,H,S from low to high temperature co-efficients..
T = [t2 t1];
CP = [cp2 cp1];
H = [h2 h1];
S = [s2 s1];

end
Function to Calculate Molecular Weight.
%function to find the molecular weight of the species.
function [m_wt] = molecular_wt (name)

%cell2mate command is used to convert the cell array into matrix which
%helps in comparing the elements in the species to calculate the molecular
%weight
m = cell2mat(name);
m_wt = 0;
        %for loop to run for the number of elements in the species name.
        %In each if statement the element name is compared with the
        %specified element and adds the molecular weight of that element.
        for ll = 1 : length(m)

            %This [var status] checks for the number of elements present in
            %the species and adds those many number of elements to species
            %molecular weight.
            [var status] = str2num(m(ll));

            if (status == 1)

                if (strcmpi(m(ll-1),'H'))

                    m_wt = m_wt+1*(var-1) ;

                end

                if (strcmpi(m(ll-1),'O'))

                    m_wt = m_wt+16*(var - 1);

                end

                if (strcmpi(m(ll-1),'N'))

                    m_wt = m_wt+14*(var - 1);

                end

                if (strcmpi(m(ll-1),'A'))

                    m_wt = m_wt+40*(var - 1);

                end

                if (strcmpi(m(ll-1),'C'))

                    m_wt = m_wt+12*(var - 1);

                end
                %else statement compares the elements of species and assignes molecular weight of the element to the species.
            else
                   if (strcmpi(m(ll),'O'))

                    m_wt = m_wt+16;

                end

                 if (strcmpi(m(ll),'C'))

                    m_wt = m_wt+12;

                 end

                  if (strcmpi(m(ll),'N'))

                    m_wt = m_wt+14;

                  end

                   if (strcmpi(m(ll),'H'))

                    m_wt = m_wt+1;

                   end
                 if (strcmpi(m(ll),'A'))

                    m_wt = m_wt+40;

                 end


             end


        end

end
Results:
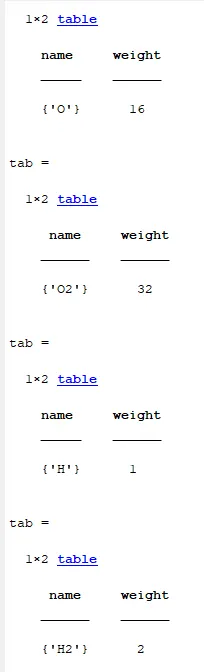
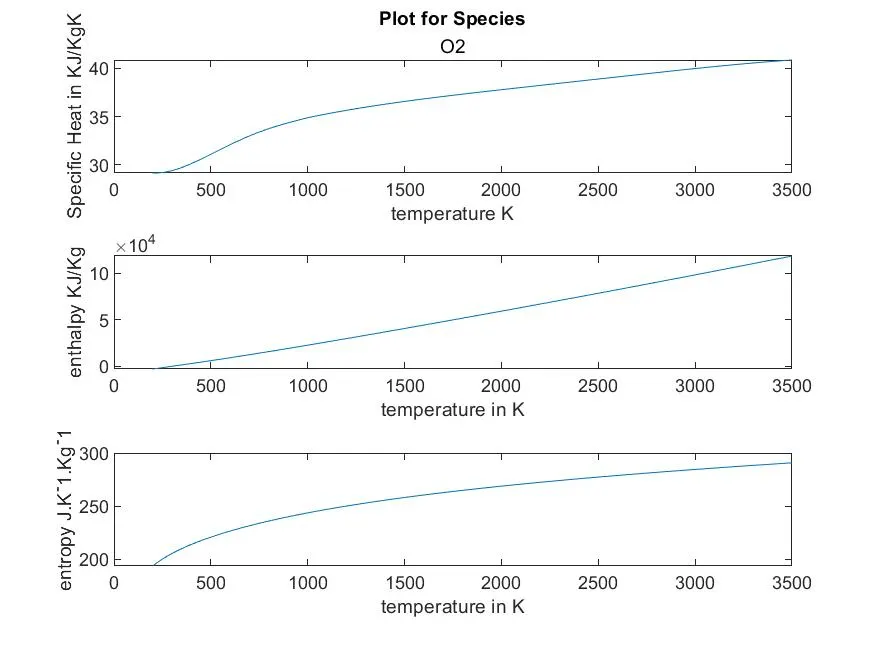
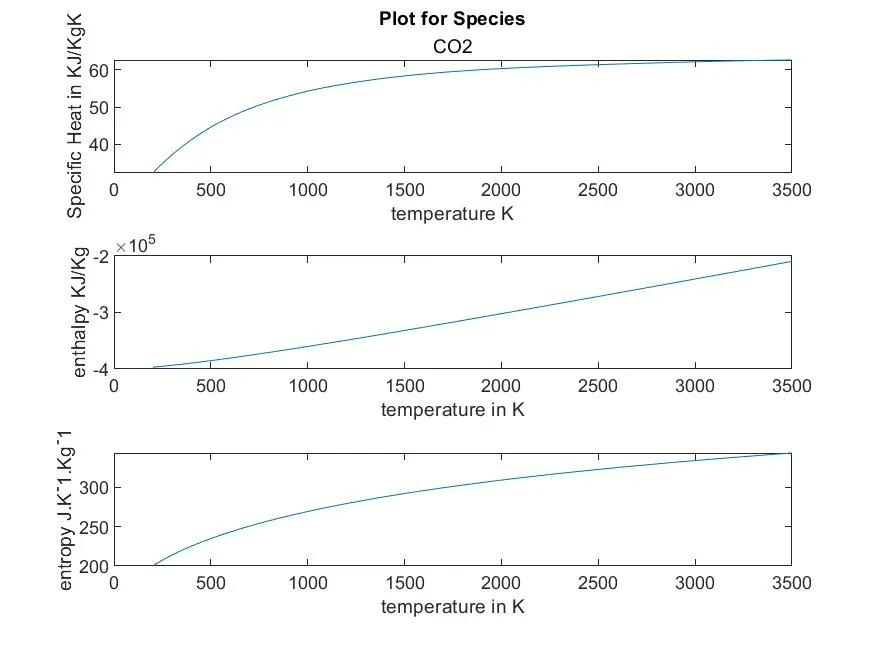
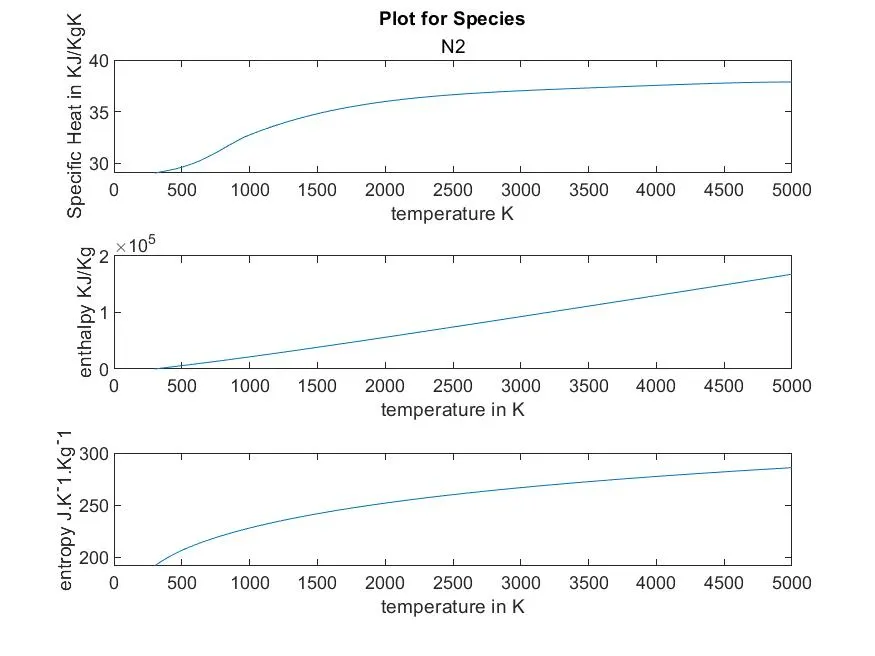
CP,H,S values are calculated for high and low temperature co-efficients and plot is created between CP,H,S vs Temperature for each species given in the data file and plots are stored in the species specific folder. Molecular weight each species are calculated and displayed in the command window.

Plot for O2
Plot for CO2
Plot for N2
Display of molecular weight in command window.