Parsing NASA thermodynamic data using MATLAB
AIM: The aim of this project is to extract data from the given data file and calculate the necessary parameters using the relevant data, generate plots, and save it in the desired manner.
GOVERNING EQUATIONS:

where, Cp stands for Specific Heat, H stands for Enthalpy, S stands for Entropy, T is temperature and a is the coefficient.
OBJECTIVES:
The objective of this project is to :
1. Extract the Species name and calculate its molecular weight.
2. Extract the mid, min, and max temperature values for each species.
3. Extract the coefficients for each species.
4. Plot the Cp, Enthalpy, and Entropy for the local temperature range.
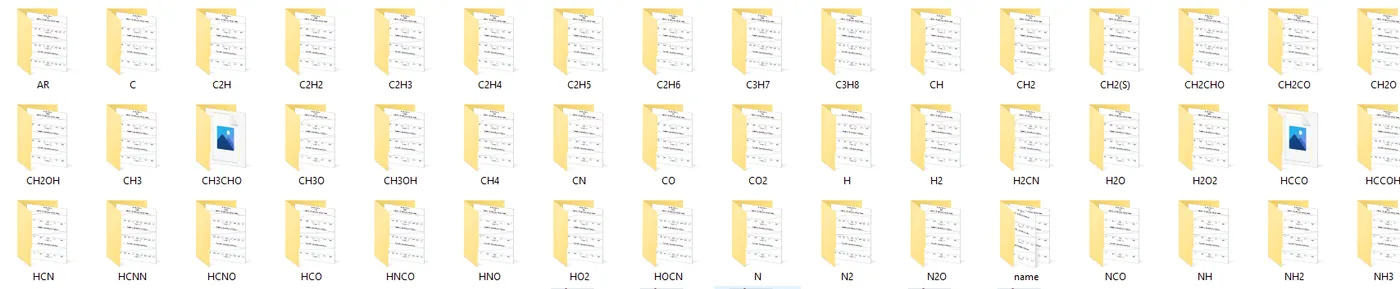
5. Save the plots as images with appropriate names and save them into separate folders for each species with a suitable name, which will be done automatically.
CODE EXPLANATION:
In order to open the file, the fopen() function was used, where read mode was specified as permission. A 'for' loop was used to skip the first 5 lines which consisted of the global temperature range and the comments.
fgetl() command was used to read each line from the file.
Another 'for' loop was made, which ran from 1 to infinite number of times, and the word END was used to break the for loop.
strsplit() function was used to split the string into a cell array where the space between each word was used as a delimiter.
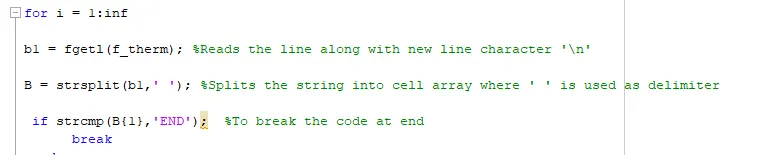
To read the coefficient line, a for loop was used which ran 1 to 3 times, since the coefficients were present in 3 different lines. To extract the coefficients, findstr() was used to find the position of 'E', and using logic, the coefficient was extracted.

The first coefficient value was from position 1 to the position of E+3. And the second coefficient value was from the position of first E +3 till the position of E of the second coefficient+3. This way the coefficients were extracted. Since the fourth line of each species had only 4 coefficients and the first two had 5, an array size error occurred when trying to extract the coefficients from the fourth line. Hence if the length of array A was equal to 4, the loop will break.
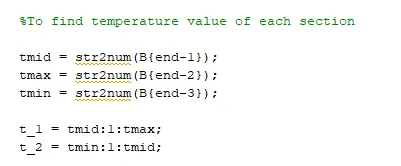
The mid, max, and min temperature for each species were in a specific order when read from the right. Hence to read the local temperature for each species, B{end-1} was used and the temperature values were assigned to suitable variables. It was important to use {} braces since cell array values were being extracted.
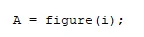 , The plot figure for each species was assigned to a variable A, which was later used to save the plots as images.
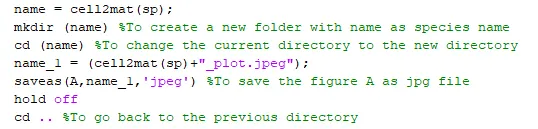
sp was the name of the species and cell2mat() was used to convert the cell array into an ordinary array. mkdir() was used to create a new folder with the folder name specified, hence the variable 'name' was specified inside the function definition. cd(name) was used to change the current folder to the new folder. Variable 'name_1' was used which had the species name and '_plot.jpeg' which was necessary so as to be defined inside the saveas() function definition.
The saveas() function was used to save the plot as an image.
cd .. was used to go back to the previous folder, that is one level up from the current folder.
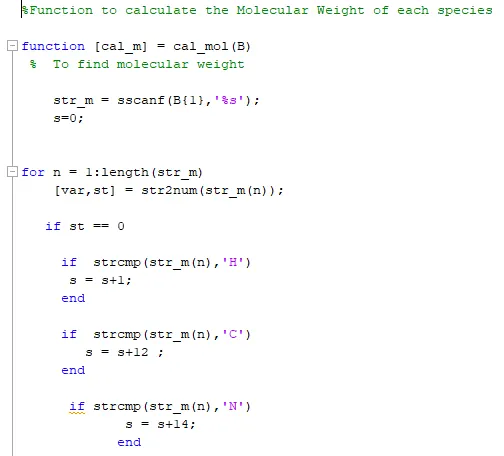
To calculate molecular weight, function cal_mol was used. In the function, variable str_m had the string assigned to it from the first position of the cell array B, which consisted of the species name. A 'for' loop was used, which ran 1 to as many times as the length of the string. For ex, H20, since the length is 3, then the loop would run 3 times. str2num was used to check if the string had a letter or a number, and if the string had a letter, the value of st would be 0 and the first half of loop would run. If st would return 1, that is there is a number in the string then the 'else' part of the loop would be executed.
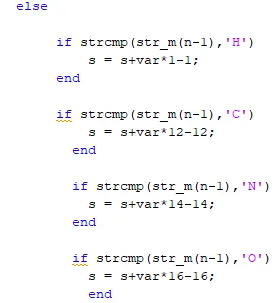
var, returns the number in the string, hence in strcmp() str_m(n-1) was used string which compares the previous position with the element letter and multiplies the variable with the molecular weight of the element. Since it is now adding the molecular weight of the element one extra time, the element weight is subtracted from it in order to get the correct value.
CODE :
clear all
close all
clc

f_therm = fopen('THERMO.dat','r'); %Opens the THERMO.dat text file

for i = 1:5   %skips the first 5 lines which include the global temperature and comments

a = fgetl(f_therm);

end

for i = 1:inf

b1 = fgetl(f_therm); %Reads the line along with new line character 'n'

B = strsplit(b1,' '); %Splits the string into cell array where ' ' is used as delimiter

 if strcmp(B{1},'END');  %To break the code at end
      break
 end
 j=1;
 SP_name(i) = B(1);

 for k=1:3 %To read lines ending with 2,3,4
    b = fgetl(f_therm);
    A = findstr(b,'E'); %Returns the position of E
    coeff(j) = str2num(b(1:A(1)+3));
    coeff(j+1) = str2num(b(A(1)+4:A(2)+3));
    coeff(j+2) = str2num(b(A(2)+4:A(3)+3));
    coeff(j+3) = str2num(b(A(3)+4:A(4)+3));
        if(length(A)==4) %Since line 4 has only 4 coefficients, if size of array A =4, the loop will break
         break;
        end
    coeff(j+4) = str2num(b(A(4)+4:A(5)+3));
    j = j+5;
 end

  %  To find molecular weight
   Species_Name = SP_name{i}
   molecular_weight = cal_mol(B)

   %To find temperature value of each section

   tmid = str2num(B{end-1});
   tmax = str2num(B{end-2});
   tmin = str2num(B{end-3});

   t_1 = tmid:1:tmax;
   t_2 = tmin:1:tmid;


   A = figure(i);

   subplot(3,1,1)
   SpecHeat = cal_sh(coeff(1:5),t_1); %To calculate Specific Heat
   plot(t_1,SpecHeat,'Color','r')
   hold on
   subplot(3,1,2)
   Enthlpy = cal_en(coeff(1:6),t_1); %To calculate Enthalpy
   plot(t_1,Enthlpy,'Color','b')
   hold on
   subplot(3,1,3)
   Entrpy = cal_en(coeff(1:7),t_1); %To calculate Entropy
   plot(t_1,Entrpy,'Color',[0,0.7,0.9])
   hold on

   subplot(3,1,1)
   SpecHeat = cal_sh(coeff(8:12),t_2);
   plot(t_2,SpecHeat,'Color','r')
   xlabel('Temperature [K]')
   ylabel('Specific Heat [KJ/Kg -K] ')
   sp = SP_name(i);
   str_1 = ["Species Name :";sp;"Subplot 1: Temperature vs Specific heat"];
   title(str_1)
   hold off
   subplot(3,1,2)
   Enthlpy = cal_en(coeff(8:13),t_2);
   plot(t_2,Enthlpy,'Color','b')
   xlabel('Temperature [K]')
   ylabel('Enthalpy [joule]')
   title('Subplot 2: Temperature vs Enthalpy')
   hold off
   subplot(3,1,3)
   Entrpy = cal_en(coeff(8:14),t_2);
   plot(t_2,Entrpy,'Color',[0,0.7,0.9])
   xlabel('Temperature [K]')
   ylabel('Entropy [joule/K]')
   title('Subplot 3: Temperature vs Entropy')
   name = cell2mat(sp);
   mkdir (name) %To create a new folder with name as species name
   cd (name) %To change the current directory to the new directory
   name_1 = (cell2mat(sp)+"_plot.jpeg");
   saveas(A,name_1,'jpeg') %To save the figure A as jpg file
   hold off
   cd .. %To go back to the previous directory
end
%Function  to calculate Specific Heat

function [cal_1] = cal_sh(x,y)
cal_1 = (x(1) + x(2).*y + x(3).*y.^2 + x(4).*y.^3 + x(5).*y.^4).*8.314;

end
%Function to calculate Enthalpy
function [cal_2] = cal_en(x,y)
cal_2 = (x(1) + x(2).*(y./2) + x(3).*(y.^2/3) + x(4).*(y.^3/4) + x(5).*(y.^4/5)+x(6)./y).*y.*8.314;
end%Function to calculate Entropy
function [cal_3] = cal_entrpy(x,y)
cal_3 = (x(1)*.log(y) + x(2)*.log(y) + x(3).*(y.^2/2) + x(4).*(y.^3/3) + x(5).*(y.^4/4)+x(7))*8.314;
end%Function to calculate the Molecular Weight of each species
function [cal_m] = cal_mol(B)
% To find molecular weight
str_m = sscanf(B{1},'%s');
s=0;
for n = 1:length(str_m)
[var,st] = str2num(str_m(n));
if st == 0
if strcmp(str_m(n),'H')
s = s+1;
end
if strcmp(str_m(n),'C')
s = s+12 ;
end
if strcmp(str_m(n),'N')
s = s+14;
end
if strcmp(str_m(n),'O')
s = s + 16;
end
if strcmp(str_m(n),'A')
s = s + 40;
end
else
if strcmp(str_m(n-1),'H')
s = s+var*1-1;
end
if strcmp(str_m(n-1),'C')
s = s+var*12-12;
end
if strcmp(str_m(n-1),'N')
s = s+var*14-14;
end
if strcmp(str_m(n-1),'O')
s = s+var*16-16;
end
end
cal_m = s;
end
end
CODE OUTPUT:
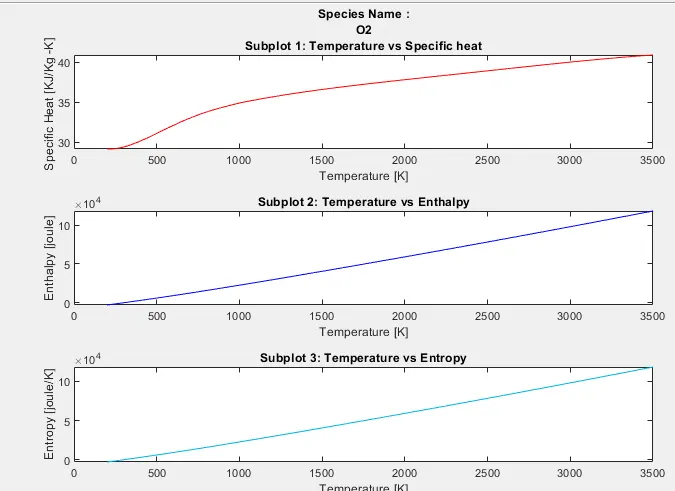
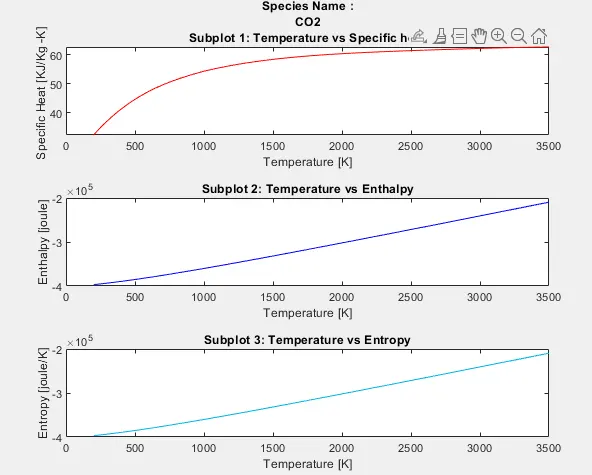
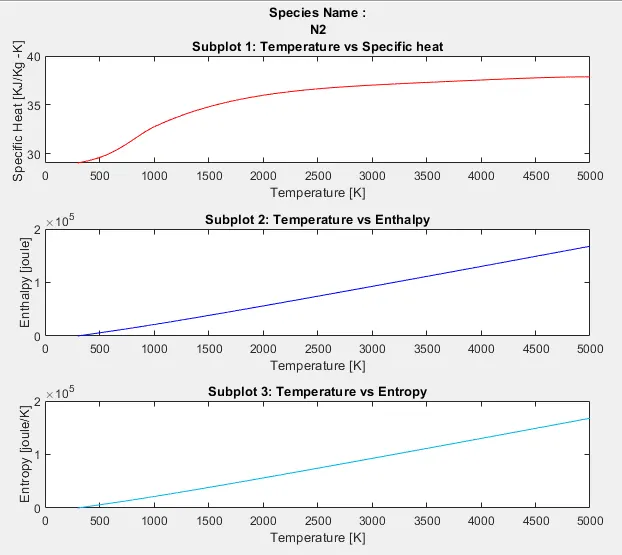
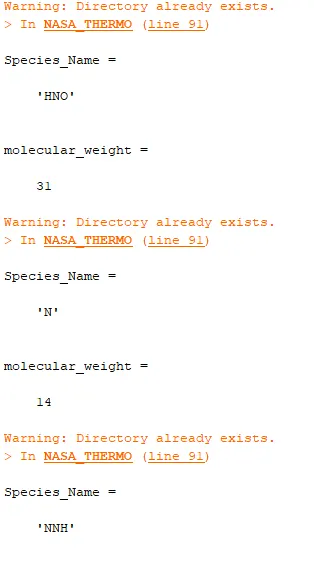
MOLECULAR WEIGHT OF EACH SPECIES DISPLAYED ON THE COMMAND WINDOW:
Plots of each species were saved as images into separate folders which were named as per their species name.