Parsing NASA thermodynamic data (MATLAB)
AIM:
to evaluate NASA's thermodynamic data (provided ) by understanding and using the file parsing method on MATLAB to plot the various graphs and to do the calculations.
GOVERNING EQUATIONS

OBJECTIVE:
- Write a function that extracts the 14 co-efficients and calculates the enthalpy, entropy and specific heats for all the species in the data file.
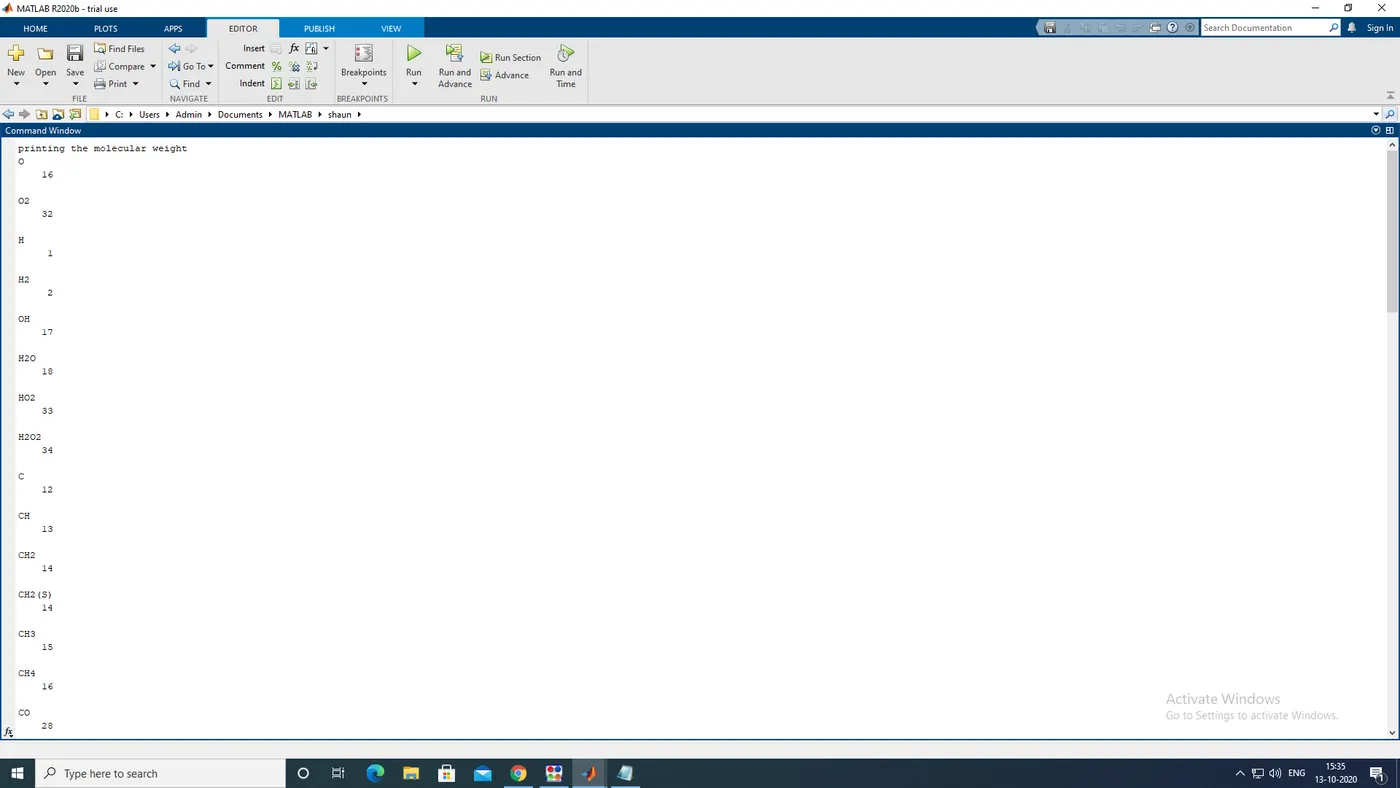
- Calculate the molecular weight of each species and display it in the command window.
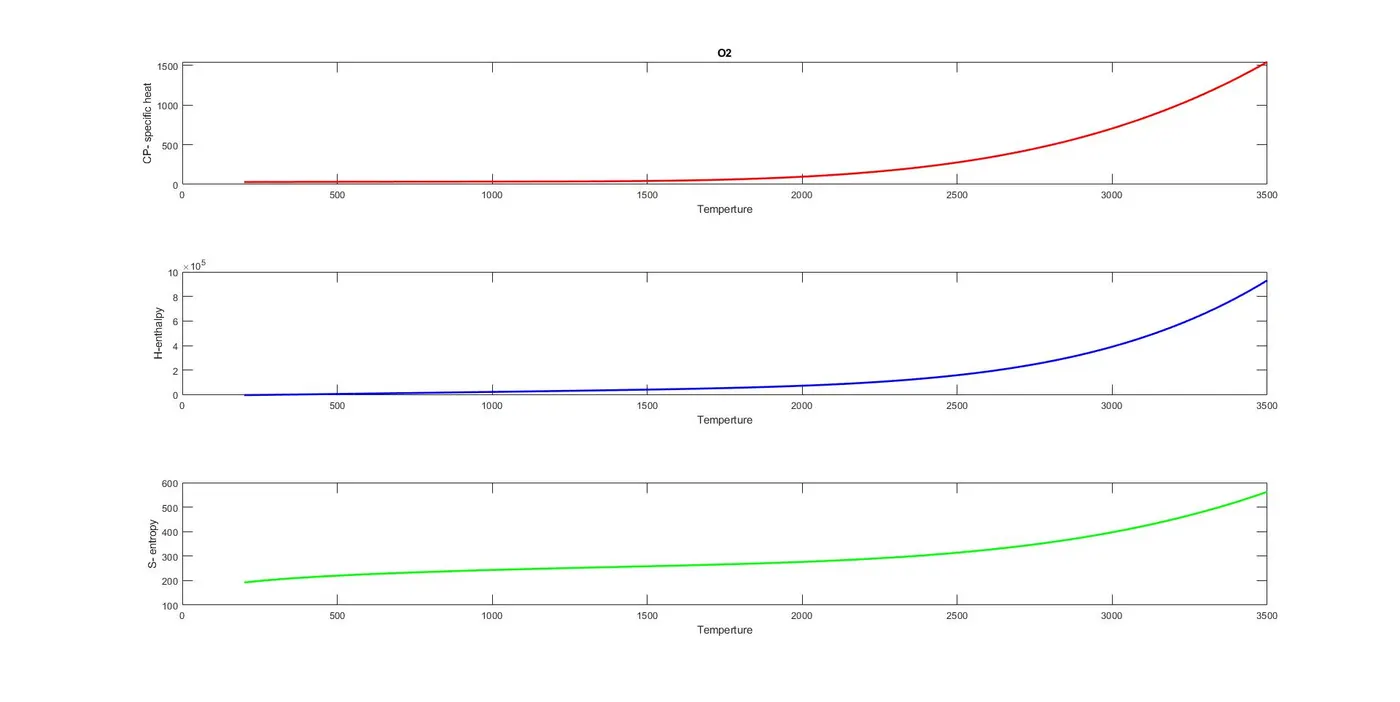
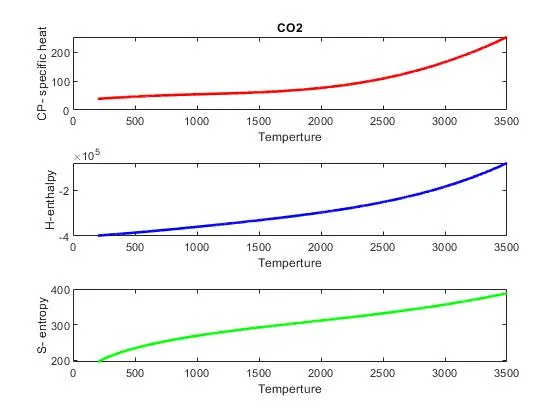
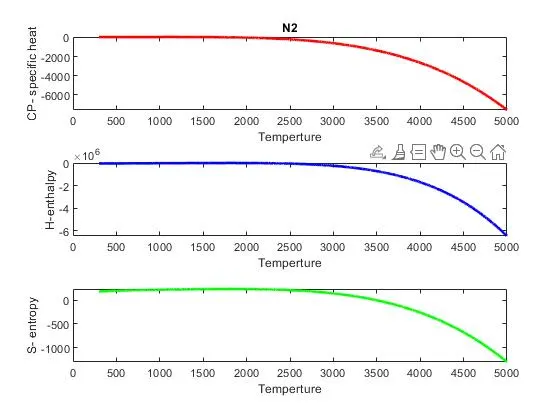
- Plot the Cp, Enthalpy and Entropy for the local temperature range (low temperature : high temperature) specific for each species.
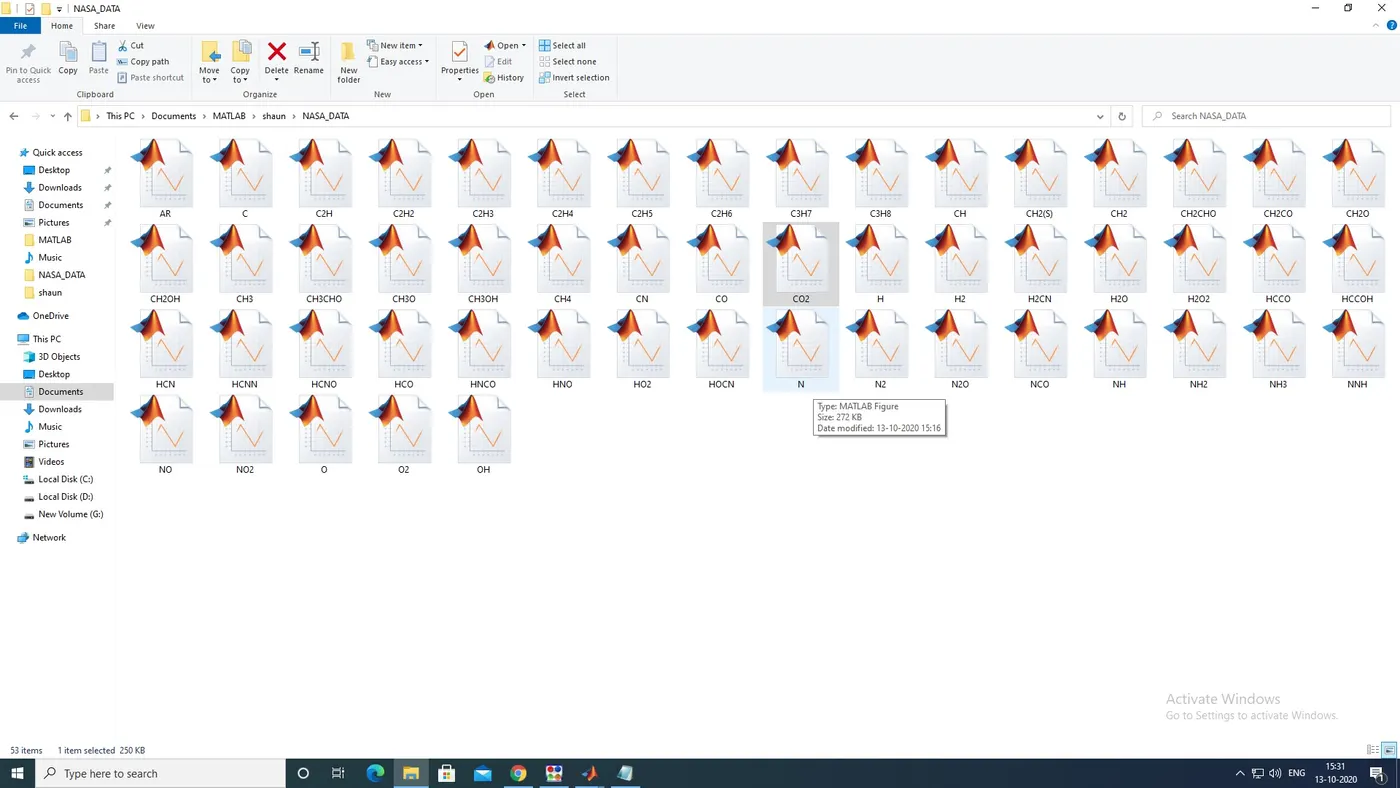
- Save the plots as images with appropriate names and dump them in separate folder. All these should be generated automatically.
- The main program will just take the "THERMO.dat" file as an input and generate Cp, H and S plots.
CODE:
This program was done using MATLAB.
The main functions/solvers used are
- fopen- to open the file
- fgetl -reading the first line of the file
- strsplit- used to split the string into a cell
- str2num- converting string to array
- findstr- to find a perticular string
- cd-to change the directory
The main program is as shown below:
close all
clear all
clc

f1=fopen('THERMO.dat','r'); % to open the file
a=fgetl(f1);    %reading the first line of the file
a1=fgetl(f1);   %reading the second line of the file
A1=strsplit(a1,'  '); %splitting the string into individual elements in a cell
global_low_t=str2num(A1{1});  %to store global lowest temp
global_mid_t=str2num(A1{2});    %to store global mid temp
global_high_t=str2num(A1{3});   %to store global high temp

for i=1:3                       % using for loop to read through the lines that begin with ! as these are comments
  a2 = fscanf(f1,'%s',[1]);
  if a2 == '!'
    fgetl(f1);
  end
end
disp('printing the molecular weight');
% begining reading the actual data
for i=0:53
    a3=fgetl(f1);   % to get the line of data
    A3=strsplit(a3,' ');    % to split the string into individual string elements
    [h, status]=str2num(A3{end}); % to convert string to a number but also checking for completion
    if status==1                    %to start at each segment, record the local temp data
       t_mid= A3{end-1};
        t_mid=str2num(t_mid);
        t_max= A3{end-2};
        t_max=str2num(t_max);
        t_min= A3{end-3};
        t_min=str2num(t_min);
        name=A3{1};
        ct=1;
        for j=1:2             % to collect the first 10 coeff
            a4=fgetl(f1);
            no_E=findstr(a4,'E');
            v1=a4(1:no_E(1)+3);
            coeff(ct)=str2num(v1);
            ct=ct+1;
            v2=a4(no_E(1)+4:no_E(2)+3);
            coeff(ct)=str2num(v2);
            ct=ct+1;
            v3=a4(no_E(2)+4:no_E(3)+3);
            coeff(ct)=str2num(v3);
            ct=ct+1;
            v4=a4(no_E(3)+4:no_E(4)+3);
            coeff(ct)=str2num(v4);
            ct=ct+1;
            v5=a4(no_E(4)+4:no_E(5)+3);
            coeff(ct)=str2num(v5);
            ct=ct+1;
        end
        a4=fgetl(f1);               % to collect the next 4 coeff
        no_E=findstr(a4,'E');
        v1=a4(1:no_E(1)+3);
        coeff(ct)=str2num(v1);
        ct=ct+1;
        v2=a4(no_E(1)+4:no_E(2)+3);
        coeff(ct)=str2num(v2);
        ct=ct+1;
        v3=a4(no_E(2)+4:no_E(3)+3);
        coeff(ct)=str2num(v3);
        ct=ct+1;
        v4=a4(no_E(3)+4:no_E(4)+3);
        coeff(ct)=str2num(v4);

        %call functions
      calc_func(coeff,t_min, t_mid, t_max,name); % function plots graphs , stores the graphs and calculates molecular mass

    else if status ==0
            disp('end of program');

        end
    end
end
The code for the function calc_func is shown below :
%calculating for thermodynamic data
function [] =calc_func(coeff,t_min, t_mid, t_max,name)
% inputting molecular mass data in atomic units
o=16;
h2=1;
c=12;
n=14;
ar=40;
r=8.31;
mol_wt=0;

ct=0; % COUNTER
diff=t_max-t_min;
t=[t_min:1:t_max];              % localised temp array
for i=t_min:(t_mid-1)           % to calculate the values in the low temp range
      ct=ct+1;
    cp(ct)= (coeff(1)+(coeff(2)*i)+(coeff(3)*i*i)+(coeff(4)*i*i*i)+(coeff(5)*i*i*i*i))*r;
    h(ct)= (coeff(1)+((coeff(2)*i)/2)+((coeff(3)*i*i)/3)+((coeff(4)*i*i*i)/4)+((coeff(5)*i*i*i*i)/5)+(coeff(6)/i))*r*i;
    s(ct)= ((coeff(1)*log(i))+(coeff(2)*i)+((coeff(3)*i*i)/2)+((coeff(4)*i*i*i)/3)+((coeff(5)*i*i*i*i)/4)+coeff(7))*r;

end
for i=t_mid:t_max            % to calculate the values in the high temp range
    ct=ct+1;
    cp(ct)= (coeff(8)+(coeff(9)*i)+(coeff(10)*i*i)+(coeff(11)*i*i*i)+(coeff(12)*i*i*i*i))*r;
    h(ct)= (coeff(8)+((coeff(9)*i)/2)+((coeff(10)*i*i)/3)+((coeff(11)*i*i*i)/4)+((coeff(12)*i*i*i*i)/5)+(coeff(13)/i))*r*i;
    s(ct)= ((coeff(8)*log(i))+(coeff(9)*i)+((coeff(10)*i*i)/2)+((coeff(11)*i*i*i)/3)+((coeff(12)*i*i*i*i)/4)+coeff(14))*r;

end

% plotting begins
f=figure('Name',name,'NumberTitle','off');

subplot(3,1,1)

plot(t,cp,'linewidth',2,'color','r');
xlabel('Temperture');
ylabel('CP- specific heat');
title(name);
subplot(3,1,2)
plot(t,h,'linewidth',2,'color','b');
xlabel('Temperture');
ylabel('H-enthalpy');
subplot(3,1,3)
plot(t,s,'linewidth',2,'color','g');
xlabel('Temperture');
ylabel('S- entropy');

%saving plots to a new folder
cd 'C:UsersAdminDocumentsMATLABshaunNASA_DATA';
saveas(f,name);
oldFolder=cd ('C:UsersAdminDocumentsMATLABshaun'); % returning to the original folder
% molecular mass calculation
i_let=cell2mat(split(name,""));
n_len=length(name);
disp(name)      %displaying name of element
for j=1:n_len           % for loop to calculate molecular mass
    [var,st]=str2num(i_let(j));
    if st==0
        if i_let(j)=='O'
            mol_wt=mol_wt + o; end
        if i_let(j)=='H'
            mol_wt=mol_wt + h2; end
        if i_let(j)=='C'
            mol_wt=mol_wt + c; end
        if i_let(j)=='N'
            mol_wt=mol_wt + n; end
        if i_let(j)=='A'
            mol_wt=mol_wt + ar; end
    else
         if i_let(j-1)=='O'
            mol_wt=mol_wt + (o*var)-o; end
        if i_let(j-1)=='H'
            mol_wt=mol_wt + (h2*var)-h2; end
        if i_let(j-1)=='C'
            mol_wt=mol_wt + (c*var)-c; end
        if i_let(j-1)=='N'
            mol_wt=mol_wt + (n*var)-n; end
    end
end
 disp(mol_wt(:,1)); % displaying molecular mass on the command window
end
ERRORS ENCOUNTERED:
Only basic syntax errors were enountered which were resolved in time.
OUTPUT:
Due to the large number of graphs produced i will only be showing the graphs generated i have attached only a few below.
CONCLUSION :
Parsing of data using MATLAB was thoroughly understood , it was used to extract the data and plot the various graphs required.