Project 1 - Parsing NASA thermodynamic data
Aim: write a code to plot the NASA thermodynamic species CP,S,H values with respect to temperatures.
Objective: by using different types of inbuilt command we are going to plot the temp vs CP,S,H drawings
Step wise explanation of code:
As a basic thing we are going to start with clear all close all and clc commands
Initially we are going to give input data of R universal gas constant
Then by using fopen and fgetl command we are going to read the data and collect the data into work sheet
From the data book we are going to read line by line so , from first line we will get temperature ranges
From that we are creating an array for the temp by using linspace so that we can plot the n number of values
Next three lines are header information, so we are going to skip the lines by using for loop
Now the important thing we need to extract all the temp co-efficient for all the species for the data
So, there are 53 species in the data so we are using a for loop for i=1:53 so it runs each line for 53 times so we will get all the species calculations as required.
So, first line is species name and temp range so by using stroke command we will get only species name
Then each species having their lines of co-eff so by using strfind and str2num command we will extract all the numbers in the lines
So now all the lines in the data are extracted now we can start CP,S,H calculations by using the given formula
Here if and else command determines the low temp co-eff and hi temp co-effs all the CP,S,H values are calculated in this way they are calculated separately by calling a function
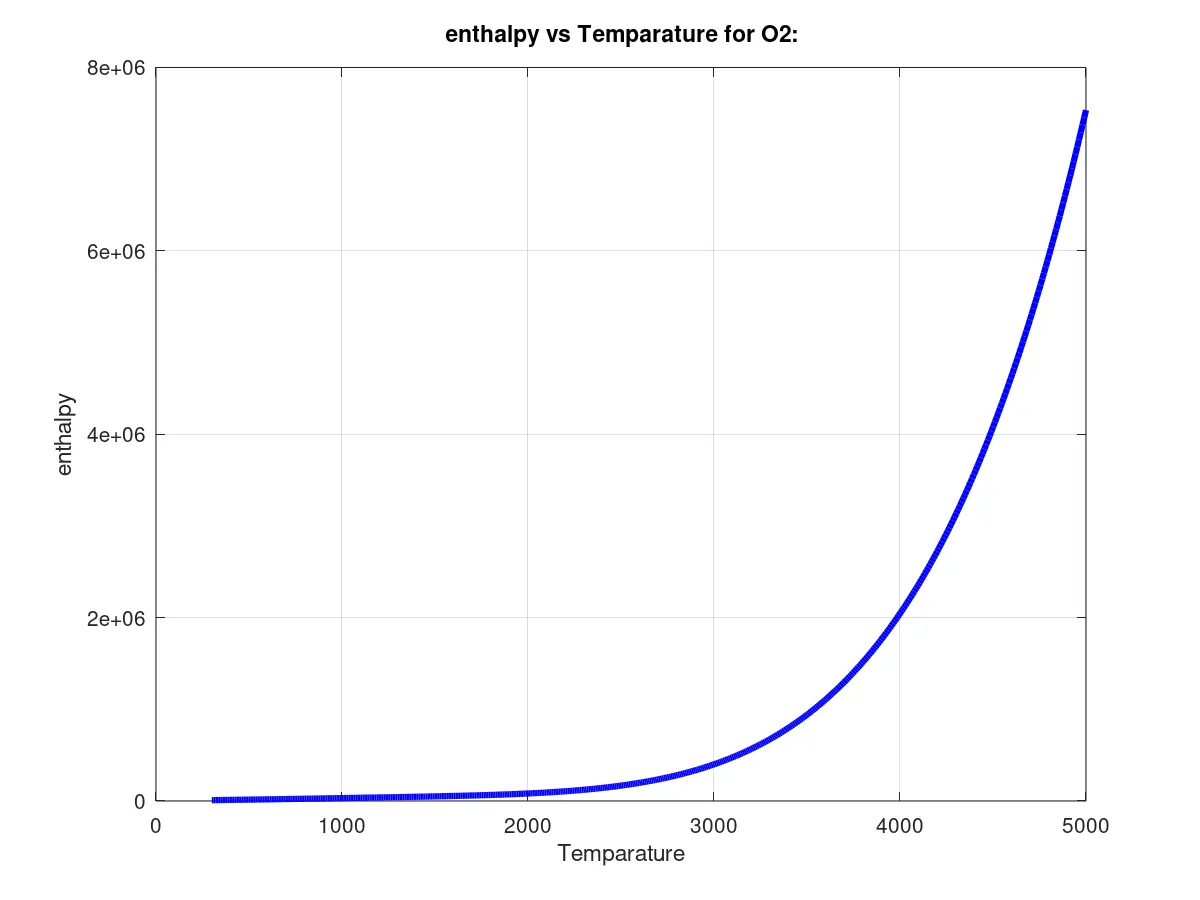
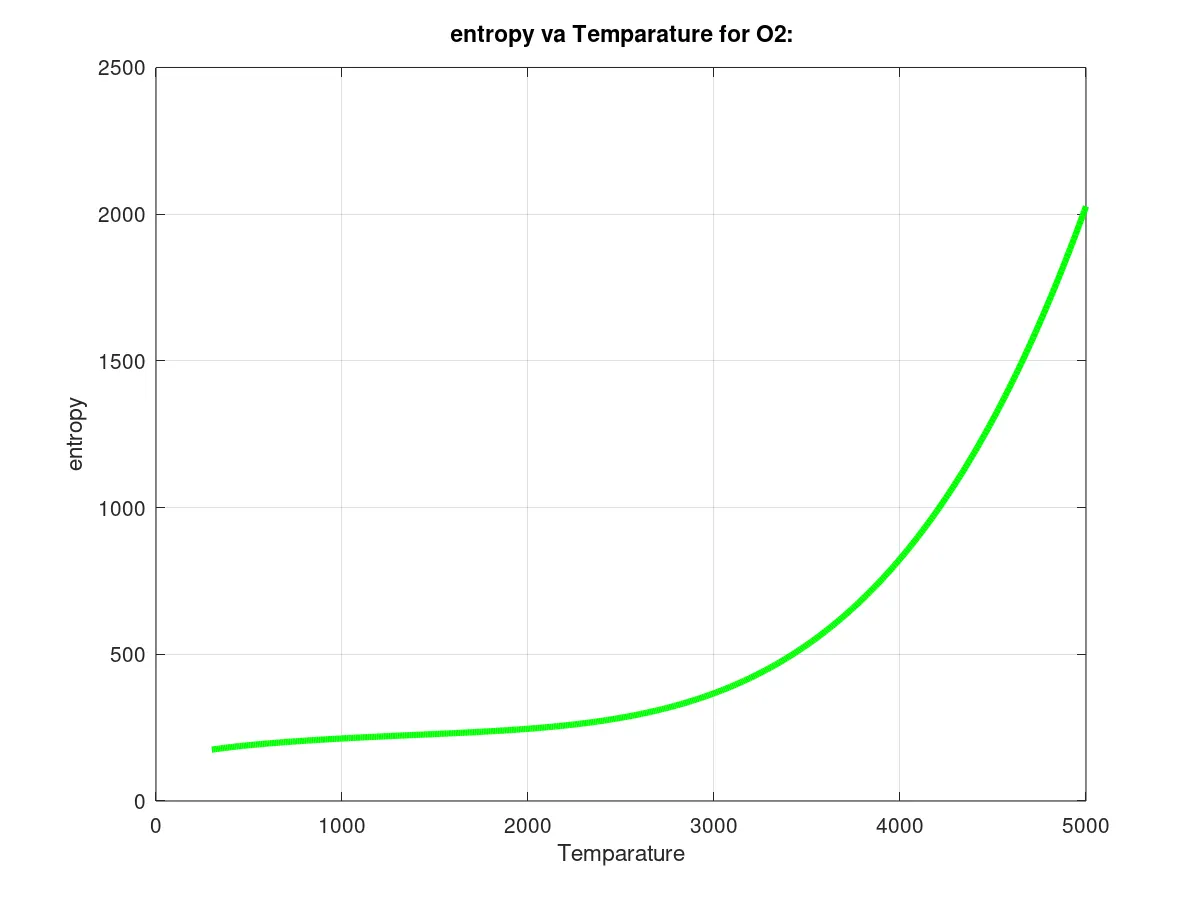
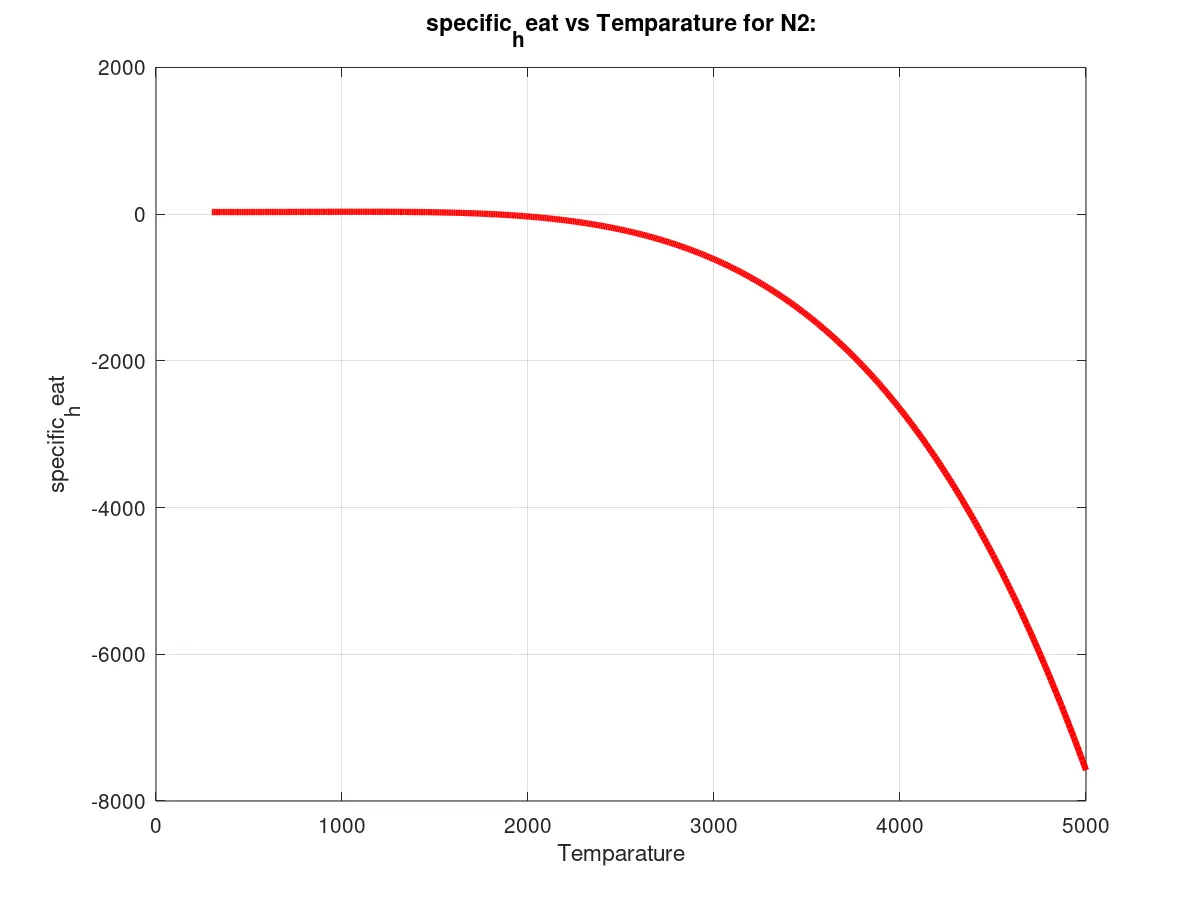
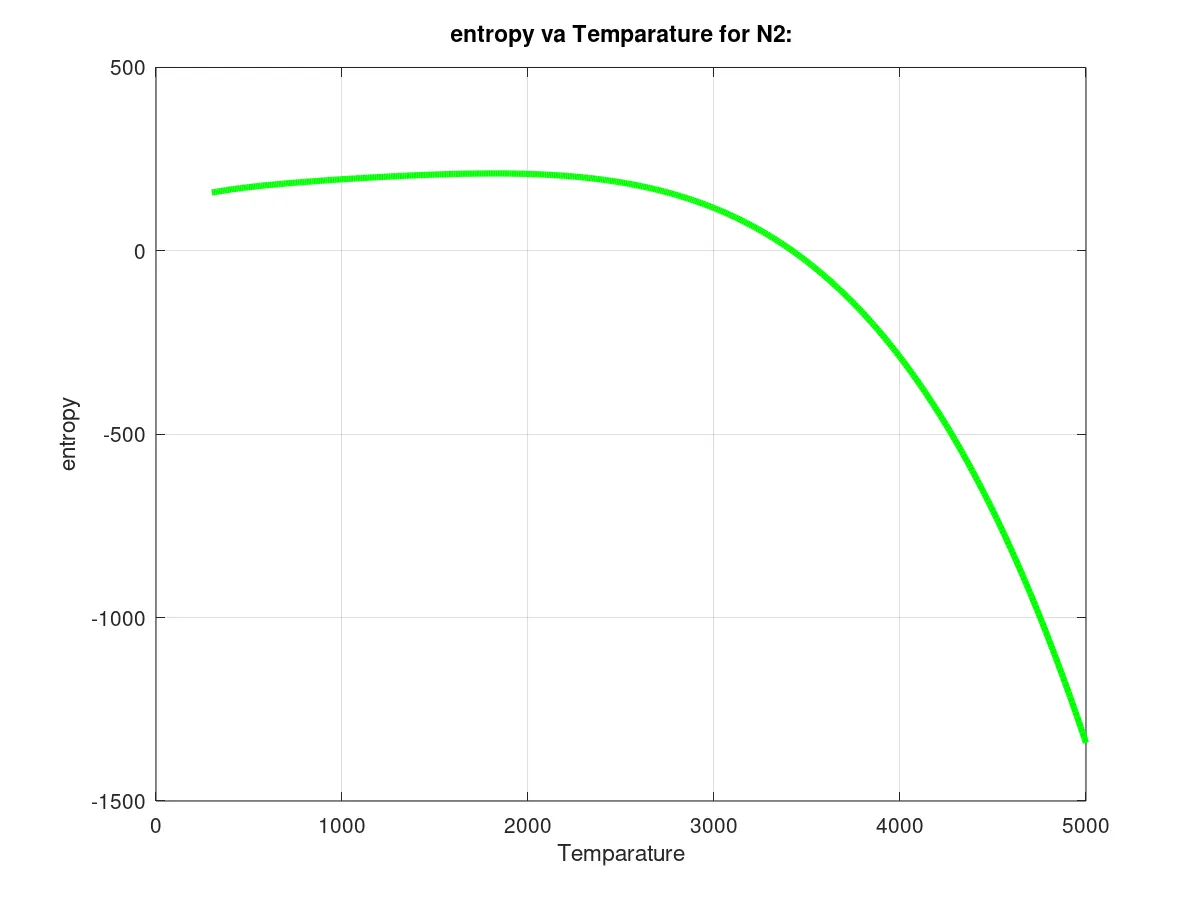
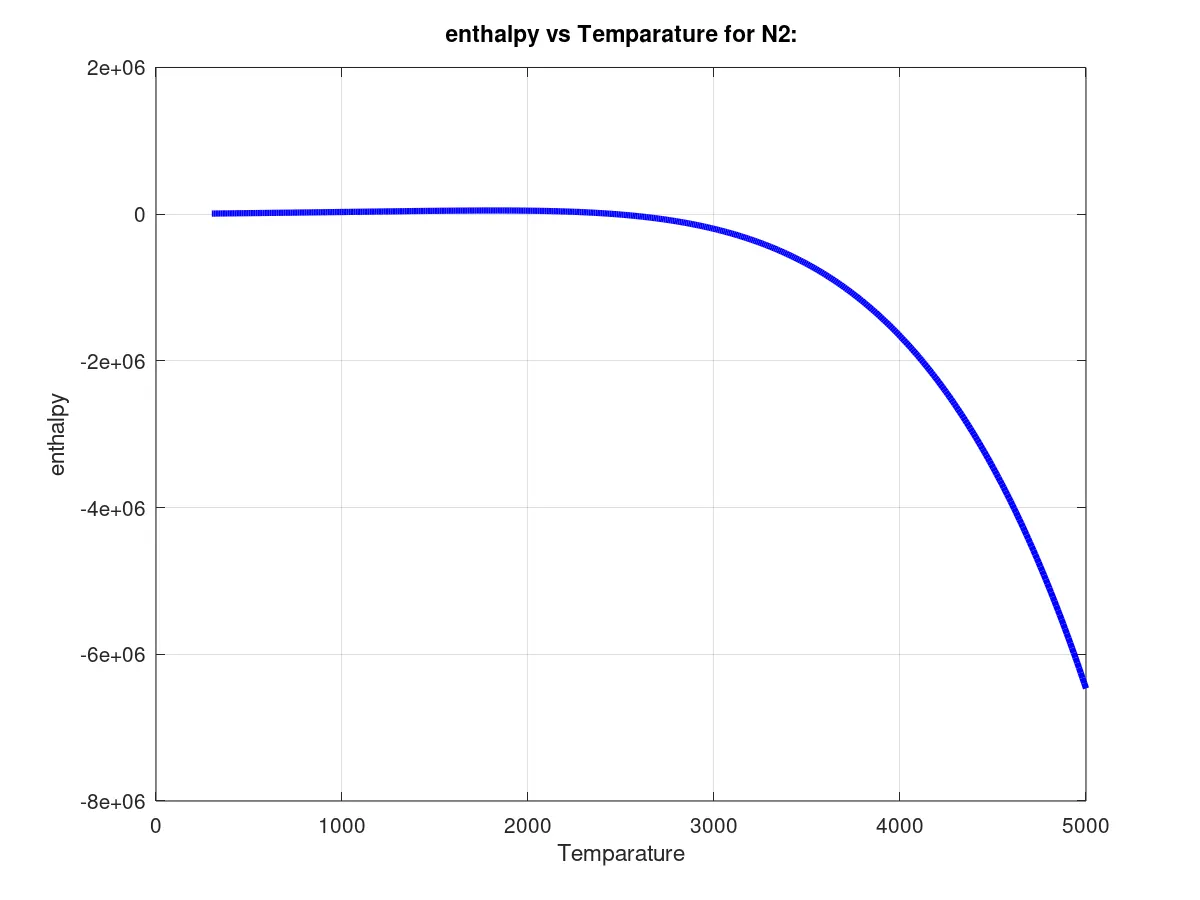
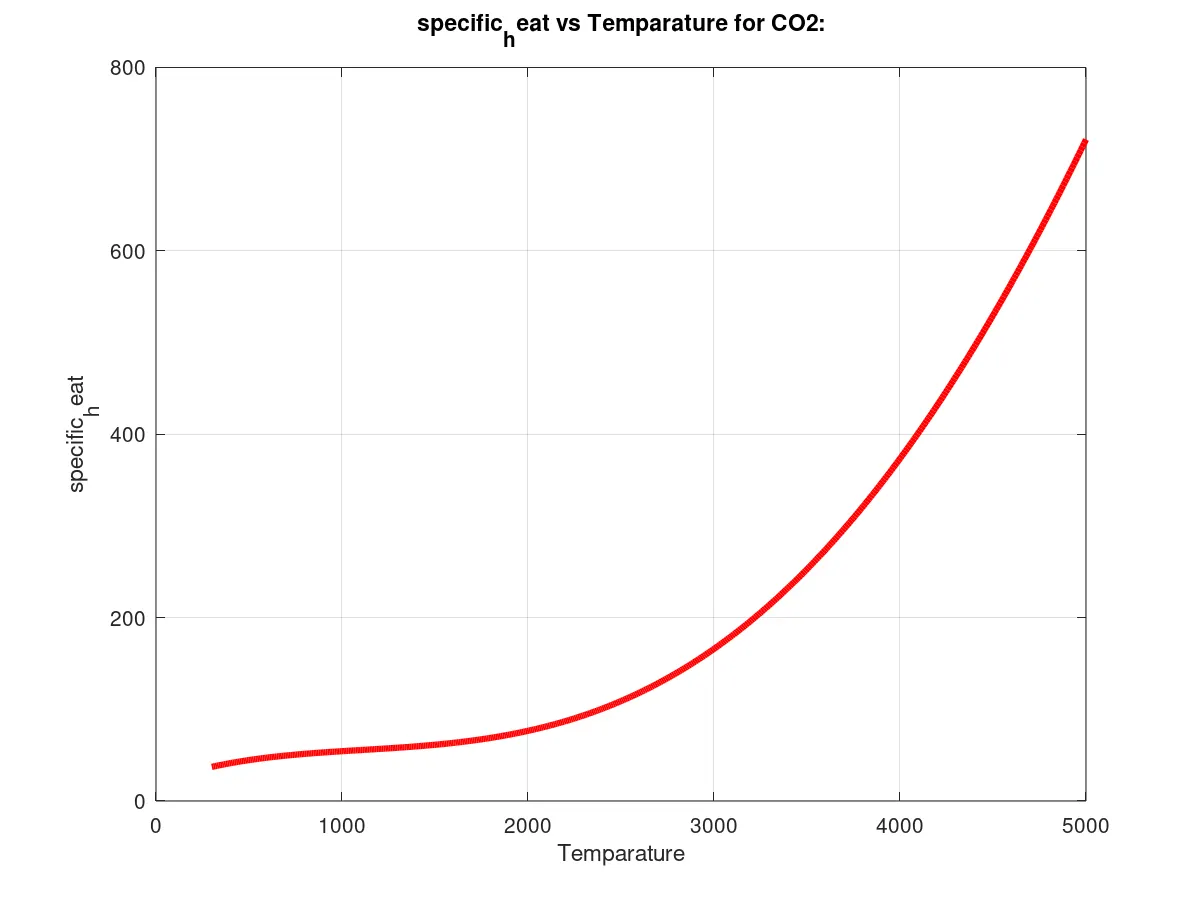
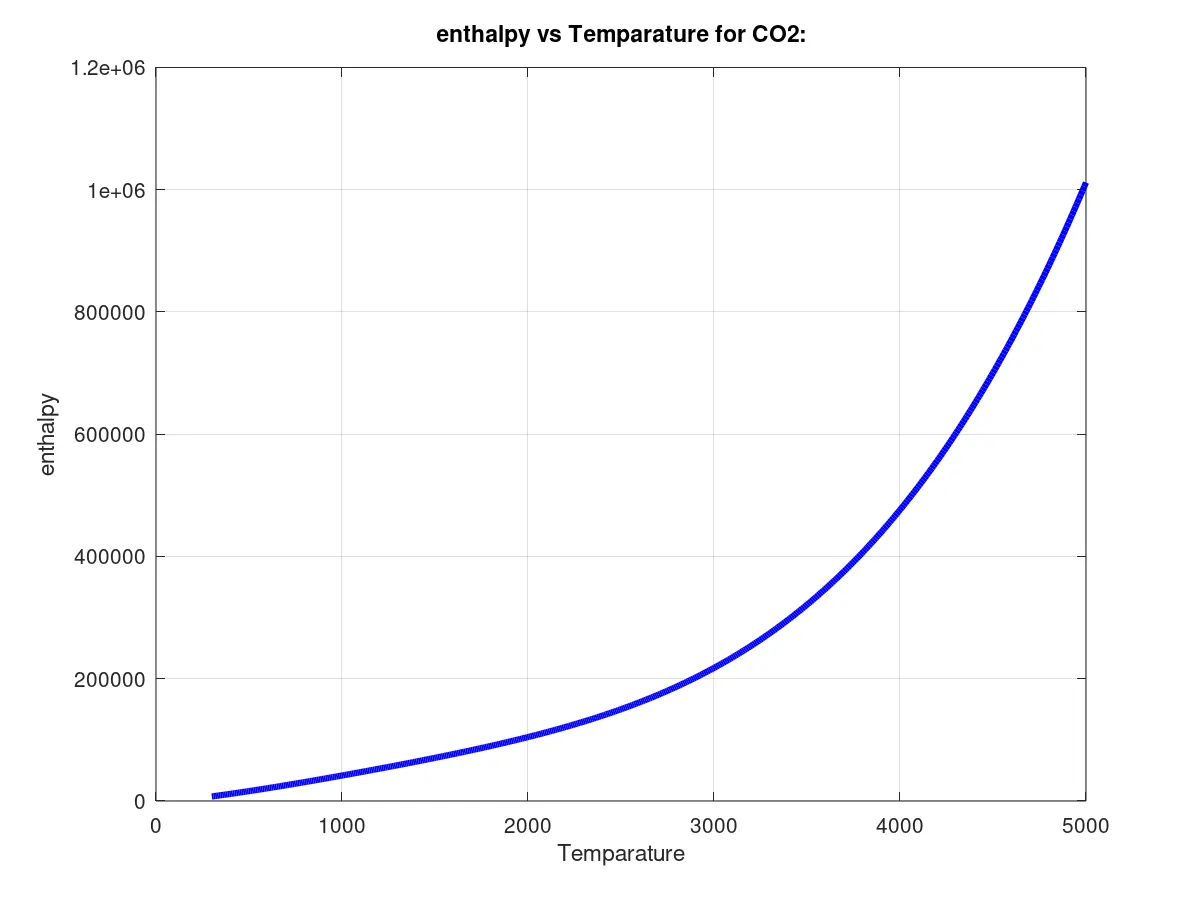
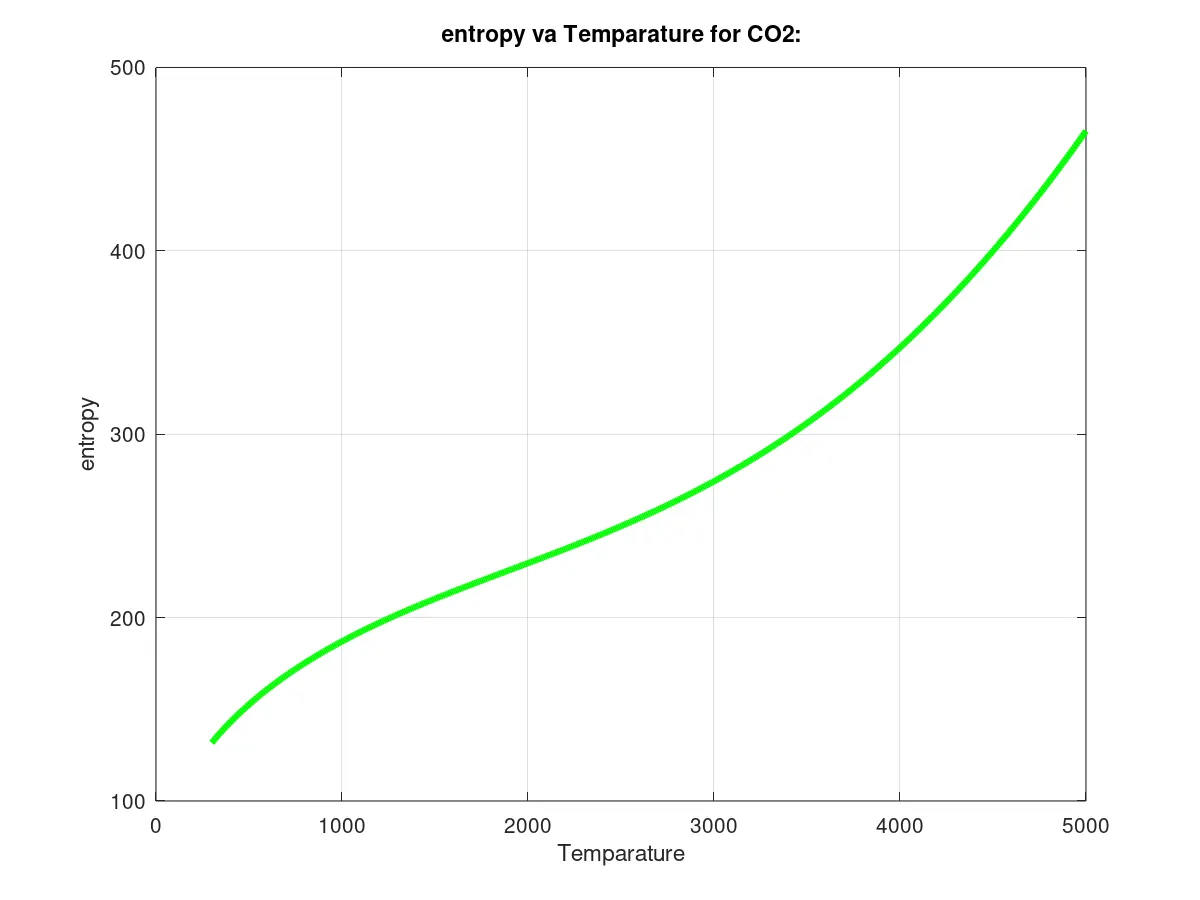
Now temp and CP,S,H all the values are calculated, now we are ready to plot the graphs for all the species
Here to store each species plots into a separate folder we are going to use mkdir and cd commands.
Them all the steps are common to plot a graph like xlabel,ylabes title,etc...
And the final thing we need to calculate molecular weight of each species for that we are going to use another function
So here first thig we are deriving the atoms into an array, totally we are having 6 atoms then atomic wg of the atoms into an array,
Then by molecular weight formulae we are going to calculate all species mol_weight, for the we are going to use some coding logics such as for loop, strcmp and if loops
So now our coding is ready to plot the figures and to clc the mol weights
Conclusion:
By using this challenge, we could get a knowledge about hoe to read the data and how to get a valid output for the data as per our requirements.
Errors faced:
In this challenge I have faced some mathematical errors I was cleared those errors by using comment section suggestions and help command.
clear all
close all
clc
% input data from the challange
%R=universal gas constant

R=8.314;

%extractingthe nasa_thermodynamics data from the system drive

f1=fopen('THERMO.dat' , 'r');

fgetl(f1);

%from the data file 2nd line gives the values of temparature
%and the values are in the form of string

temp=fgetl(f1);
a=strsplit(temp, ' ');
global_low_temp=str2num(a{2});
global_mid_temp=str2num(a{3});
global_high_temp=str2num(a{4});

% clculating the temparature range by using linspace command

t=linspace(global_low_temp,global_high_temp,500);

%we are going to skip the file information lines

for i=1:3

  skip=fgetl(f1);


end
%running  for loop command for each species there are 53 species in the file

for i=1:53
  %reading the first line that tells about species
  %working temp and no of species

  line0=fgetl(f1);

  %reading the name of the species

  name=strtok(line0);

  %reading the three lines which contains 7 low temp and 7 high temp
  %co-efficients

  line1=fgetl(f1);
  line2=fgetl(f1);
  line3=fgetl(f1);

  %finding the possition of 'E' in the line to locate the co-efficients

  a=strfind(line1,'E');
  b=strfind(line2,'E');
  c=strfind(line3,'E');

  % extracting high temp co-efficients from each line

  a1=line1(1:a(1)+3);
  a2=line1(a(1)+4:a(2)+3);
  a3=line1(a(2)+4:a(3)+3);
  a4=line1(a(3)+4:a(4)+3);
  a5=line1(a(4)+4:a(5)+3);
  a6=line2(1:b(1)+3);
  a7=line2(b(1)+4:b(2)+3);

  a1=str2num(a1);
  a2=str2num(a2);
  a3=str2num(a3);
  a4=str2num(a4);
  a5=str2num(a5);
  a6=str2num(a6);
  a7=str2num(a7);


  % extracting low temp co-efficients from each line

  b1=str2num(line2(b(2)+4:b(3)+3));
  b2=str2num(line2(b(3)+4:b(4)+3));
  b3=str2num(line2(b(4)+4:b(5)+3));
  b4=str2num(line3(1:c(1)+3));
  b5=str2num(line3(c(1)+4:c(2)+3));
  b6=str2num(line3(c(2)+4:c(3)+3));
  b7=str2num(line2(c(3)+4:c(4)+3));

  %calculating specific heat(Cp)
  %Cp/R= a1+a2*t+a3*t^2+a4*t^3+a5*t^4 from the fromula

  Cp=specific_heat(a1,a2,a3,a4,a5,b1,b2,b3,b4,b5,t,R,global_mid_temp);

  %calculating enthalpy (h)
  %H/Rt=a1+a2*t/2+a3*t^2/3+a4*t^3/4+a5*t^4/5+a6/t

  H=enthalpy(a1,a2,a3,a4,a5,a6,b1,b2,b3,b4,b5,b6,t,R,global_mid_temp);

  %calculating entropy(S)
  %S/R=a1*log(t)+a2*t+a3*t^2/2+a4*t^3/3+a5*t^4/4+a7

  S=entropy(a1,a2,a3,a4,a5,a7,b1,b2,b3,b4,b5,b7,t,R,global_mid_temp);

  %plotting all the CP,H,S values with respect to temparature

  plotting(Cp,H,S,t,name);

  %calculating molecular weight of the species

  molecular_weight(i)=mol_wt(name);

end


function Cp=specific_heat(a1,a2,a3,a4,a5,b1,b2,b3,b4,b5,t,R,global_mid_temp)
  %by using a if command we are going to calculate the specific heat values for low and high temparatures
  if t>= global_mid_temp

   Cp= R*(a1+a2.*t+a3.*t.^2+a4.*t.^3+a5.*t.^4);

 else
   Cp= R*(b1+b2.*t+b3.*t.^2+b4.*t.^3+b5.*t.^4);

   endif
  endfunction


function H=enthalpy(a1,a2,a3,a4,a5,a6,b1,b2,b3,b4,b5,b6,t,R,global_mid_temp)
  %by using a if command we are going to calculate the enthalpy values for low and high temparatures
   if t>= global_mid_temp
     H=R(a1.*t+a2.*t.^2./2+a3.*t.^3./3+a4.*t.^4./4+a5.*t.^5./5+a6./t);

   else
     H=R*(b1.*t+b2.*t.^2./2+b3.*t.^3./3+b4.*t.^4./4+b5.*t.^5./5+b6./t);
   endif
endfunction


function S=entropy(a1,a2,a3,a4,a5,a7,b1,b2,b3,b4,b5,b7,t,R,global_mid_temp)
  %by using a if command we are going to calculate the entropy values for low and high temparatures
  if t>=global_mid_temp

   S=R*(a1.*log(t)+a2.*t+a3.*t.^2./2+a4.*t.^3./3+a5.*t.^4./4+a7);

 else
   S=R*(b1.*log(t)+b2.*t+b3.*t.^2./2+b4.*t.^3./3+b5.*t.^4./4+b7);
  endif
endfunction


function plotting(Cp,H,S,t,name)
  %by using mkdir and cd command we are going to create a separate folder for each species
  cd(pwd)
  dir_name=name;

  mkdir(dir_name);

  %plots for the Cp,H,S

  figure(1)
  plot(t,Cp,'linewidth',3,'color','r')
  title(sprintf('specific_heat vs Temparature for %s:',name))
  xlabel('Temparature')
  ylabel('specific_heat')
  grid on

  figure(2)

  plot(t,H,'linewidth',3,'color', 'b')

 title(sprintf('enthalpy vs Temparature for %s:',name))
 xlabel('Temparature')
 ylabel('enthalpy')
 grid on;

 figure(3)

 plot(t,S,'linewidth',3,'color','g')
 title(sprintf('entropy va Temparature for %s:',name))
 xlabel('Temparature')
 ylabel('entropy')
 grid on;
 cd(dir_name)

 saveas(1,'Cp_vs_t.png')
 saveas(2,'H_vs_t.png')
 saveas(3,'S_vs_t.png')

 chdir ...


endfunction


function [mw]=mol_wt(name)
 %storing the atoms available the the sheet into a array

  S=['H' 'C' 'N' 'O' 'A' 'S'];
  fprintf('mol_wt_of');
  fprintf( name);
  fprintf(' : ');

  %atomict_wt_of each individuals

  atomic_weight= [1 12 14 16 40 32];

  mw=0;
  %by using the for loop and strcmp command we are going to match the details of array and thermo data

for i=1:length(name)
    for j=1:length(S)
      if (strcmp(name(i),S(j)))
        mw=mw+atomic_weight(j);
        %storing the positoin of matched element
        k=j;
      end
    end
    n = str2num(name(i));
    if (n>1)
      mw=mw+atomic_weight(k)*(n-1);
    end


end

fprintf('%d',mw);
disp(' ');
end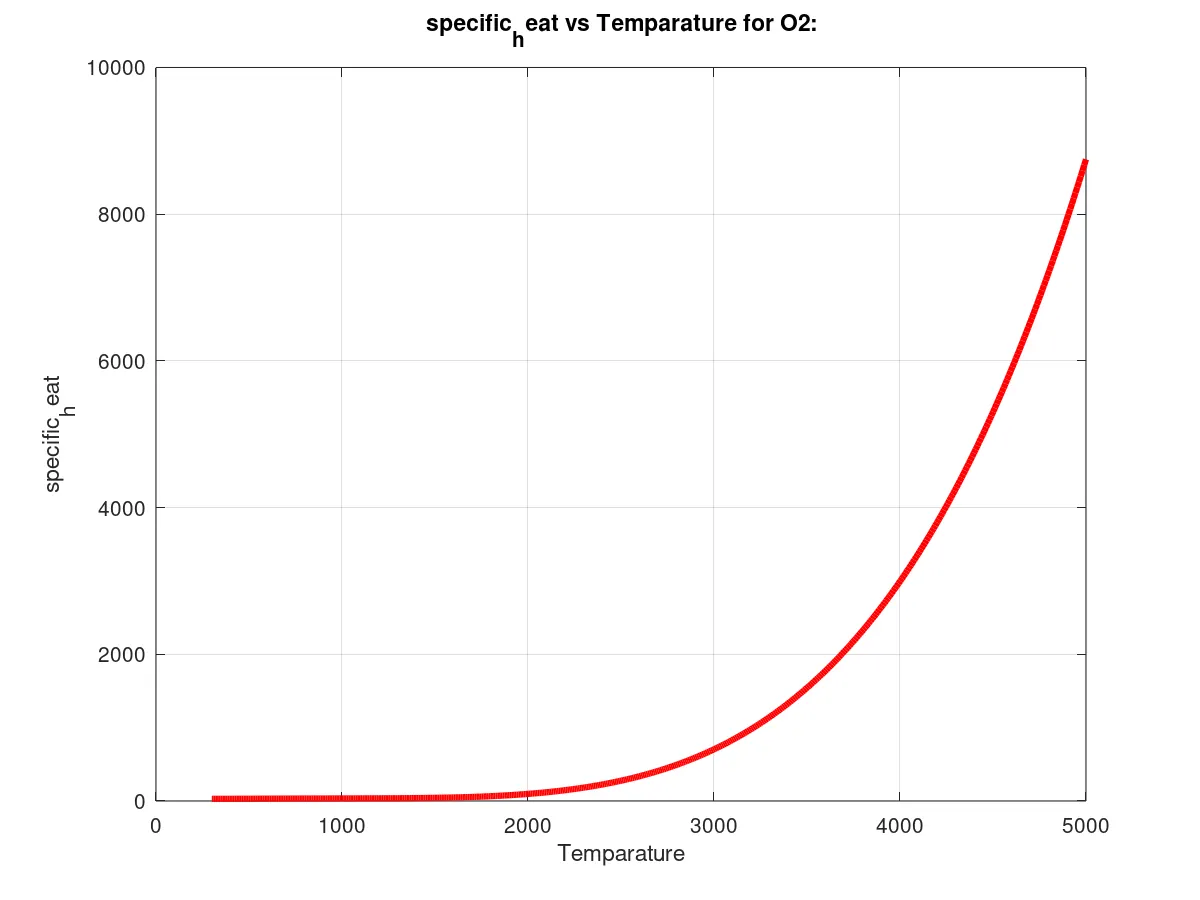
references: online material of solomon has been taken as a reference.