Parsing NASA thermodynamic data using MATLAB
AIM:-
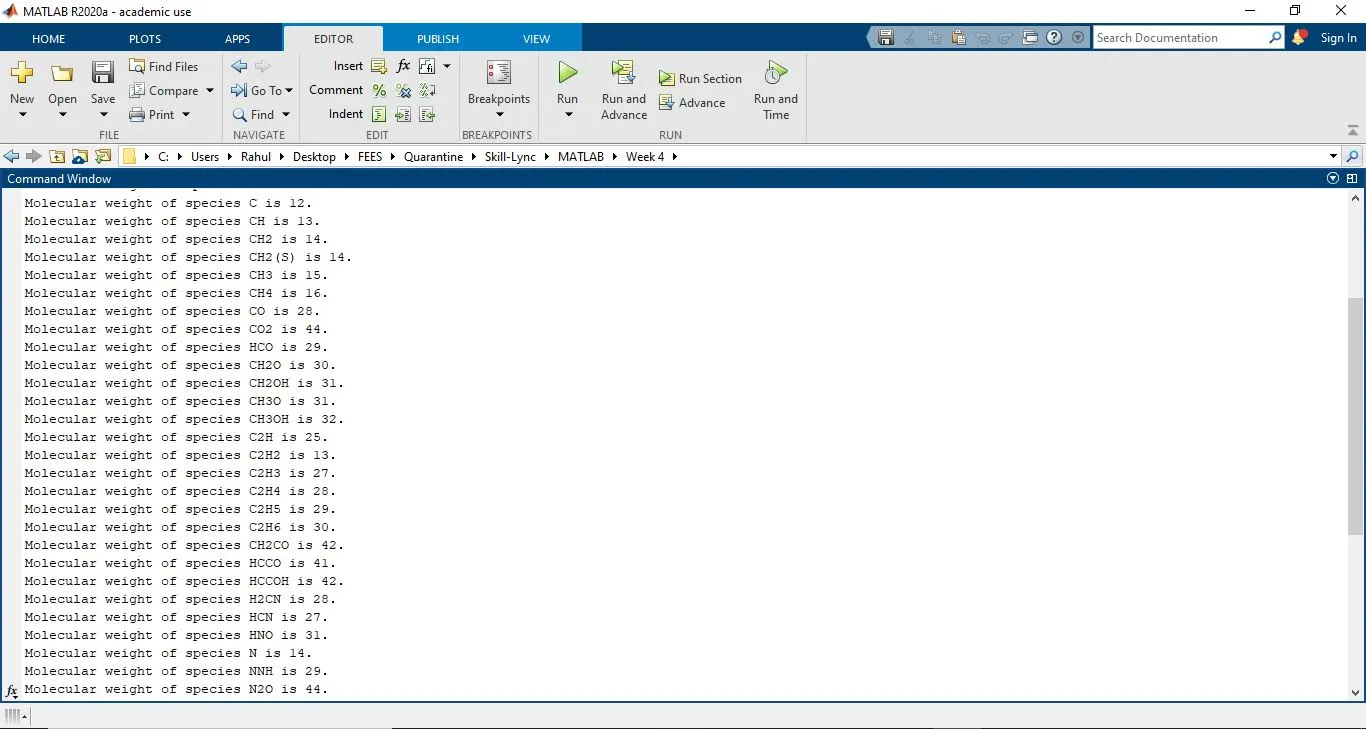
To develop a program that will parse the NASA Thermodynamic data file and calculate the specific heat, entropy, and enthalpy values for each of the species within their respective local temperature ranges and store their plots with respect to temperature in separate folders. The molecular weight of each of the species is also to be displayed on the command window.
INTRODUCTION/THEORY:-
The NASA Thermodynamic Data file contains the coefficients and local temperature ranges for a range of species (here, 53). There are 14 coefficients for each of the species and the first 7 of them are applicable in the high-temperature range (from the middle to upper bound temperatures that are given in the first line of each species' block) and the later 7 (from a8 to a14) are applicable in the low-temperature range (the limits of the range from lower bound to middle temperatures are also provided in the first line of each species' block).
The values of specific heat, entropy, and enthalpy vary with temperature, and the coefficients provided are used to calculate these values in their local temperature ranges using the following formulas:
For specific heat
`C_p /R = a_1 + a_2*T+a_3*T^2+a_4*T^3+a_5*T^4`
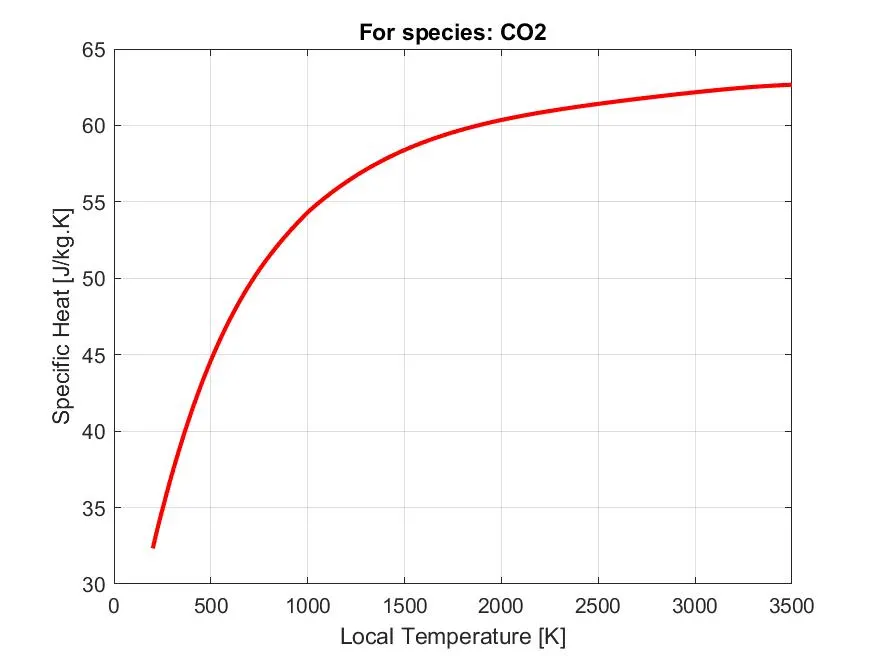
Specific Heat (C_p) is a property of the substance that indicates the amount of heat that must be added to unit m`h/(R*T) = a_1+(a_2*T)/2+(a_3*T^2)/3+(a_4*T^3)/4+(a_5*T^4)/5+a_6/T`ass of the substance to raise its temperature by 1 unit.
For entropy
`s/R = a1*logT+a_2*T+(a_3*T^2)/2+(a_4*T^3)/3+(a_5*T^4)/4+a+7`
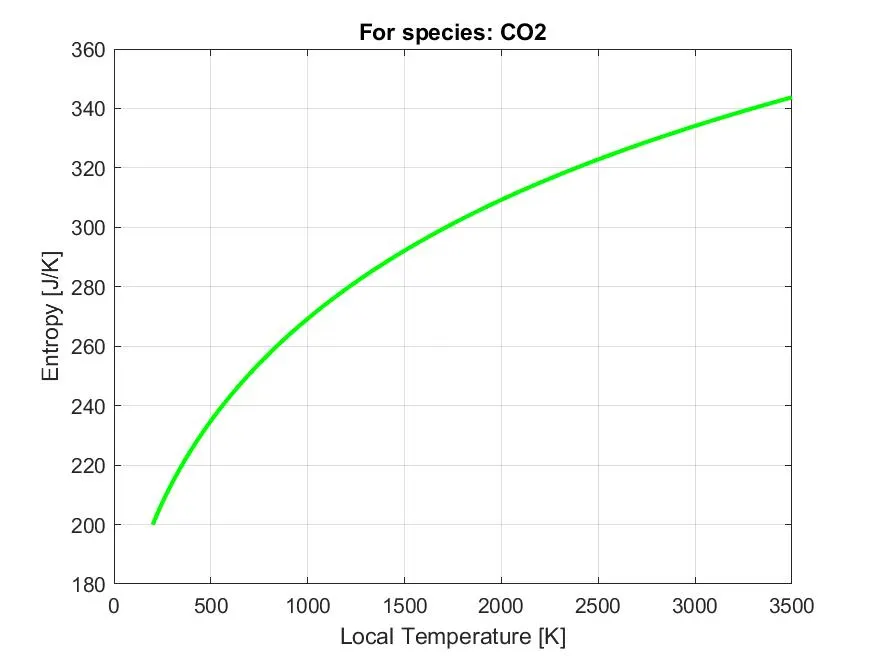
Entropy (s) is a property of the substance that indicates the amount of thermal energy that is unavailable to do work per unit temperature.
For enthalpy
`h/(R*T) = a_1+(a_2*T)/2+(a_3*T^2)/3+(a_4*T^3)/4+(a_5*T^4)/5+a_6/T`
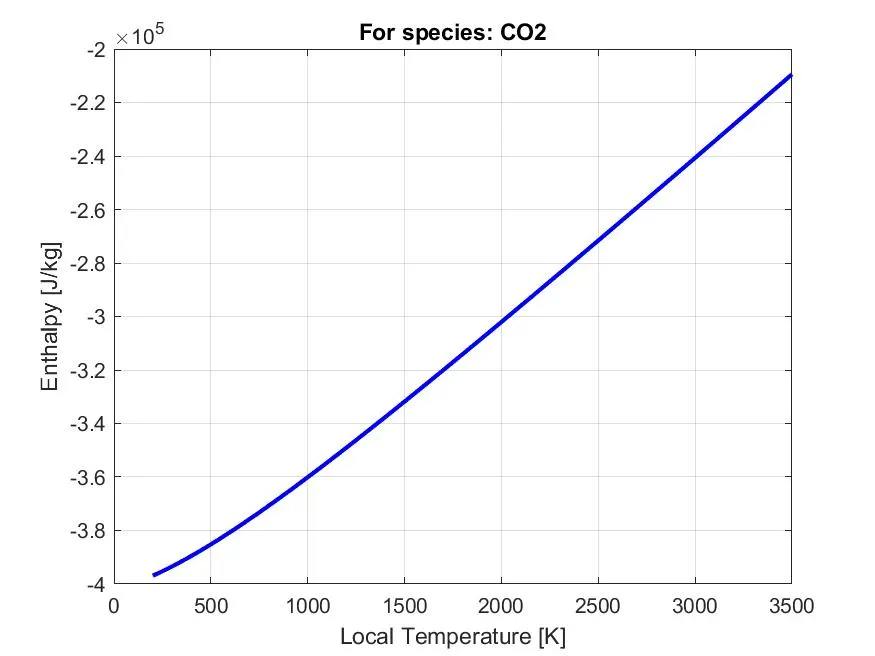
Enthalpy (h) is defined as the sum of the internal energy and product of pressure and volume. Essentially it is a measure of the thermal energy that the substance contains at a particular temperature.
All of the above formulas are representing the formulas for the high local temperature range and
R is the universal gas constant
T is the temperature value within the local temperature range
STEPS:-
For the main code
- The code starts by accessing the data from the THERMO.dat data file containing the NASA Thermodynamic data using fopen command.
f1 = fopen('THERMO.dat','r');
fgetl(f1)
The fgetl(f1) command is used to skip the title of the file. - In the header section, the global temperatures are obtained from the header file using the strsplit command
temp_str = fgetl(f1);
A = strsplit(temp_str,' ');global_low_temp = str2num(A{2});
global_med_temp = str2num(A{3});
global_high_temp = str2num(A{4});
Then the length of the header is gauged using a for loop by checking for the '!' at the end of the line.
for i = 1:3
B = fgetl(f1);
if B(1) == '!'
continue
end
disp(['missing data line: ' num2str(i+2)])
end
This loop indicates once it goes past the header block by displaying each of the species data lines missed and can be corrected so we arrive at the beginning of the species block. - In the species block
First, the number of lines are calculated using another for loop and checking for the 'END' line in the data file
species_length = 1;
for i = 1:Inf
C = fgetl(f1);
TF = startsWith(C,"END");
if TF == 1
break
end
species_length = species_length+1;
end
This is used to calculate the number of species in the species block by
num_species = (species_length-1)/4; - Then we reset to the beginning of the species block using the frewind command
%%To reset to the top of the data file
frewind(f1)
fgetl(f1);
%%To skip the header block
for i = 1:4
fgetl(f1);
end - Now the rest of the code is run within a for loop that runs from 1 to the number of species in the species block and within the loop each of the calculations required for each of the species is carried out one by one.
In the first line of the each species we first get the species name:
name_holder = q(1:9);
name_holder = deblank(name_holder);%To remove blank spaces
species_name = name_holder;
Then the local low, medium, and high-temperature bounds are obtained using
l = length(q);
T_low = q(l-31:l-24);
T_low = str2num(T_low);
T_mid = q(l-12:l-4);
T_mid = str2num(T_mid);
T_high = q(l-22:l-14);
T_high = str2num(T_high);
And then the local temperature range (local_temp) is obtained using the linspace command
local_temp = linspace(T_low,T_high,1000); - To get the coefficients, molecular weights, specific heat, entropy and enthalpy separate functions are used which are accessed for each species one by one within each iteration of the loop.
- A new directory is created for each species using the mkdir function that is named after the species
foldername = sprintf('%s',species_name);
mkdir(foldername) - The plots are made from the data produced from the respective functions and the figures are saved as jpg files with the name of the file indicating the data being plotted and the species that the data represents. These plots are then stored in each species' respective folder using the following code
saveas(figure(1),[pwd (sprintf('/%s/Specific_heat_(%s).jpg',foldername,foldername))])
clear all
close all
clc

%Inputs
R = 8.314;

%To access the Thermodynamics data file
f1 = fopen('THERMO.dat','r');
fgetl(f1);

%For the header
%To store the temperatures from the header

temp_str = fgetl(f1);
A = strsplit(temp_str,' ');

global_low_temp = str2num(A{2});
global_med_temp = str2num(A{3});
global_high_temp = str2num(A{4});

%To skip the comments in the header
for i = 1:3
    B = fgetl(f1);
    if B(1) == '!'
        continue
    end
    disp(['missing data line: ' num2str(i+2)])
end
%The output shows "missing data line: 6" which implies that the i should range till i=3 since there is data
%available in the line when i = 4 implying that we have entered the species
%block

%For the species block

%To calculate the number of species in the species block

%Let species_length be the number of lines in the species block
species_length = 1;
for i = 1:Inf
    C = fgetl(f1);
    TF = startsWith(C,"END");
    if TF == 1
        break
    end
    species_length = species_length+1;
end
%Since we know that each species takes 4 lines. Let the number of species
%be num_species
num_species = (species_length-1)/4;


%%To reset to the top of the data file
frewind(f1)
fgetl(f1);
%%To skip the header block
for i = 1:4
    fgetl(f1);
end

%To parse data species-wise from the species block

for i = 1:num_species
    q = fgetl(f1);

    %To get the species name
    name_holder = q(1:9);
    name_holder = deblank(name_holder);%To remove blank spaces
    species_name = name_holder;

    %To get the local low and high temperature ranges
    l = length(q);
    T_low = q(l-31:l-24);
    T_low = str2num(T_low);
    T_mid = q(l-12:l-4);
    T_mid = str2num(T_mid);
    T_high = q(l-22:l-14);
    T_high = str2num(T_high);

    HT_range = linspace(T_mid,T_high,500);%High Temperature Range
    LT_range = linspace(T_low,T_mid,500);%Low Temperature Range

    local_temp = linspace(T_low,T_high,1000);

    %To get the coefficients
    for i = 1:3
        tline{i} = fgetl(f1);
    end

    coeffs = coefficients(tline);


    %To get the value of :-
    coeffs = cell2mat(coeffs);

    %Specific Heat
    for i = 1:length(local_temp)
        cp(i) = specific_heat(coeffs,local_temp,T_mid,i,R);
    end

    %Enthalpy
    for i = 1:length(local_temp)
        h(i) = enthalpy(coeffs,local_temp,T_mid,i,R);
    end
    %Entropy
    for i = 1:length(local_temp)
        s(i) = entropy(coeffs,local_temp,T_mid,i,R);
    end

    %To calculate and display molecular weight

    MolWt = molecular_weight(species_name);
    D = sprintf('Molecular weight of species %s is %d.',species_name,MolWt);
    disp(D)

    %Make a new directory
    foldername = sprintf('%s',species_name);
    mkdir(foldername)


    %Plots

    %Specific heat v local temperature
    figure(1)
    plot (local_temp,cp,'linewidth',2,'color','r')
    grid on
    xlabel('Local Temperature [K]')
    ylabel('Specific Heat [J/kg.K]')
    title("For species: "+species_name)
    saveas(figure(1),[pwd (sprintf('/%s/Specific_heat_(%s).jpg',foldername,foldername))])


    %Enthalpy v local temperature
    figure(2)
    plot (local_temp,h,'linewidth',2,'color','b')
    grid on
    xlabel('Local Temperature [K]')
    ylabel('Enthalpy [J/kg]')
    title("For species: "+species_name)
    saveas(figure(2),[pwd (sprintf('/%s/Enthalpy_(%s).jpg',foldername,foldername))])

    %Entropy v local temperature
    figure(3)
    plot (local_temp,s,'linewidth',2,'color','g')
    grid on
    xlabel('Local Temperature [K]')
    ylabel('Entropy [J/K]')
    title("For species: "+species_name)
    saveas(figure(3),[pwd (sprintf('/%s/Entropy_(%s).jpg',foldername,foldername))])


end
For the coefficients function
- For this function, the 3 lines containing the coefficients are stored in the cell tline are taken as input from the main code to the function and there a for loop is used to extract the coefficients
- The findstr command is used to find the number of E terms (E stands for times 10 raised to the power) since each coefficient has one of them and using the position of these E characters in each of the lines stored in the tline cell the coefficients positions are calculated and used to access them. Then once the number of coefficients in a line has been extracted it moves to the next line in the tline cell using the following code
- The ctr variable keeps track of the number of coefficients extracted from the line and once it has extracted all of them is reset to 1 using an if condition.
function [coeffs] = coefficients(tline) ctr = 1; k = 1; for i = 1:14 d = findstr(tline{k},'E'); if ctr == 1 coeffs{i} = tline{k}(1:d(ctr)+3); coeffs{i} = str2num(coeffs{i}); else coeffs{i} = tline{k}(d(ctr-1)+4:d(ctr)+3); coeffs{i} = str2num(coeffs{i}); end ctr = ctr + 1; if ctr == length(d)+1 && i ~= 14 ctr = 1; k = k + 1; end end
For specific heat function
- For the specific heat function, the inputs taken from the main code are the coefficients (coeffs), the local temperature range (local_temp), the local medium temperature (T_mid), the for loop iterator i and the value of R which is the universal gas constant.
- The coefficients are extracted from the coeffs matrix and classified from a1 to a14, then the above formula is implemented while using if conditions to take the appropriate formula according to whether it is in the low or high local temperature range (which is done using the local medium temperature).
- The for loop iterator i from the main code is taken in order to access the relevant local temperature value from the local temperatature range (local_temp)
function [cp] = specific_heat(coeffs,local_temp,T_mid,i,R)

%Defining the coefficients
a1 = coeffs(1);
a2 = coeffs(2);
a3 = coeffs(3);
a4 = coeffs(4);
a5 = coeffs(5);
a6 = coeffs(6);
a7 = coeffs(7);
a8 = coeffs(8);
a9 = coeffs(9);
a10 = coeffs(10);
a11 = coeffs(11);
a12 = coeffs(12);
a13 = coeffs(13);
a14 = coeffs(14);

%Defining the temperature variable
T = local_temp(i);

%To calculate the specific heat
if (T <= T_mid)
    cp = (a8 + a9*T + a10*(T^2) + a11*(T^3) + a12*(T^4))*R;
elseif T > T_mid
    cp = (a1 + a2*T + a3*(T^2) + a4*(T^3) + a5*(T^4))*R;
end
end
For the enthalpy function
- The enthalpy function also takes the same inputs from the main code as the specific heat function.
- The coefficients are extracted and stored in their respective variables similar to how it was done in the specific heat function.
- And similarly the appropriate formula is implemented while ensuring whether the temperature value is in the low or high local temperature range.
function [h] = enthalpy(coeffs,local_temp,T_mid,i,R)

%Defining the coefficients
a1 = coeffs(1);
a2 = coeffs(2);
a3 = coeffs(3);
a4 = coeffs(4);
a5 = coeffs(5);
a6 = coeffs(6);
a7 = coeffs(7);
a8 = coeffs(8);
a9 = coeffs(9);
a10 = coeffs(10);
a11 = coeffs(11);
a12 = coeffs(12);
a13 = coeffs(13);
a14 = coeffs(14);

%Defining the temperature variable
T = local_temp(i);

%To calculate the enthalpy
if (T <= T_mid)
    h = (a8 + a9*(T/2) + a10*(T.^2)/3 + a11*(T.^3)/4 + a12*(T.^4)/5+ a13/T)*R*T;
elseif T > T_mid
    h = (a1 + a2*(T/2) + a3*(T.^2)/3 + a4*(T.^3)/4 + a5*(T.^4)/5+ a6/T)*R*T;
end
end
For the entropy function
- This also takes the same inputs as the previous 2 functions and classifies the coefficients into their respective variables from the coefficient matrix.
- Also, similar to the previous cases the appropriate formulas as shown in the introduction are implemented while checking (using if conditions) the local temperature value to check whether they fall within the low or high locacl temperature ranges.
function [s] = entropy(coeffs,local_temp,T_mid,i,R)

%Defining the coefficients
a1 = coeffs(1);
a2 = coeffs(2);
a3 = coeffs(3);
a4 = coeffs(4);
a5 = coeffs(5);
a6 = coeffs(6);
a7 = coeffs(7);
a8 = coeffs(8);
a9 = coeffs(9);
a10 = coeffs(10);
a11 = coeffs(11);
a12 = coeffs(12);
a13 = coeffs(13);
a14 = coeffs(14);

%Defining the temperature variable
T = local_temp(i);

%To calculate the enthalpy
if (T <= T_mid)
    s = (a8*log(T) + a9*(T) + a10*(T.^2)/2 + a11*(T.^3)/3 + a12*(T.^4)/4 + a14)*R;
elseif T > T_mid
    s = (a1*log(T) + a2*(T) + a3*(T.^2)/2 + a4*(T.^3)/3 + a5*(T.^4)/4 + a7)*R;
end
end
For the molecular weight function
- In this function, only the species name is taken from the main code.
- The code uses the findstr command to search for H, C, N and O representing the elements and then adds their corresponding atomic mass to the molecular weight for each of these elements.
- Then it checks for any number from 1 to 9 in the species name using findstr, indicating multiple of a particular element. Then it searches for the element adjacent to the number to find out which element has multiple contributions and then adds the corresponding atomic mass using if conditions.
function [MolWt] = molecular_weight(species_name)

MolWt = 0;
%Search the species name for

%Hydrogen
h = findstr(species_name,'H');
if length(h) ~= 0
    MolWt = MolWt + 1*length(h);
end

%Carbon
c = findstr(species_name,'C');
if length(c) ~= 0
    MolWt = MolWt + 12*length(c);
end

%Nitrogen
n = findstr(species_name,'N');
if length(n) ~= 0
    MolWt = MolWt + 14*length(n);
end

%Oxygen
o = findstr(species_name,'O');
if length(o) ~= 0
    MolWt = MolWt + 16*length(o);
end

%To account for the numbers included in the chemical name
    for j = 1:9
        n = findstr(species_name, (sprintf('%d',j)));
        check = species_name(n-1);
        if check == 'H'
            MolWt = MolWt + 1*(j-1);
        elseif check == 'C'
            MolWt = MolWt + 12*(j-1);
        elseif check == 'N'
            MolWt = MolWt + 14*(j-1);
        elseif check == 'O'
            MolWt = MolWt + 16*(j-1);
        end
    end
end
Sample plots for
CO2
Enthalpy
Entropy
Specific Heat
Command window displaying the molecular weight of each species