Parsing NASA thermodynamic data using MATLAB
AIM:-
1)Write a function that extracts the 14 co-efficients and calculates the enthalpy, entropy and specific heats for all the species in the data file.
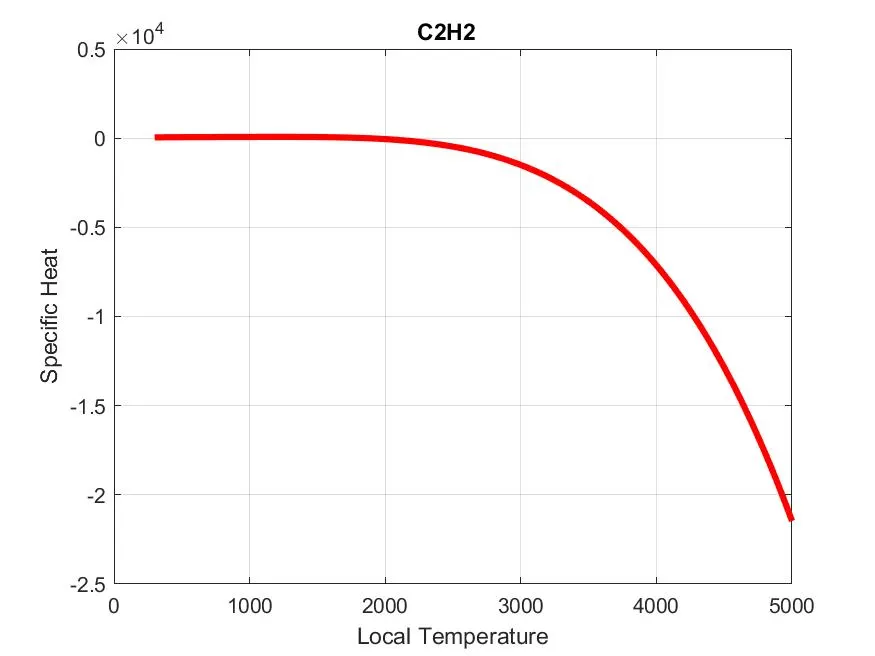
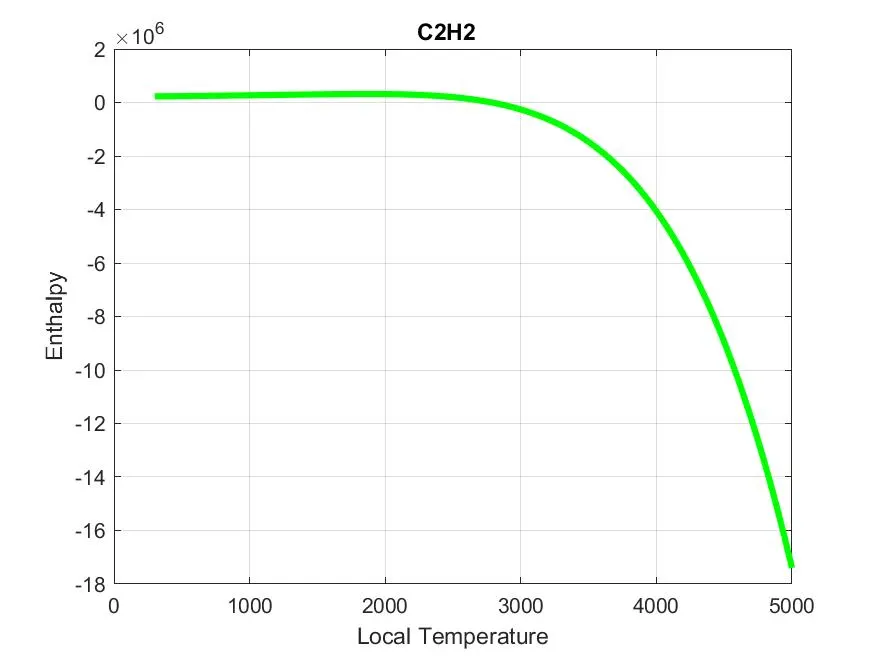
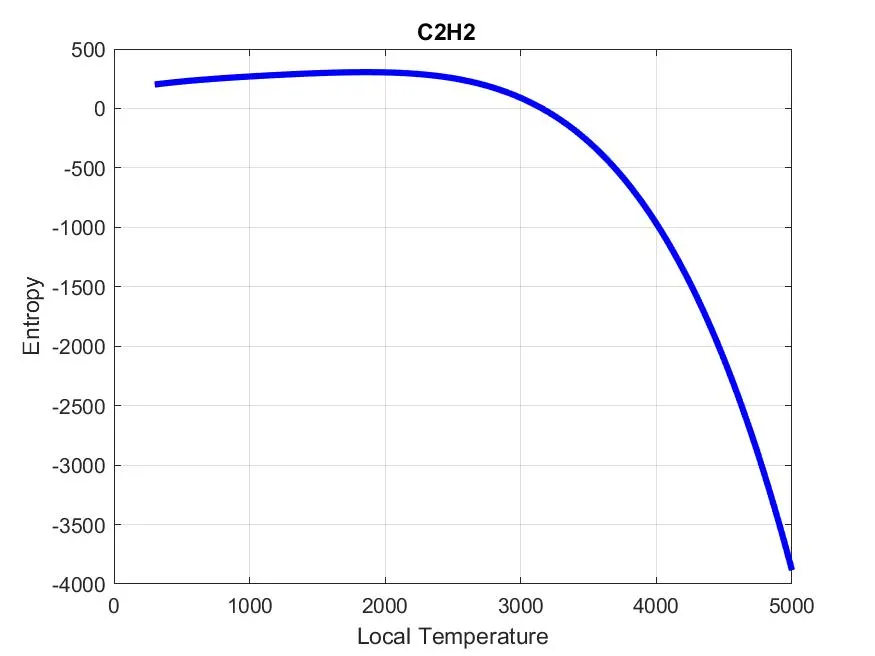
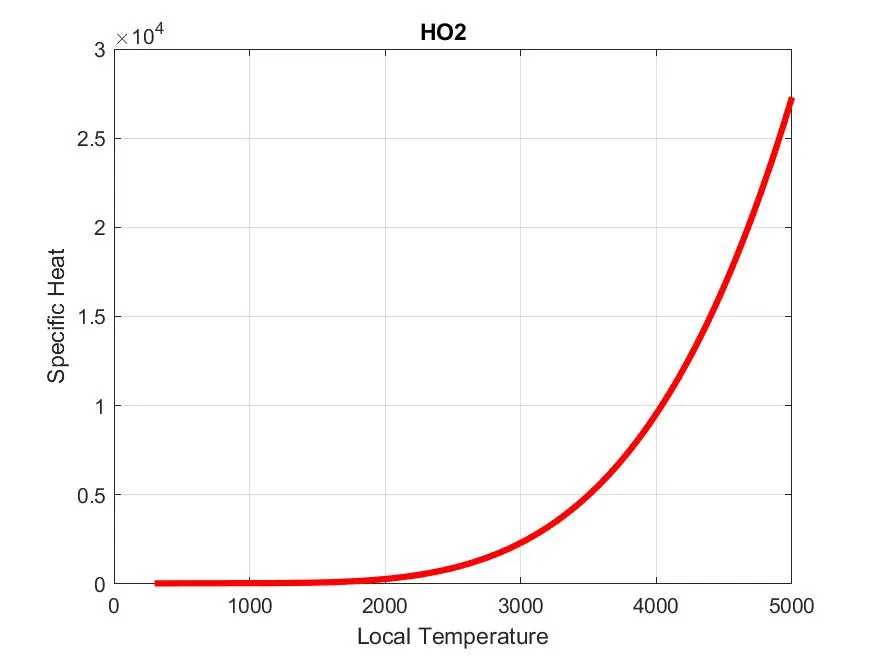
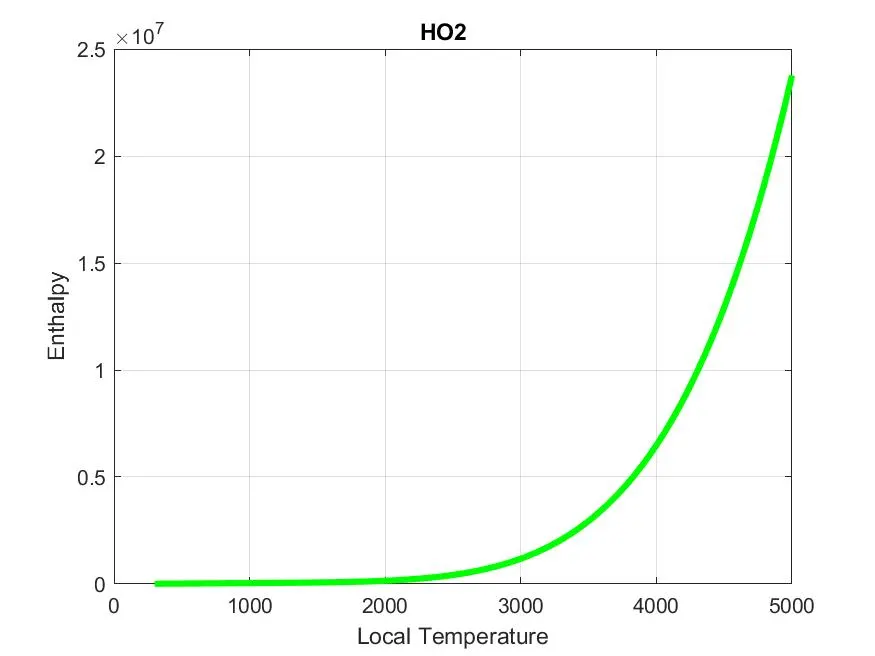
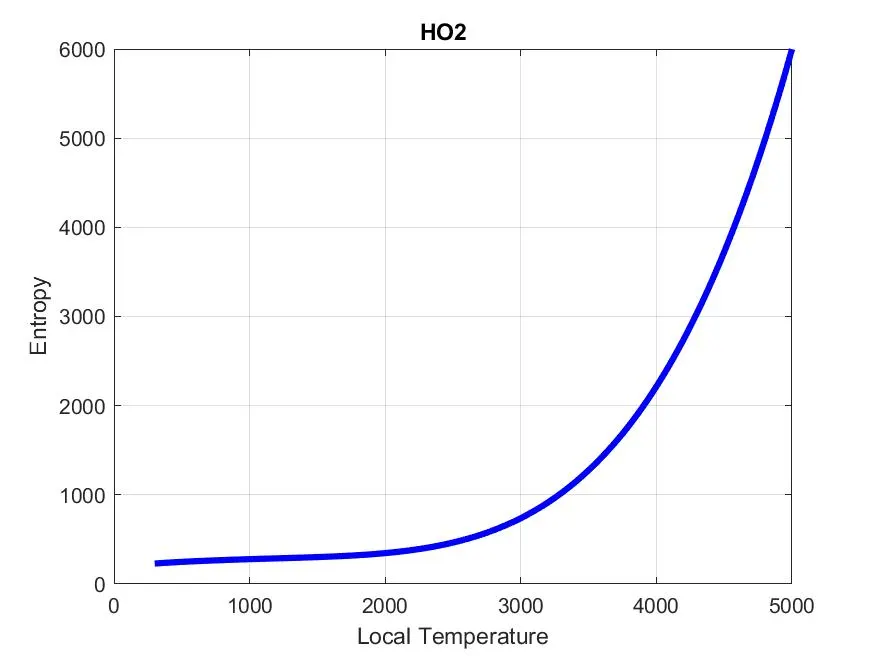
2)Plot the Cp, Enthalpy and Entropy for the local temperature range (low temperature : high temperature) specific for each species.
3)Calculate the molecular weight of each species and display it in the command window.
THEORY:-
1)File Parsing:-
Parsing in computer languages refers to syntactic analysis of the input code into its components parts in order to facilitate the writing of compilers and interpreters. It can be used to describe split or separation.
Parsing a file means reading in a data stream of some sort and building an in memory model of the semantic content of that data. This aims at facilitating perfoming some kind of transformation on the data.
2)Specific Heat(Cp):-
The specific heat capacity, of a substance is the heat capacity of a sample of the substance divided by the mass of the sample. Unit is J/k.
3)Entropy(S):-
It is a thermodynamic quantity representing the unavailability of a system's thermal energy for conversion into mechanical work, often interpreted as the degree of disorder or randomness in the system. Unit is J/K.
4)Enthalpy(H):-
It is a thermodynamic quantity equivalent to the total heat content of a system. It is equal to the internal energy of the system plus the product of pressure and volume. Unit is J or BTU or Calorie.
CODE:-
clear all
close all
clc

FP=fopen('THERMO.dat','r');
%For Header
fgetl(FP)
%For Global Temperature Values
tline=fgetl(FP);
%For Comment 1
fgetl(FP)
%For Comment 2
fgetl(FP)
%For Comment 3
fgetl(FP)

%Converting Values of Global Temp from string to Integers
A=strsplit(tline,' ');
Global_Low_Temp=str2num(A{2});
Global_Mid_Temp=str2num(A{3});
Global_High_Temp=str2num(A{4});

%Reading of Species
for i = 1:53
    Header=fgetl(FP);
    x=strsplit(Header,' ');
    Species_name = Header(1:6);

    Name = (x{1});
    t=length(x);
    Local_low_Temp=str2double(x{t-3});
    Local_High_Temp=str2double(x{t-2});
    Local_mid_Temp=str2double(x{t-1});

    t1 =  Local_low_Temp;
    t2 =  Local_mid_Temp;
    t3 =  Local_High_Temp;

    %Coefficients of Line 1 (a1 to a5)
    line1 = fgetl(FP);
    a = strfind(line1,'E');
    a1 = str2double(line1(1:a(1)+3));
    a2 = str2double(line1(a(1)+4 :a(2)+3));
    a3 = str2double(line1(a(2)+4 :a(3)+3));
    a4 = str2double(line1(a(3)+4 :a(4)+3));
    a5 = str2double(line1(a(4)+4 :a(5)+3));

    %Coefficients of Line 2 (a6 to a10)
    line2=fgetl(FP);
    a_2 = strfind(line2,'E');
    a6 = str2double(line2(1:a_2(1)+3));
    a7 = str2double(line2(a_2(1)+4 : a_2(2)+3));
    a8 = str2double(line2(a_2(2)+4 : a_2(3)+3));
    a9 = str2double(line2(a_2(3)+4 : a_2(4)+3));
    a10 = str2double(line2(a_2(4)+4 : a_2(5)+3));

    %Coefficients of Line 3 (a11 to a14)
    line3=fgetl(FP);
    a_3 = strfind(line3,'E');
    a11 = str2double(line3(1 : a_3(1)+3));
    a12 = str2double(line3(a_3(1)+4 : a_3(2)+3));
    a13 = str2double(line3(a_3(2)+4 : a_3(3)+3));
    a14 = str2double(line3(a_3(3)+4 : a_3(4)+3));

    %Creating folders for the species
    mkdir(['C:UsersDELLFileParsingSpecies',Name]);
    %Universal Gas Constant
    R = 8.314;
    % Temperature Values
    Temp = linspace(300,5000,500);

    %Cp , H , S calculations
    for j = 1:length(Temp)
        if Temp(j)<3000
            Cp = (a1 + a2.*Temp + a3.*Temp.^2 + a4.*Temp.^3 + a5.*Temp.^4).*R;
            H = (a1 + (a2.*Temp)./2 + (a3.*Temp.^2)/3 + (a4.*Temp.^3)/4 + (a5.*Temp.^4)/5 + a6./Temp).*Temp.*R;
            S = (a1*log(Temp) + a2.*Temp + (a3.*Temp.^2)/2 + (a4.*Temp.^3)/3 + (a5.*Temp.^4)/4 + a7).*R;

        else Temp(j)>3000;
             Cp = (a8 + a9.*Temp + a10.*Temp.^2 + a11.*Temp.^3 + a12.*Temp.^4).*R;
             H = (a8 + (a9.*Temp)./2 + (a10.*Temp.^2)/3 + (a11.*Temp.^3)/4 + (a12.*Temp.^4)/5 + a13./Temp).*Temp.*R;
             S = (a8*log(Temp) + a9.*Temp + (a10.*Temp.^2)/2 + (a11.*Temp.^3)/3 + (a12.*Temp.^4)/4 + a14).*R;
        end
    end
   %Plotting of Graphs

   %Temp Vs Specific Heat
   figure(1)
   plot(Temp,Cp,'linewidth',3,'color','r');
   grid on
   title(Species_name);
   xlabel('Local Temperature');
   ylabel('Specific Heat');

   %Temp Vs Enthalpy
   figure(2)
   plot(Temp,H,'linewidth',3,'color','g');
   grid on
   title(Species_name);
   xlabel('Local Temperature');
   ylabel('Enthalpy');

   %Temp Vs Entropy
   figure(3)
   plot(Temp,S,'linewidth',3,'color','b');
   grid on
   title(Species_name);
   xlabel('Local Temperature');
   ylabel('Entropy');

   %Save the plots
   saveas(1,'TempVsCp.jpg');
   saveas(2,'TempVsH.jpg');
   saveas(3,'TempVsS.jpg');

   %Folder for plots
   directory = (['C:UsersDELLFileParsingSpecies',Name]);
   cd(directory)

   [X] = molecular_mass(Species_name);
end
fclose(FP);
a) For File Parsing:-
1)First we need to open the THERMO.dat file. fopen in used to accomplish that requirement.
2)To parse the first line we use the fgetl command. For successive lines we still use the fgetl command.
3)There are 53 species .And to calculate the Cp, H and S for all the species we use the for loop.
4)The first fgetl command gives us the species name. Next we need to calculate the local temperature values of each species. We see that the local temperatures are in the same line as the species name. Hence we use the strsplit command to split the string and parse the local temperatures. We use curly brackets to denote the index of the temperatures and acquire them. We store the temperatures in various variables for proper organization.
5)We need to keep all the names of the species and for that we use our species fgetl file(in this programme, the variable Header is used) to get all the names of the species.
6)Next we need to acquire all the coefficients of the elements. The first 7 coefficients(a1 to a7) represent the high temperature values and the next 7 coefficients(a8 to a14) represent the low temperature values. We use fgetl to parse the line for the first 5 coefficients and we need to find the index of E(exponential). We use strfind for that purpose. For converting the coefficients from string to number we use STR2DOUBLE. It converts the text in str to double precision values. We repeat this process for all the 3 lines and all the remaining coefficients.
7)We create a folder to store all the species and their values. For that we use the mkdir to make a new folder and specify the location to store the files.
8)We need to calculate the values of Cp,H,S for two temperature ranges, that is (Temp>3000 and Temp<3000). Here 3000 is the medium local temperature. Whereas Temp contains an array temperature from the low local temperature and the high local temperature of the species.
9)We use the if function to plug all values of Temp<3000 and the remaining values, that is, Temp>3000 in the else funtion for the respective formulas of Cp,H,S.We also specify the value of Universal Gas Constant R.
10)We plot the graphs for the all the species for their values of Cp,H,S and give the titles using title command. We provide the names for x and y axis using xlabel and ylabel respectively. Here, in the title command we provide the Species_name variable to plot the graphs with the name of all the species in the THERMO.dat file.
11) Finally we save all the 3 plots of all the species using the saveas fucntion and store the graphs in jpg format. We create a directory on where to store all the plots in the computer.
12)fclose(FP) is used to terminate the code and close the file.
b)For Molecular Mass:-
%Calculation of molecular Mass

function [X] = molecular_mass(Species_name)
Y = (Species_name);
%List of elements
 Elements = ['H','C','O','N','A'];

 %Atomic Mass of each element

 Atomic_Mass = [1.008,12.011,15.999,14.007,39.948];

 X=0;
 for i = 1:length(Species_name)
     for j = 1:length(Elements)
         if strcmpi(Y(i),Elements(j))
             X = X + Atomic_Mass(j)
             m = j;
         end
     end
     n = str2double(Y(i));
     if n>1
         X = X + Atomic_Mass(m)*(n-1);
     end
 end
end
1) Here is the function to calculate the molecular mass of the species.
2) Function molecular mass is defined here with the input argument of the Species_name taken in the main program.
3)We define the atomic mass and the elements that are common in all the molecules.
4) For loop is run from 1 to length of Species_name to calculate all the molecular masses of the species. A second loop is run from 1 to thr length of Elements to calculate the element masses.
5)strcmpi is used to return an array the same size as its inputs.
6) An initiator(X) is run from the 0 value. It is added to the atomic mass of each element to give the complete molecular mass of the species.
7) An if statement is used for when there are species having more than 1 molecule. n, here is converted from a string to a numeric value. Values greater than 1 are put in a variable X that calculates the total atomic mass of the species by incrementing the molecular weight.
OUTPUT:-
a)Plot:-
for C2H:-
for H2O
b)Molecular Weight
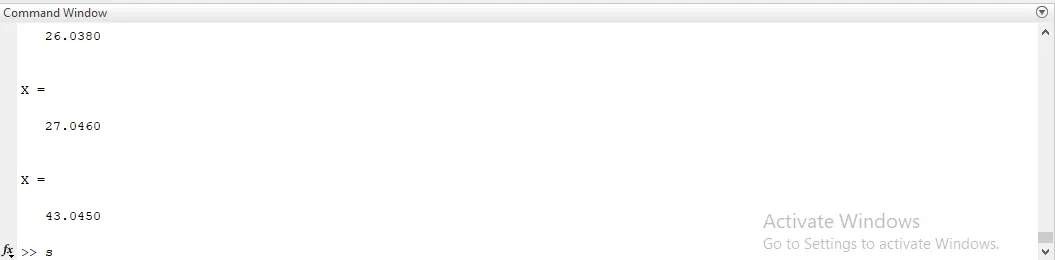
The command window contains the values of molecular masses of all the species from 1 to 53 in the particular order to that of the THERMO.dat file.
CONCLUSION:-
Using MATLAB we are able to do the file parsing of data and use that data to generate required results and relations.