Project 1 - Parsing NASA thermodynamic data
AIM: Program in MATLAB that extracts the 14 co-efficients and calculates the enthalpy, entropy and specific heats for the species(O2, N2 and CO2) in the data file.
OBJECTIVE:
- Program in MATLAB to create a function for enthalpy, entropy, sp. heat and molar weight.
- Program in MATLAB to parse the datas from 'THERMO.dat' and use new commands like strfind, str2double, etc. and explain those new commands in details.
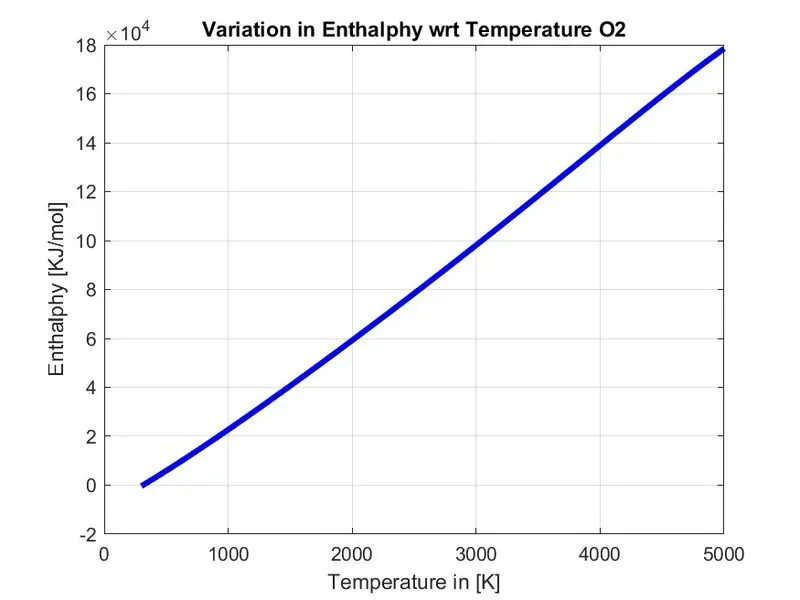
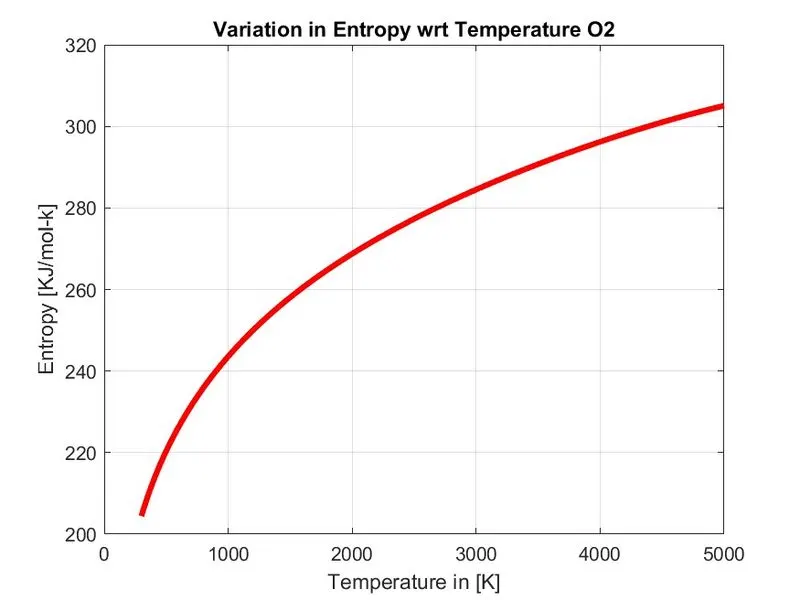
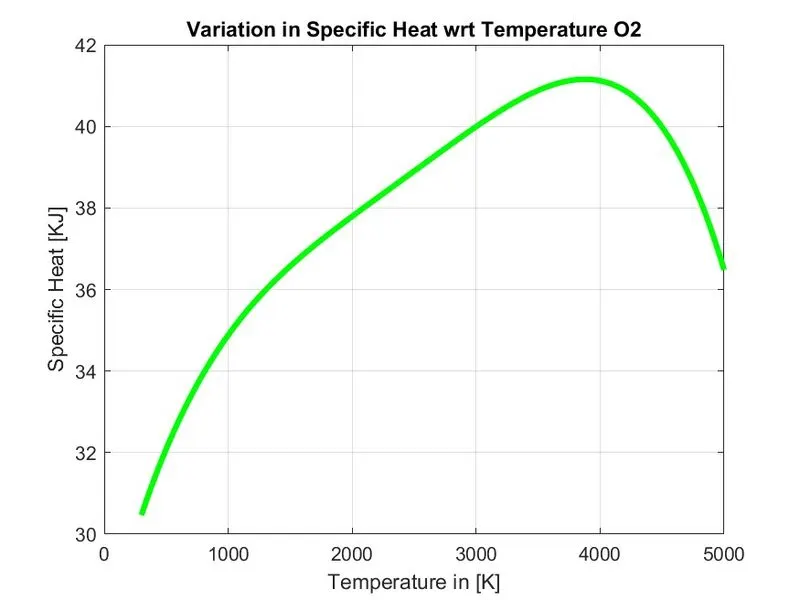
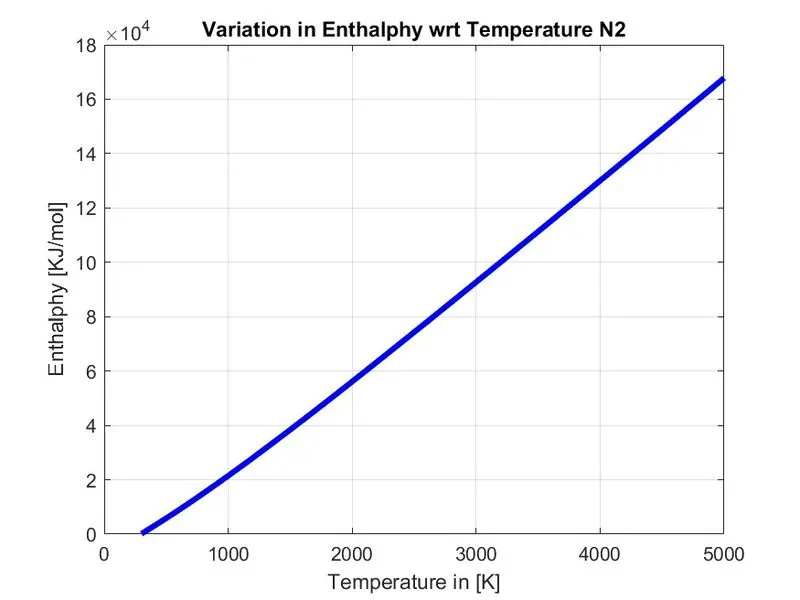
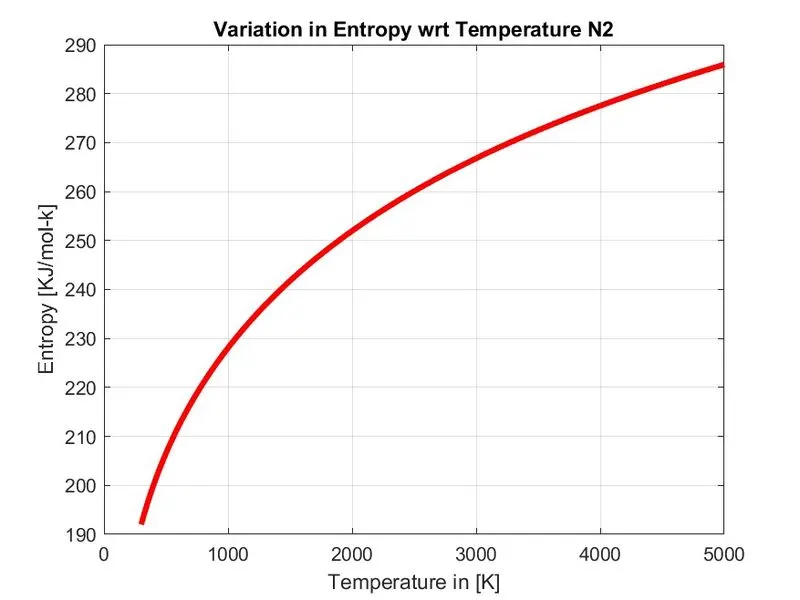
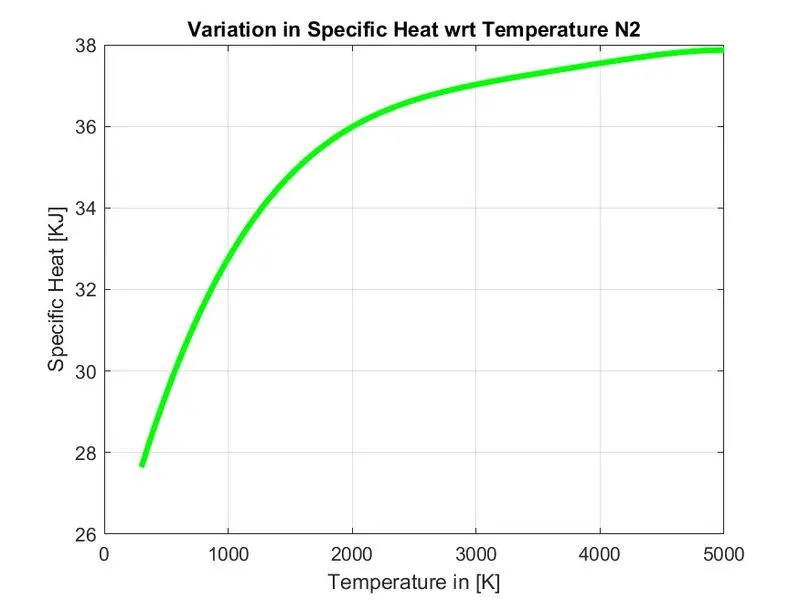
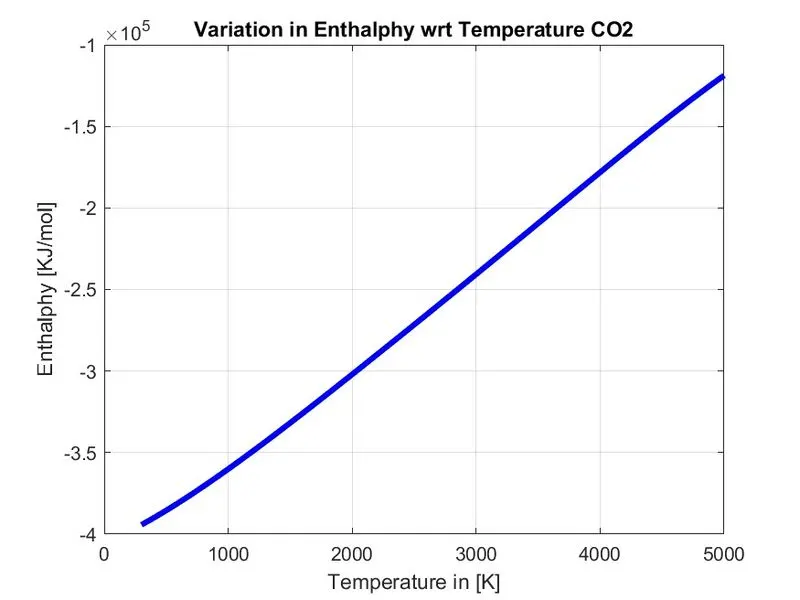
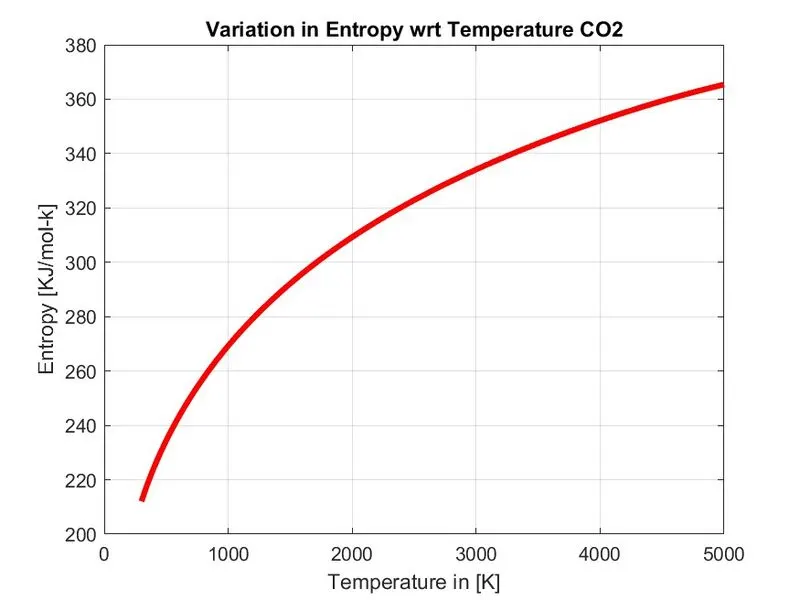
- Plot graphs for all 3 species with Temperature vs all three thermodynamic properties. Title and axes labels are a must, legends could be shown if necessary.
THEORY:
NASA came up with polynomials that can be used to evaluate thermodynamic properties such as Cp, H, and S. They have also documented the coefficients that are required to evaluate these polynomials for 1000+ species.
File Parsing is how a piece of file information can be used in a computer program. Read data from external files and databases and include that data into your calculation.
File Writing is the writing data in a particular file
FORMULAS:
Keeping R the universal gas constant, T as temperature, we get;

PROGRAMS:
Program to calculate the entropy:
function [S] = entropy_nasa(a1, a2, a3, a4, a5, a7, a8, a9, a10, a11, a12, a14, temp, gmt, r)

if(temp<=gmt) %the 1st 7 coefficients are high-temperature coefficients and the 2nd 7 coefficients are low-temperature coefficients

    S = r.*(a8.*log(temp) +(a9.*temp) +(a10*((temp).^2)/2) + (a11*((temp).^3)/3) + (a12*((temp).^4)/4) + (a14));

else
    S = r.*(a1.*log(temp) +(a2.*temp) +(a3*((temp).^2)/2) + (a4*((temp).^3)/3) + (a5*((temp).^4)/4) + (a7));

end
end
EXPLANATION:
This program has 7 lines. The line by line explanation is given below:
1) function [S] = entropy_nasa(a1, a2, a3, a4, a5, a7, a8, a9, a10, a11, a12, a14, temp, gmt, r): To declare a function loop 'entropy_nasa' that accepts variables from 'a1' to 'r'
Program to calculate the enthalpy:
function [H] = enthalpy_nasa(a1, a2, a3, a4, a5, a6, a8, a9, a10, a11, a12, a13, temp, gmt, r)

if(temp<=gmt)
    H = r*temp.*(a8 + ((a9*temp)/2) + ((a10*(temp).^2)/3) + ((a11*(temp).^3)/4) + ((a12*(temp).^4)/5) + ((a13./temp)));

else
    H = r*temp.*(a1 + ((a2*temp)/2) + ((a3*(temp).^2)/3) + ((a4*(temp).^3)/4) + ((a5*(temp).^4)/5) + ((a6./temp)));
end
end
EXPLANATION:
This program has 7 lines. The line by line explanation is given below:
1) function [H] = enthalpy_nasa(a1, a2, a3, a4, a5, a6, a8, a9, a10, a11, a12, a13, temp, gmt, r): To declare a function loop 'entropy_nasa' that accepts variables from 'a1' to 'r'
function [Cp] = spheat_nasa(a1, a2, a3, a4, a5, a8, a9, a10, a11, a12, temp, gmt, r)

if(temp<=gmt) %the 1st 7 coefficients are high-temperature coefficients and the 2nd 7 coefficients are low-temperature coefficients
    Cp = r.*(a8 +(a9.*temp) +(a10*(temp).^2) + (a11*(temp).^3) + (a12*(temp).^4));

else
    Cp = r.*(a1 +(a2.*temp) +(a3*(temp).^2) + (a4*(temp).^3) + (a5*(temp).^4));

end
end
EXPLANATION:
This program has 7 lines. The line by line explanation is given below:
1) function [Cp] = spheat_nasa(a1, a2, a3, a4, a5, a8, a9, a10, a11, a12, temp, gmt, r): To declare a function loop 'spheat_nasa' that accepts variables from 'a1' to 'r'
function [mw] = molwt_nasa(sp_name)
compound_name = (sp_name);
key_at = ['C','H','O','N','A'];
value_at = [12.0107 1.0080 15.994 14.0067 39.948]; %storing the atomic mass value in the array
mw = 0 ; %initialising molecular mass as zero
for i = 1 : length(compound_name)
for j = 1:length(key_at)
if strcmp(compound_name(i),key_at(j)) %if above comparision is true, then value of molecular mass is calculated.
mw = mw + value_at(j); %storing the position for further use
pos = j;
end
end
k = str2double(compound_name(i)); %comparing if the value of k is greater than executed the further statements
if(k>1)
mw = mw + value_at(pos)*(k-1);
end
end
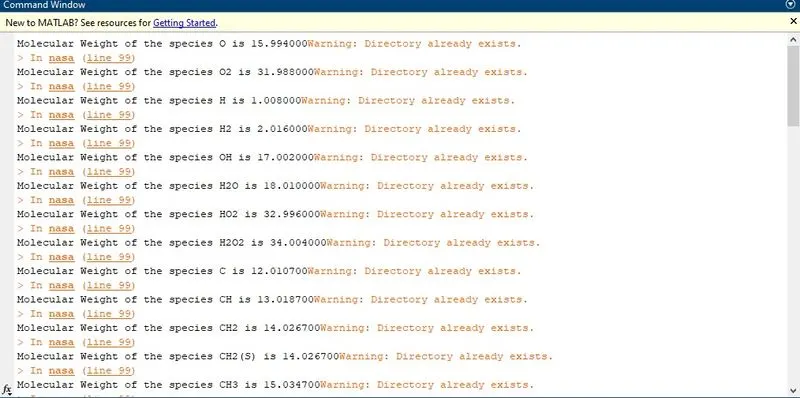
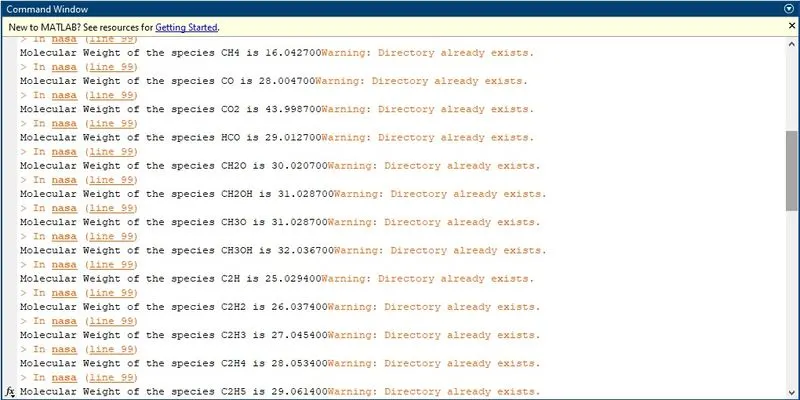
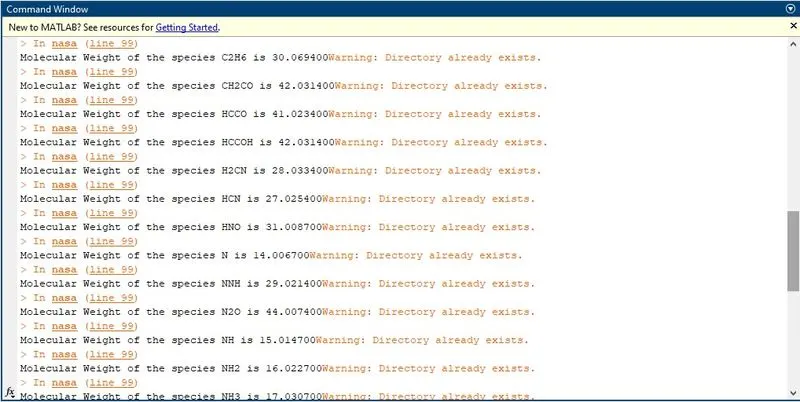
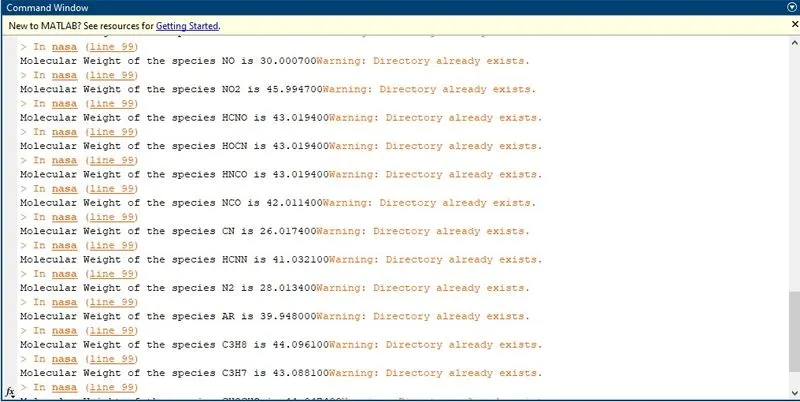
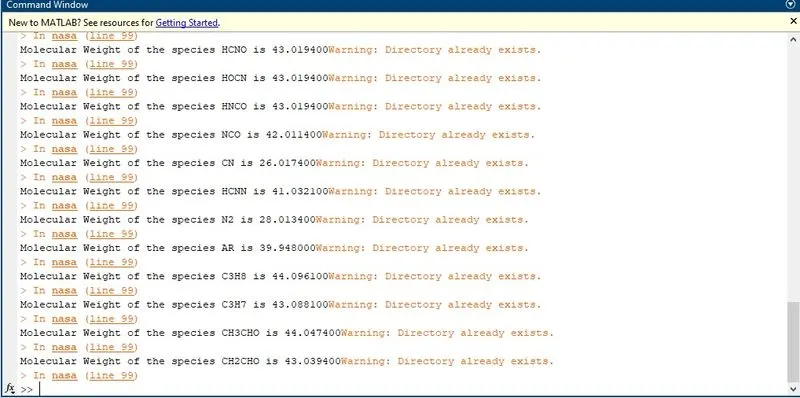
fprintf('Molecular Weight of the species %s is %f',compound_name ,mw) %command to print the molecular masss of the molecule
end
EXPLANATION:
This program has 19 lines. The line by line explanation is given below:
clear all
close all
clc

f1 = fopen('THERMO.dat','r');
first_line = fgetl(f1);
R = 8.314; %R is universal gas constant J/(mol-K)
temp = fgetl(f1);

%To read the text from a header file and the global temperature from the next line:

A = strsplit(temp,' ');

global_lowtemp = str2double(A{2}); %array is generated 1x4 cell array
global_midtemp = str2double(A{3});
global_hightemp = str2double(A{4});

Temperature = linspace(global_lowtemp,global_hightemp,1000);

for j =1 : 3
    k = fgetl(f1);
end

for i = 1 : 53
    tline = fgetl(f1); % parsing the species block
    S =strsplit(tline,' ');
    Species_name =S{1};

    line2 =fgetl(f1); % extracting the coefficients from first line
    x = strfind(line2,'E');

    x1 = line2(1:x(1)+3); %finding the 5 coefficients
    x1 = str2double(x1);

    x2 = line2(x(1)+4:x(2)+3);
    x2 = str2double(x2);

    x3 = line2(x(2)+4:x(3)+3);
    x3 = str2double(x3);

    x4 = line2(x(3)+4:x(4)+3);
    x4 = str2double(x4);

    x5 = line2(x(4)+4:x(5)+3);
    x5 = str2double(x5);

    line3 = fgetl(f1); % line no 3 5 coefficients
    x = strfind(line3,'E');

    x6 = line3(1:x(1)+3);
    x6 = str2double(x6);

    x7 = line3(x(1)+4:x(2)+3);
    x7 = str2double(x7);

    x8 = line3(x(2)+4:x(3)+3);
    x8 = str2double(x8);

    x9 = line3(x(3)+4:x(4)+3);
    x9 = str2double(x9);

    x10 = line3(x(4)+4:x(5)+3);
    x10 = str2double(x10);

    line4=fgetl(f1); % line no 4  4 coefficients
    x = strfind(line4,'E');

    x11 = line4(1:x(1)+3);
    x11 = str2double(x11);

    x12 = line4(x(1)+4:x(2)+3);
    x12 = str2double(x12);

    x13 = line4(x(2)+4:x(3)+3);
    x13 = str2double(x13);

    x14 = line4(x(3)+4:x(4)+3);
    x14 = str2double(x14);

    S = entropy_nasa(x1,x2,x3,x4,x5,x7,x8,x9,x10,x11,x12,x14,Temperature,global_midtemp,R); %Entropy Calculation

    Cp = spheat_nasa(x1,x2,x3,x4,x5,x8,x9,x10,x11,x12,Temperature,global_midtemp,R); %Specific Heat calculation

    H = enthalpy_nasa(x1,x2,x3,x4,x5,x6,x8,x9,x10,x11,x12,x13,Temperature,global_midtemp,R); %Enthlpy Calculation

    mw(i) = molwt_nasa(Species_name); %Molecular Weight calculation

    Moll_wt = fopen('Molecular Weight.txt','w');  % for reading and writing of the molecular wieght in the list of molecular wieght

    fprintf(Moll_wt,'Molecular Weight of the species %s is  %f ',Species_name,mw);

    fprintf(Moll_wt,'/n');

    fclose(Moll_wt);

    % Plotting on the graph for species fo the temperature and specific heat

    directory_curr = pwd; %creating a folder for saving the species with its properties
    mkdir(['C:\Users\Lenovo\Desktop\Species Name',Species_name]);
    cd(['C:\Users\Lenovo\Desktop\Species Name',Species_name]);

    figure(1) %plot 1 Enthalphy and Temperaure
    plot(Temperature,H,'linewidth',3,'color','b');
    xlabel('Temperature in [K]');
    ylabel('Enthalphy [KJ/mol]');
    grid on
    title(sprintf('Variation in Enthalphy wrt Temperature %s',Species_name));
    saveas (figure(1),'Enthalhy.jpg');

    figure(2) %plot 2 Entropy and Temperature
    plot(Temperature,S,'linewidth',3,'color','r');
    xlabel('Temperature in [K]');
    ylabel('Entropy [KJ/mol-k]');
    grid on
    title(sprintf('Variation in Entropy wrt Temperature %s',Species_name));
    saveas (figure(2),'Entropy.jpg');

    figure(3)
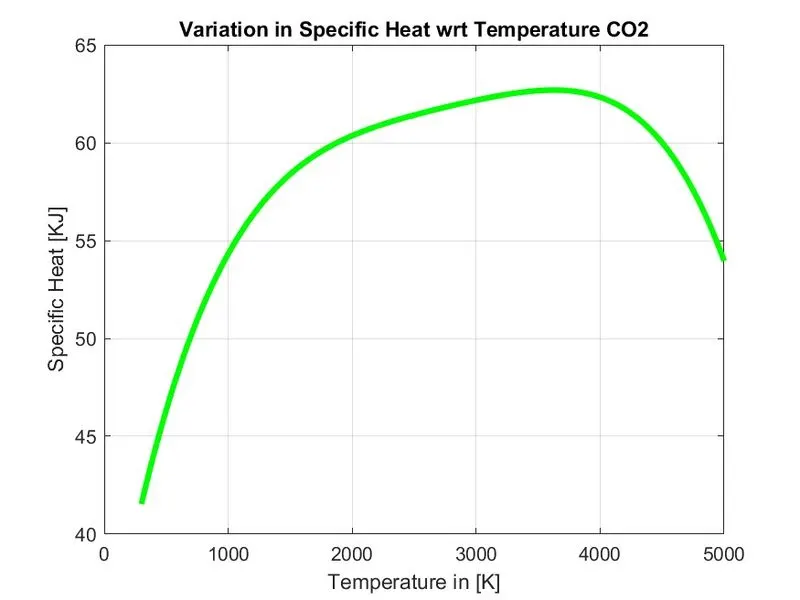
    plot(Temperature,Cp,'linewidth',3,'color','g');
    xlabel('Temperature in [K]');
    ylabel('Specific Heat [KJ]');
    grid on
    title(sprintf('Variation in Specific Heat wrt Temperature %s',Species_name));
    saveas (figure(3),'Specific Heat.jpg');

end
EXPLANATION:
This program has 81 lines. The line by line explanation is given below:
1) clear all: This is a command that is used to clear all workspace data.
2) close all: This is a command that is used to close any plot/graphs.
3) clc: This is a clear screen command. It clears command box.
4) f1 = fopen('THERMO.dat','r');: To open a file in read mode.
5) first_line = fgetl(f1);: To read file line by line.
6) R = 8.314;: To store the value of universal gas constant.
7) temp = fgetl(f1);: To save the line in the temp variable.
8) A = strsplit(temp,' ');: To split the line saved in temp variable when space(' ') is found.
9) global_lowtemp = str2double(A{2});: To assign the global lower temperature.
10) global_midtemp = str2double(A{3});: To assign the global middle temperature.
12) Temperature = linspace(global_lowtemp,global_hightemp,1000);:
13) for j =1 : 3: To skip the 3 comments lines, for loop is used.
14) k = fgetl(f1);: To read the comments line
15) end: To end the for j loop.
20) for i = 1 : 53: To parse the file and create plot for 53 molecules in the file.
21) tline = fgetl(f1);: To read the first line for a molecule.
22) S =strsplit(tline,' ');: To split the string when the space is found by the command.
23) Species_name =S{1};: To extract the name of the molecule.
24) line2 =fgetl(f1);: To read the first line of the coefficients.
25) x = strfind(line2,'E');: To find the string using the command.
26) x1 = line2(1:x(1)+3);: To extract the 1st coefficients from the line.
27) x1 = str2double(x1);: To transform the string coefficients extracted above to number.
36) line3 = fgetl(f1);: To read the line of the coefficients.
37) x = strfind(line3,'E');: To find the string using the command.
Line 38)- line 47): To extract the 6th to 10th coefficients from the line and to transform the string coefficients extracted above to numbers.
39) line4=fgetl(f1);: To read the line of the coefficients.
40) x = strfind(line4,'E');: To find the string using the command.
Line 41) - line 48): To extract the 11th to 14th coefficients from the line and to transform the string coefficients extracted above to numbers.
49) S = entropy_nasa(x1,x2,x3,x4,x5,x7,x8,x9,x10,x11,x12,x14,Temperature,global_midtemp,R);: To calculate entropy.
50) Cp = spheat_nasa(x1,x2,x3,x4,x5,x8,x9,x10,x11,x12,Temperature,global_midtemp,R);: To calculate the Specific Heat at constant pressure.
51) H = enthalpy_nasa(x1,x2,x3,x4,x5,x6,x8,x9,x10,x11,x12,x13,Temperature,global_midtemp,R);: To calculate enthalpy.
52) mw(i) = molwt_nasa(Species_name); Reading and writinh of the molecular wieght in the list of molecular weight.
53) Moll_wt = fopen('Molecular Weight.txt','w');: To write of the molecular wieght in the list of molecular wieght.
54) fprintf(Moll_wt,'Molecular Weight of the species %s is %f ',Species_name,mw);: To print the statement 'Molecular Weight of the species" inside filewriter 'Moll_wt' along with string and variable named 'Species_name' and 'mw'.
55) fprintf(Moll_wt,'/n');: To print the write-mode file 'Molecular Weight.txt' using a next-line '/n' command.
56) fclose(Moll_wt);: To close the file 'Moll_wt'.
57) directory_curr = pwd: To identify the current directory.
58) mkdir(['C:\Users\Lenovo\Desktop\Species Name',Species_name]);: 'mkdir' used to command and used for making a new directory in the location 'C:\Users\Lenovo\Desktop\Species Name' and split variable 'Species_name'.
59) cd(['C:\Users\Lenovo\Desktop\Species Name',Species_name]);: 'cd' is for changing the directory of the above.
60) figure(1): To open the first figure window for Enthalphy vs Temperaure.
61) plot(Temperature,H,'linewidth',3,'color','b');: To plot between temperature and enthalpy.
62) xlabel('Temperature in [K]');: To label the graph X-axis as "Temperature in [K]".
63) ylabel('Enthalphy [KJ/mol]');: To label the graph Y-axis as "Enthalphy [KJ/mol]".
64) grid on: It displays the major grid lines for the current axes returned by the gca command. Major grid lines extend from each tick mark.
65) title(sprintf('Variation in Enthalphy wrt Temperature %s',Species_name));: It adds the specified title to the formatted text as a string array or a cell array of character of 'Species_name'.
66) saveas (figure(1),'Enthalhy.jpg');: To save the figure block diagram specified by fig to file filename 'Enthalhy.jpg'.
Line 67) - line 73): Same procedure for Entropy vs Temperaure as mentioned in line 60) - 66).
Line 74) - line 80): Same procedure for Specific Heat vs Temperaure as mentioned in line 74) - 80).
81) end: To end the for loop in line number 20)
ERRORS FACED WHILE PROGRAMMING:
1) 'str2num' was replaced by 'str2double' after debugging.
2) 'findstr' was replaced by 'strfind' after debugging.
3) Function names were mistyped and later corrected.
OUTPUTS:
1) All the datas of the species in the graphical form are saved in folder 'Species Name':
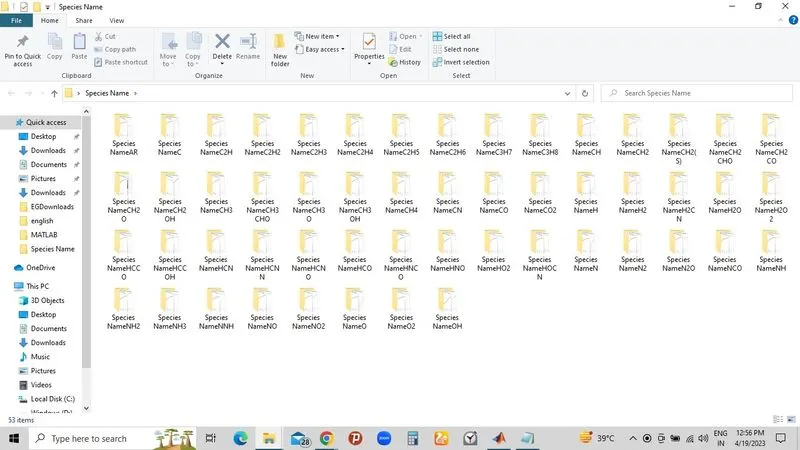
2) To plot the graphs for S, H, Cp VS T for 3 different species O2, N2 and Co2:
a) Plot for O2: