Project 1 - Parsing NASA thermodynamic data
Aim:
1)Write a function that extracts the 14 co-efficients and calculates the enthalpy, entropy and specific heats for all the species in the data file. You will be reading this file NASA thermodynamic data.
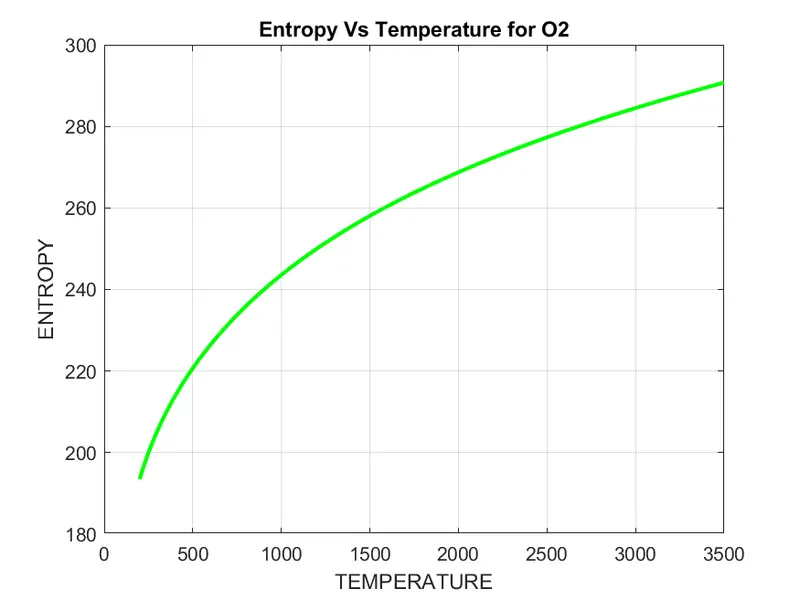
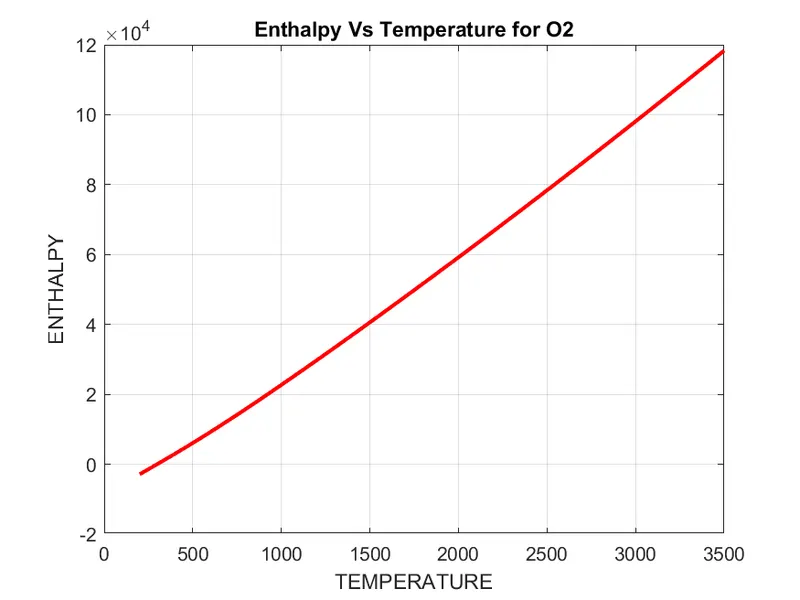
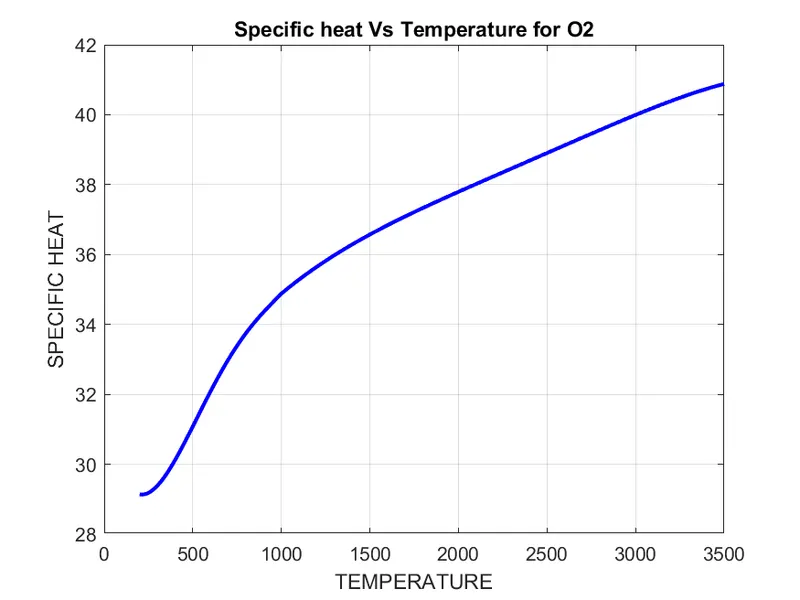
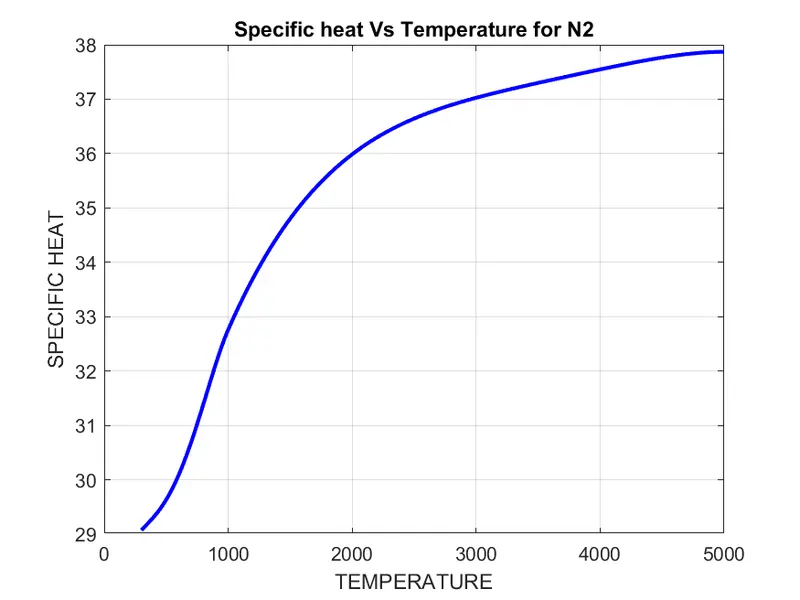
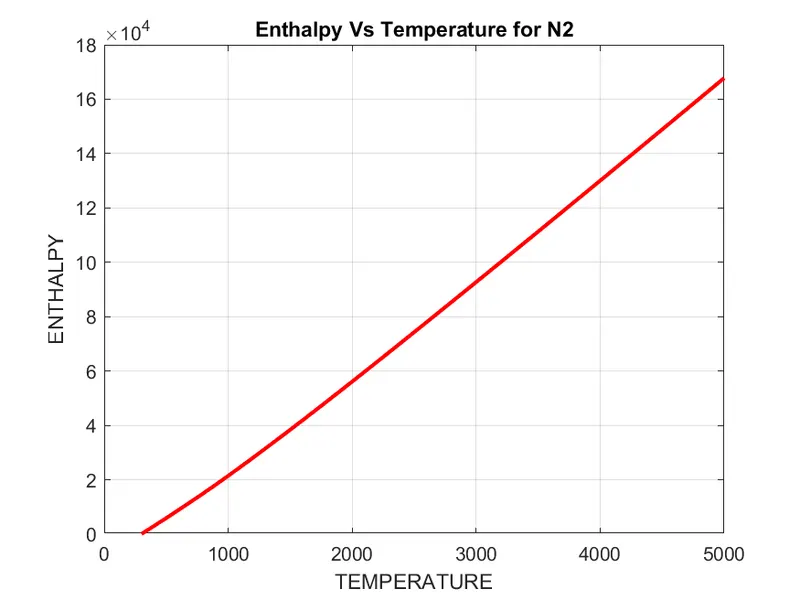
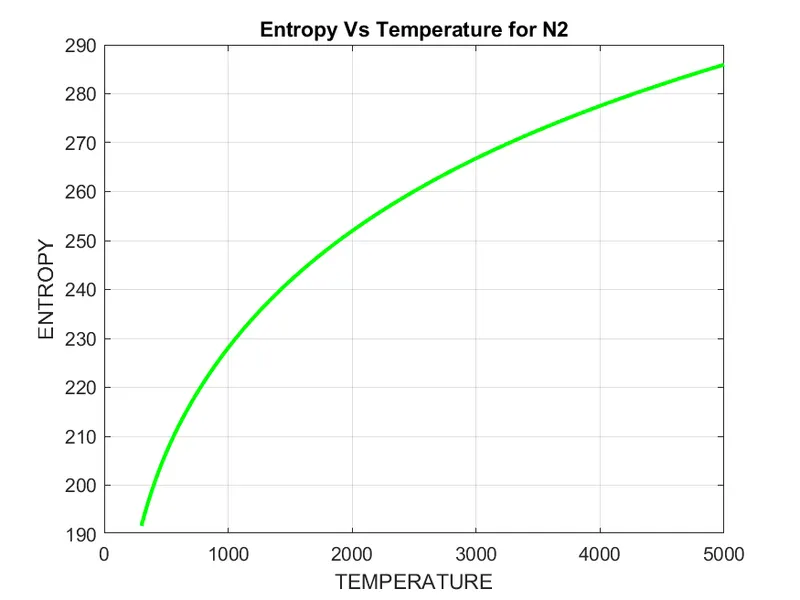
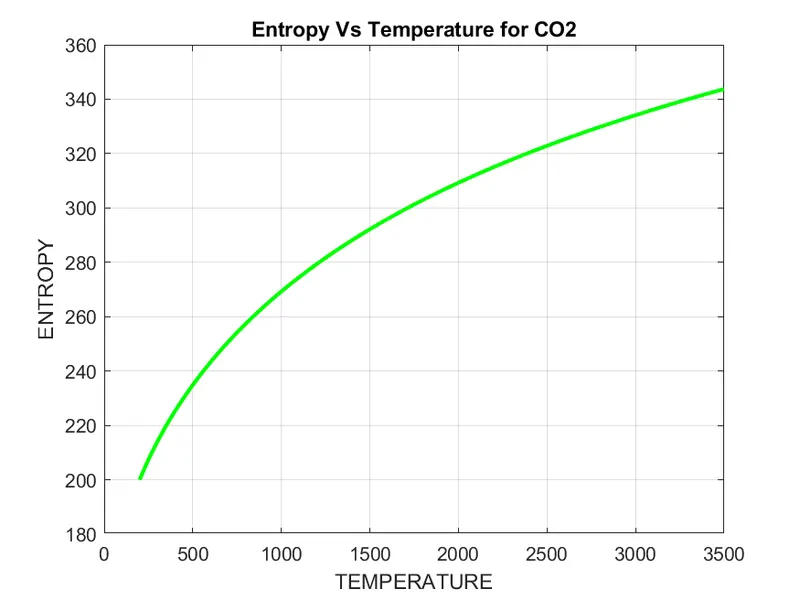
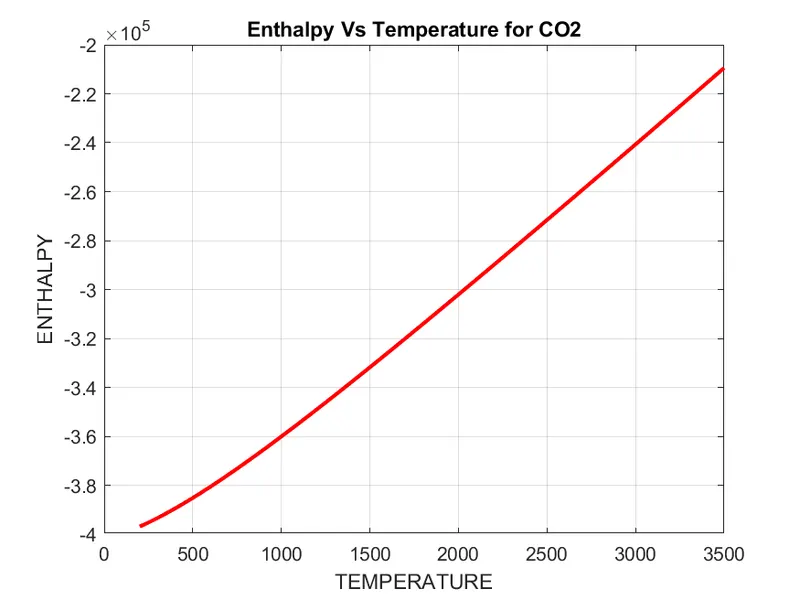
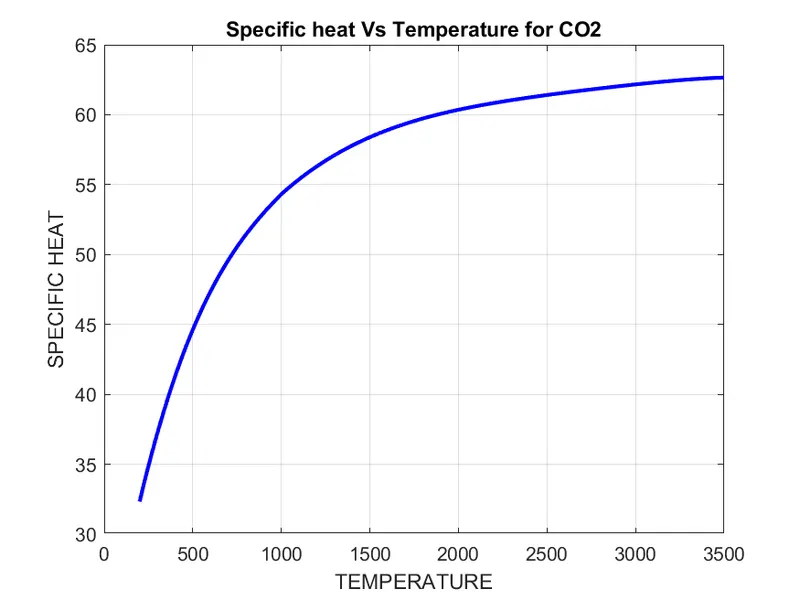
2)Plot the Cp, Enthalpy and Entropy for the local temperature range (low temperature : high temperature) specific for each species.
procedure:
The given data file is opened with fopen fucntion and assigned to the variable-f1.Then all the unwanted lines are skipped.The wanted lines are only scanned and extracted the temp coeff from eachline.seperately saved the element name,temp coeff,local temperature values.Then the created 3 functions namely cp,h,s which are sp.heat,enthalpy,entrophy respectively.The calculation are follows.
The thermodynamic properties in terms of the coefficients are given as based high temp and low temp.
Cp/R=a1+a2⋅T+a3⋅T^2+a4⋅T^3+a5⋅T^4
Cp/R=a1+a2⋅T+a3⋅T^2+a4⋅T^3+a5⋅T^4
H/RT=a1+a2⋅T/2+a3⋅T^2*3+a4⋅T^3*4+a5⋅T^4*5+a6*T
H/RT=a1+a2⋅T/2+a3⋅T^2*3+a4⋅T^3*4+a5⋅T^4*5+a6*T
S/R=a1⋅lnT+a2⋅T+a3⋅T^2*2+a4⋅T^3*3+a5⋅T^4*4+a7
S/R=a1⋅lnT+a2⋅T+a3⋅T^2*2+a4⋅T^3*3+a5⋅T^4*4+a7
clear all
close all
clc


f1=fopen('THERMO.dat','r');
p1= fgetl(f1);  %Skip first 5 lines
p2=fgetl(f1);
p3=fgetl(f1);
p4=fgetl(f1);
p5=fgetl(f1);

%Assign Gas constant variable
R=8.314;


for i = 1:53
    np=i

line1 = fgetl(f1);
element_name = strtok(line1);
y1=strsplit(line1)
[ro1,col1]=size(y1)
col1=col1-4
k1=str2num(y1{col1+1})
k2=str2num(y1{col1+2})
k3=str2num(y1{col1+3})
Temp1=[k1,k3,k2]
t_range=linspace(k1,k2,500);

% Coeff extraction from temperature table

line2 = fgetl(f1);
A = strfind(line2,'E');
display(A)

line3 = fgetl(f1);
B = strfind(line3,'E');

line4 = fgetl(f1);
C = strfind(line4,'E');

a1 = str2num(line2(1:A(1)+3));
a2 = str2num(line2(A(1)+4:A(2)+3));
a3 = str2num(line2(A(2)+4:A(3)+3));
a4 = str2num(line2(A(3)+4:A(4)+3));
a5 = str2num(line2(A(4)+4:A(5)+3));

a6 = str2num(line3(1:B(1)+3));
a7 = str2num(line3(B(1)+4:B(2)+3));

b1 = str2num(line3(B(2)+4:B(3)+3));
b2 = str2num(line3(B(3)+4:B(4)+3));
b3 = str2num(line3(B(4)+4:B(5)+3));
b4 = str2num(line4(1:C(1)+3));
b5 = str2num(line4(C(1)+4:C(2)+3));
b6 = str2num(line4(C(2)+4:C(3)+3));
b7 = str2num(line4(C(3)+4:C(4)+3));

%specific heat
cp=specific_heat(a1,a2,a3,a4,a5,b1,b2,b3,b4,b5,t_range,R,Temp1);


% Enthalpy
H=enthalpy(a1,a2,a3,a4,a5,a6,b1,b2,b3,b4,b5,b6,t_range,R,Temp1);

% Entropy
s=entropy_calc(a1,a2,a3,a4,a5,a7,b1,b2,b3,b4,b5,b7,t_range,R,Temp1);

% Calculating molecular weight of species
%Molecular_wt(i) = molecular_weight(element_name);


%saving and plotting the data

%cd('C:\Users\karthikeyan\Desktop\NASA\species')

%dir_name = element_name;
%mkdir(dir_name);


figure(1)
plot(t_range,cp,'linewidth',2,'color','b')
title(sprintf('Specific heat Vs Temperature for %s',element_name))
xlabel('TEMPERATURE')
ylabel('SPECIFIC HEAT')
grid on

figure(2)
plot(t_range,H,'linewidth',2,'color','r')
title(sprintf('Enthalpy Vs Temperature for %s',element_name))
xlabel('TEMPERATURE')
ylabel('ENTHALPY')
grid on

figure(3)
plot(t_range,s,'linewidth',2,'color','g')
title(sprintf('Entropy Vs Temperature for %s',element_name))
xlabel('TEMPERATURE')
ylabel('ENTROPY')
grid on

 %pause the loop so that you can see each species plot in real time
  pause(0.0001)

   %cd(dir_name);
   bt3='z'
   bt2='x'
   bt4='q'
   bt='.png'
   bt1=num2str(np)
   z1=strcat(bt3,bt1,bt)
   z2=strcat(bt2,bt1,bt)
   z3=strcat(bt4,bt1,bt)
saveas(1,z1);
saveas(2,z2);
saveas(3,z3);


end

fclose(f1);

%program to specific heat
function [cp] = specific_heat(a1,a2,a3,a4,a5,b1,b2,b3,b4,b5,t_range,R,Temp1)
% Comparing with global temp

    for i= 1:length(t_range)
        if t_range(i)>=Temp1(2)
            cp(i)= R*(a1 + (a2*t_range(i)) + (a3*(t_range(i).^2)) + (a4*(t_range(i).^3)) + (a5*(t_range(i).^4)));
        else
            cp(i)= R*(b1 + (b2*t_range(i)) + (b3*(t_range(i).^2)) + (b4*(t_range(i).^3)) + (b5*(t_range(i).^4)));
        end
    end
end


%program to calculate enthalpy
    function [H] = enthalpy(a1,a2,a3,a4,a5,a6,b1,b2,b3,b4,b5,b6,t_range,R,Temp1)
for i= 1:length(t_range)
        if t_range(i)>=Temp1(2)
            H(i)= R*((a1*t_range(i)) + (a2*((t_range(i).^2)/2)) + (a3*((t_range(i).^3)/3)) + (a4*((t_range(i).^4)/4)) + (a5*((t_range(i).^5)/5)) + a6);

        else
            H(i)= R*((b1*t_range(i)) + (b2*((t_range(i).^2)/2)) + (b3*((t_range(i).^3)/3)) + (b4*((t_range(i).^4)/4)) + (b5*((t_range(i).^5)/5)) + b6);
        end
end
end


%Program to calculate entropy
function [s] = entropy_calc(a1,a2,a3,a4,a5,a7,b1,b2,b3,b4,b5,b7,t_range,R,Temp1)
for i= 1:length(t_range)
        if t_range(i)>=Temp1(2)
            s(i)= R*((a1*log(t_range(i))) + (a2*t_range(i)) + (a3*((t_range(i).^2)/2)) + (a4*((t_range(i).^3)/3)) + (a5*((t_range(i).^4)/4)) + a7);

        else
            s(i)= R*((b1*log(t_range(i))) + (b2*t_range(i)) + (b3*((t_range(i).^2)/2)) + (b4*((t_range(i).^3)/3)) + (b5*((t_range(i).^4)/4)) + b7);

        end


end
end
plots are drawn and the same is submitted: