Project 1 - Parsing NASA thermodynamic data
AIM:
1. Write a function that extracts the 14 co-efficients and calculates the enthalpy, entropy and specific heats for all the species in the data file. You will be reading this file NASA thermodynamic data(Tip: use fopen and fgetl). The formulae are shown below.
Here R is the universal gas constant, T is the temeprature
The FIRST 7 coefficients are HIGH-temperature coefficients and the SECOND 7 coefficients are LOW-temperature coefficients.
Also use the LOCAL TEMPERATURE RANGES which is unique for each individual species, not the GLOBAL TEMPERATURE RANGE.
2. Calculate the molecular weight of each species and display it in the command window.
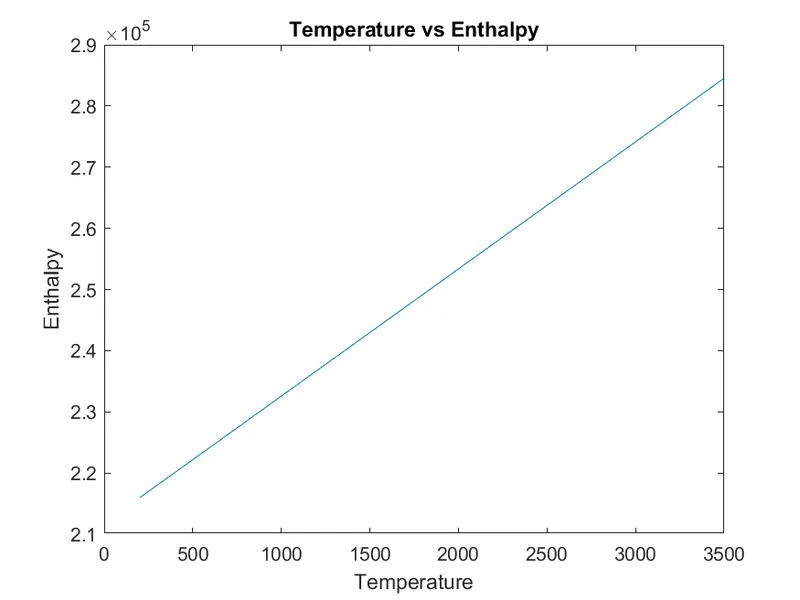
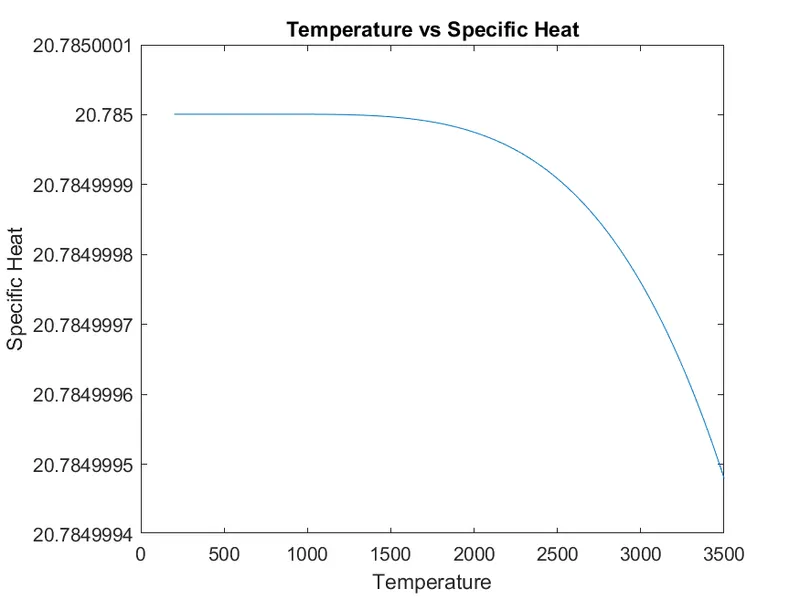
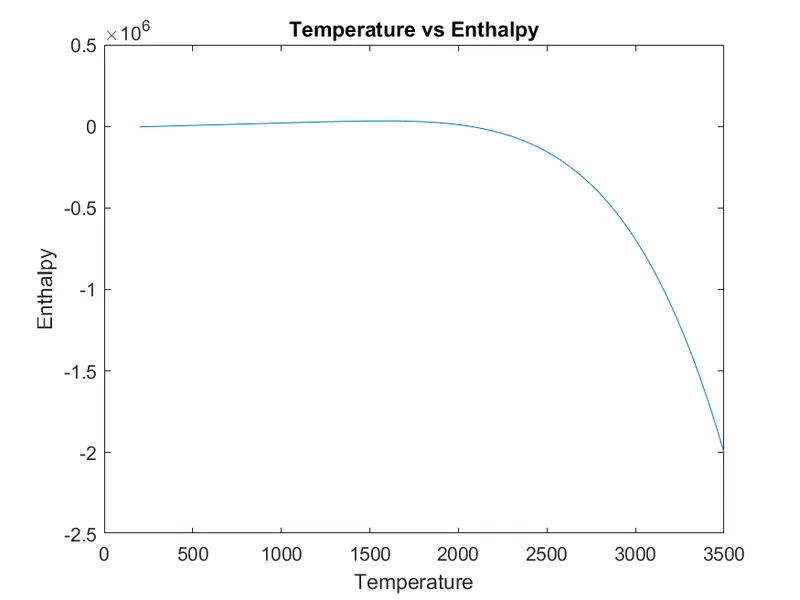
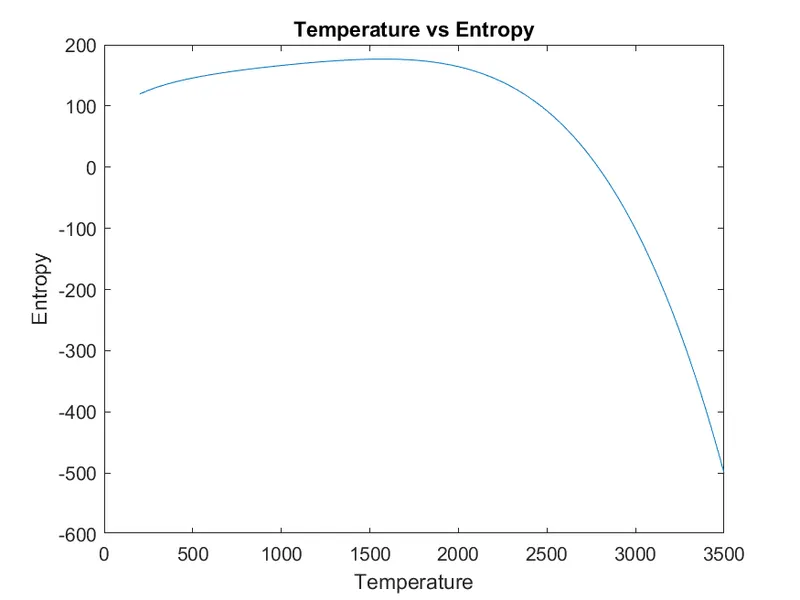
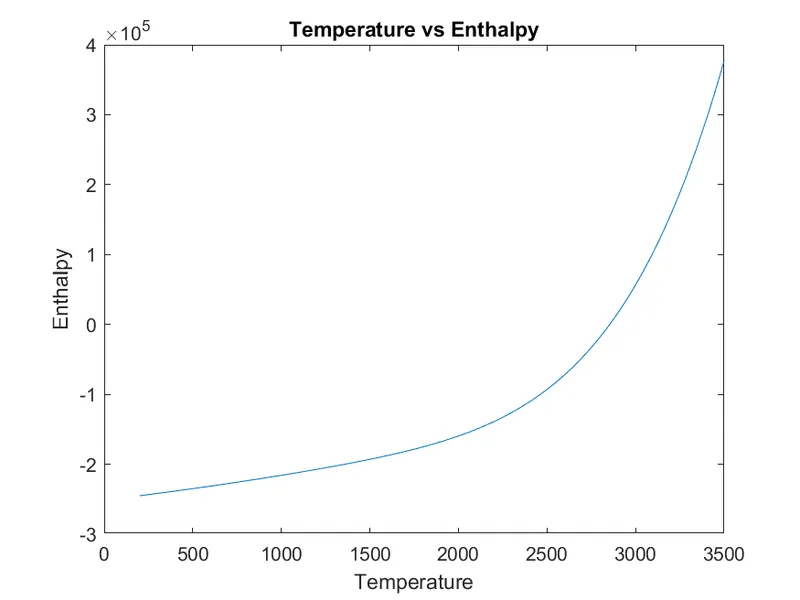
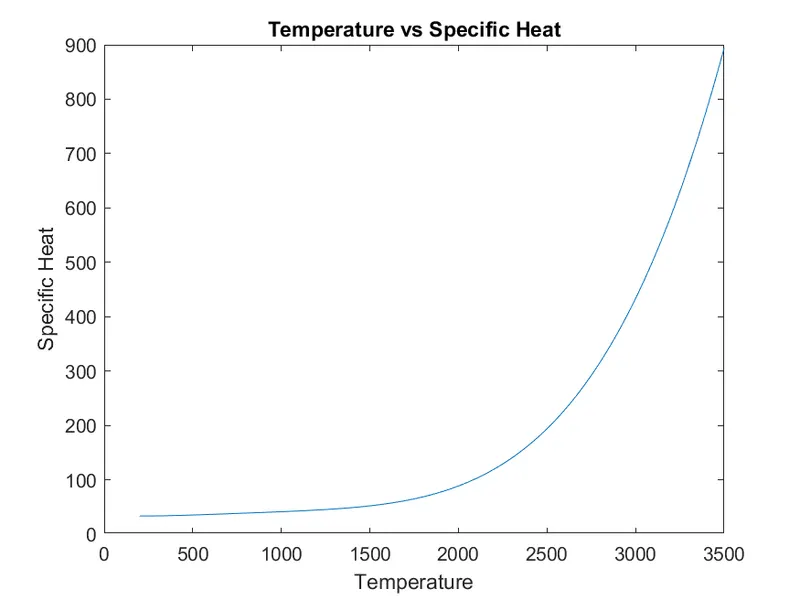
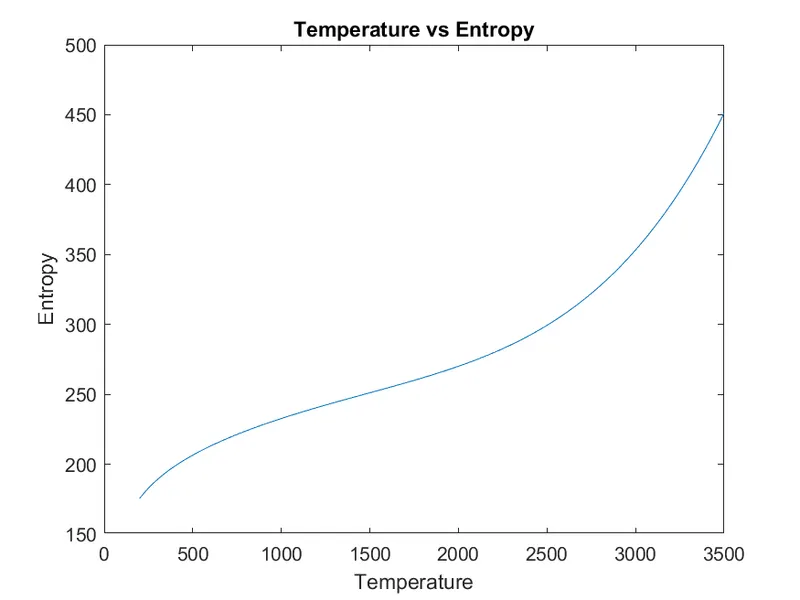
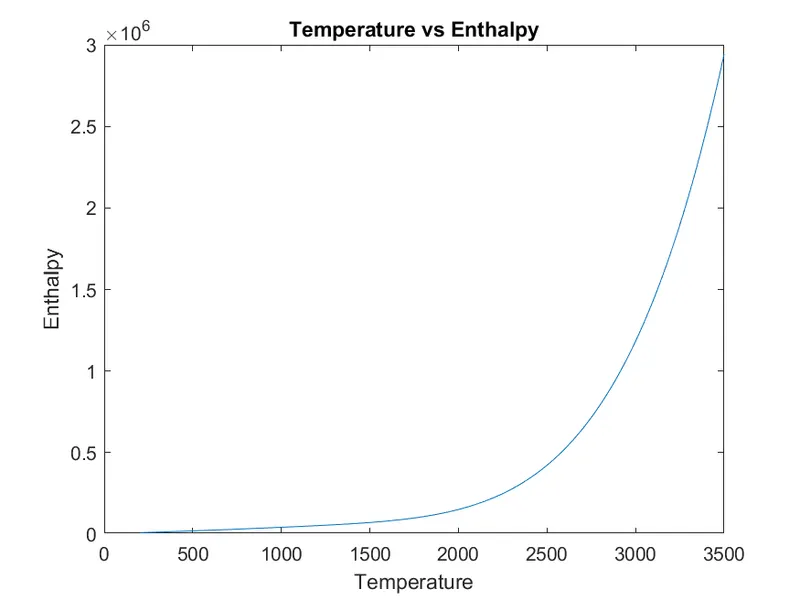
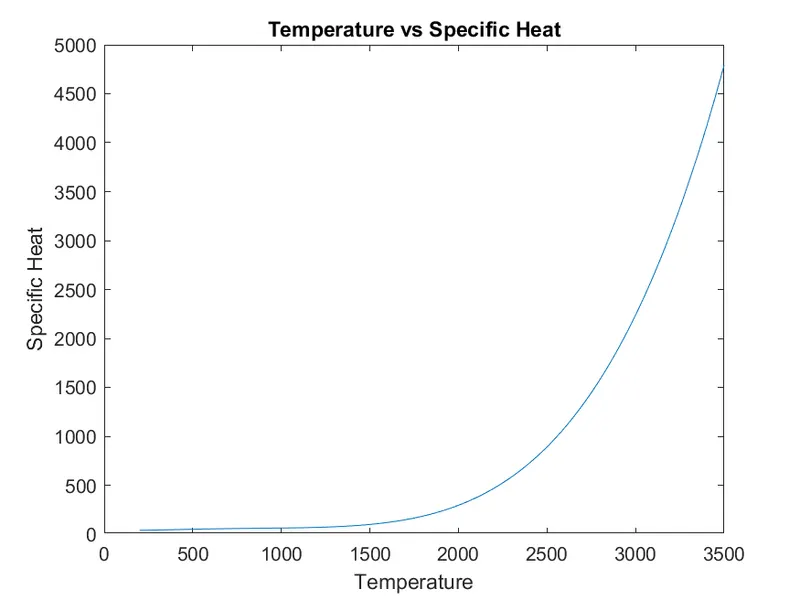
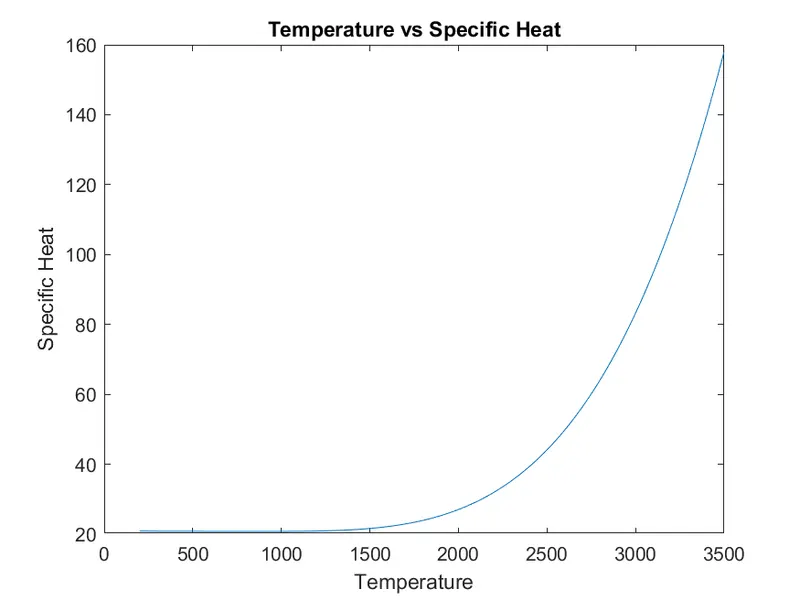
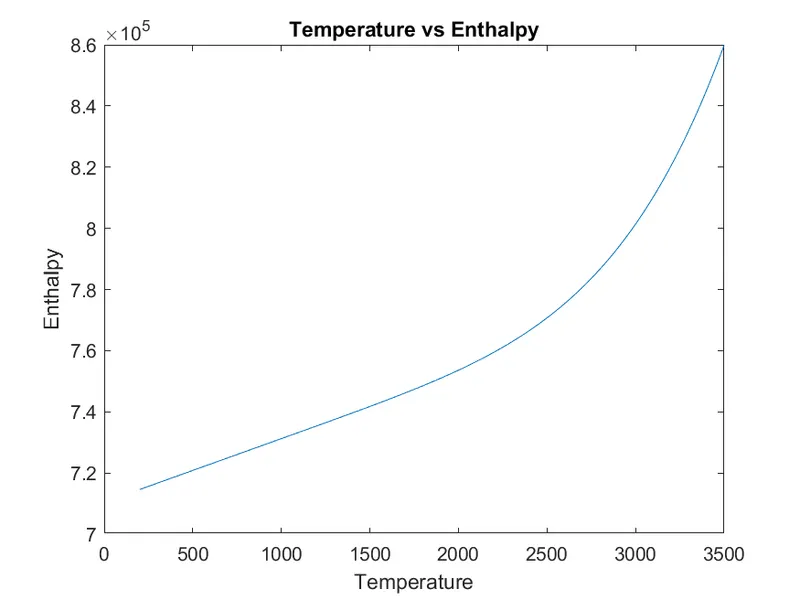
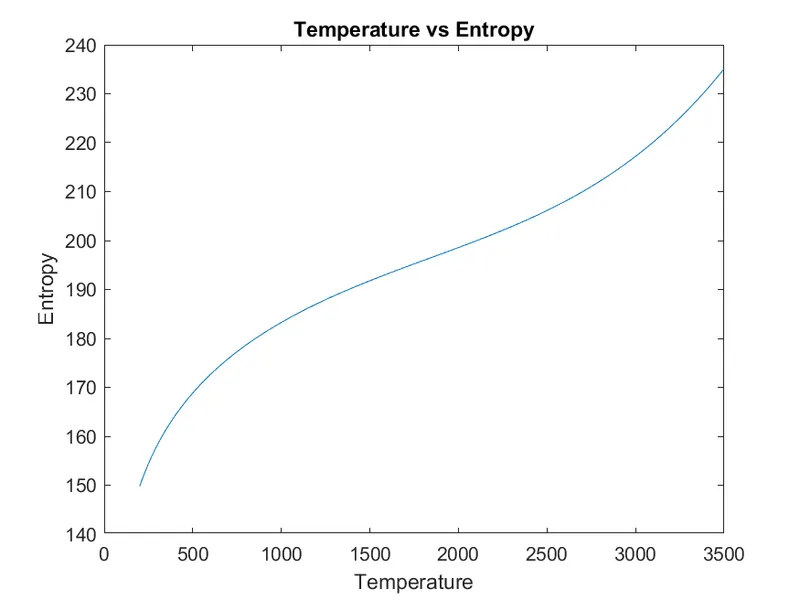
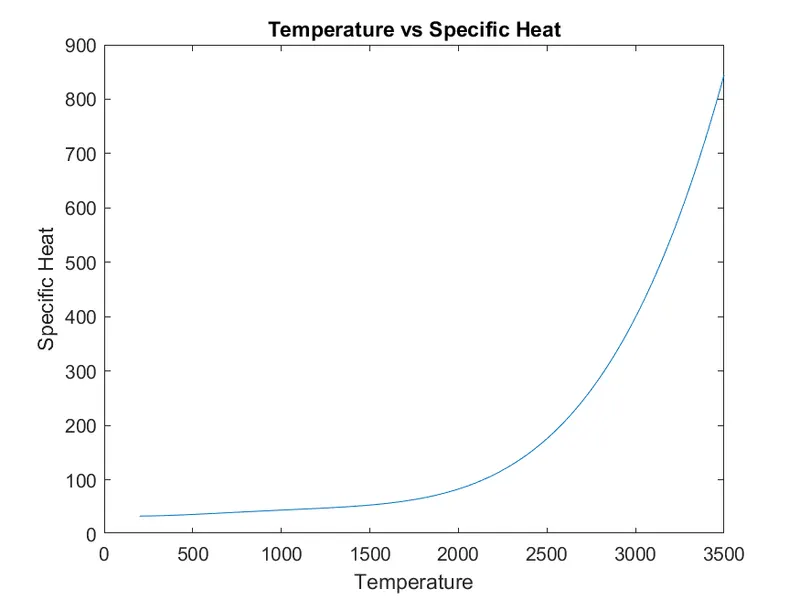
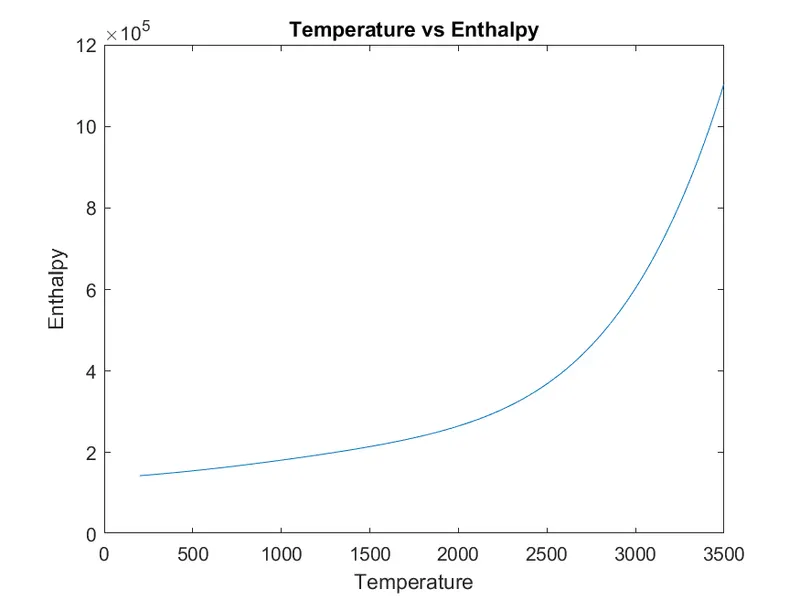
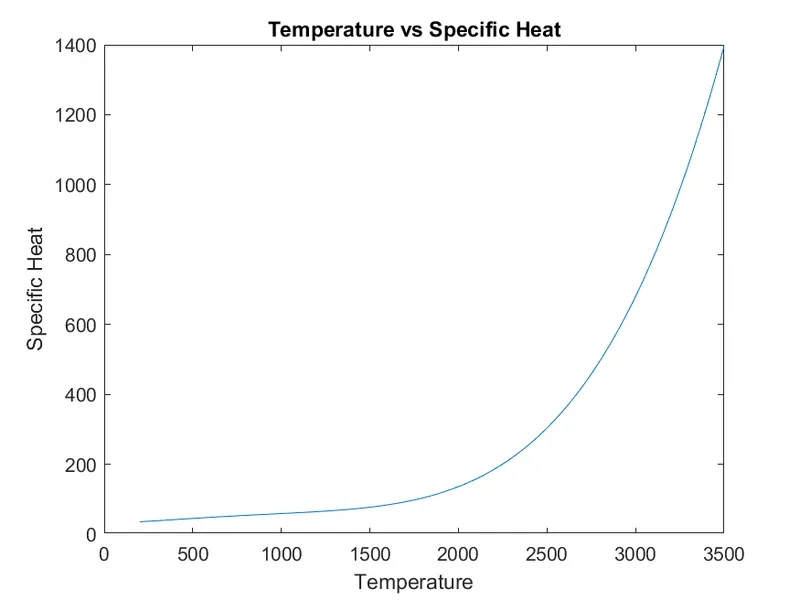
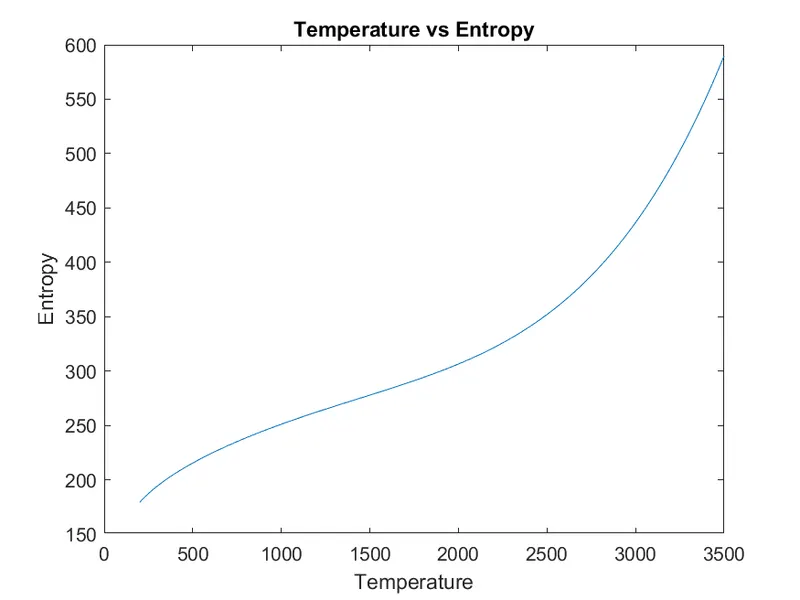
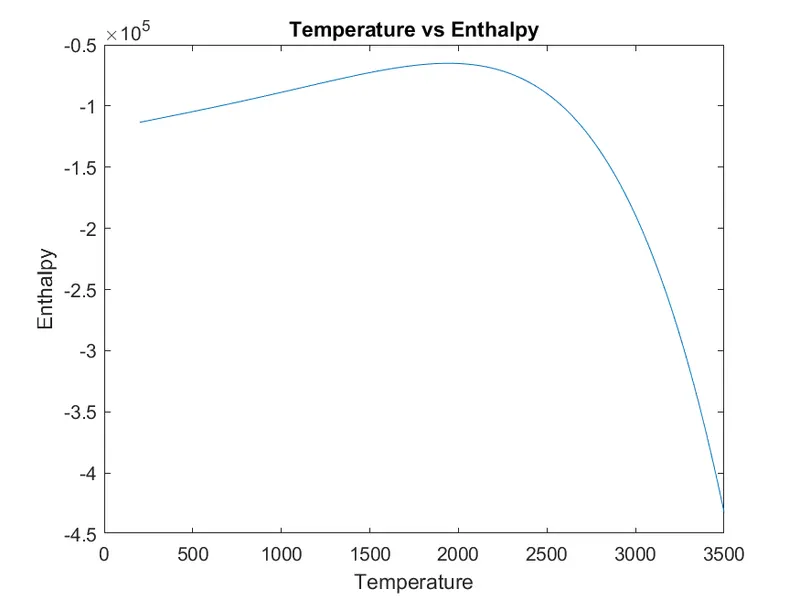
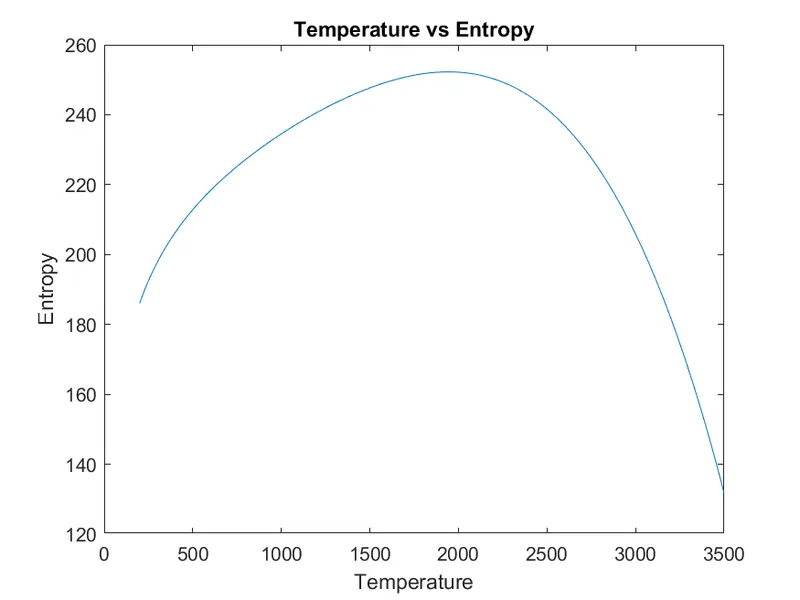
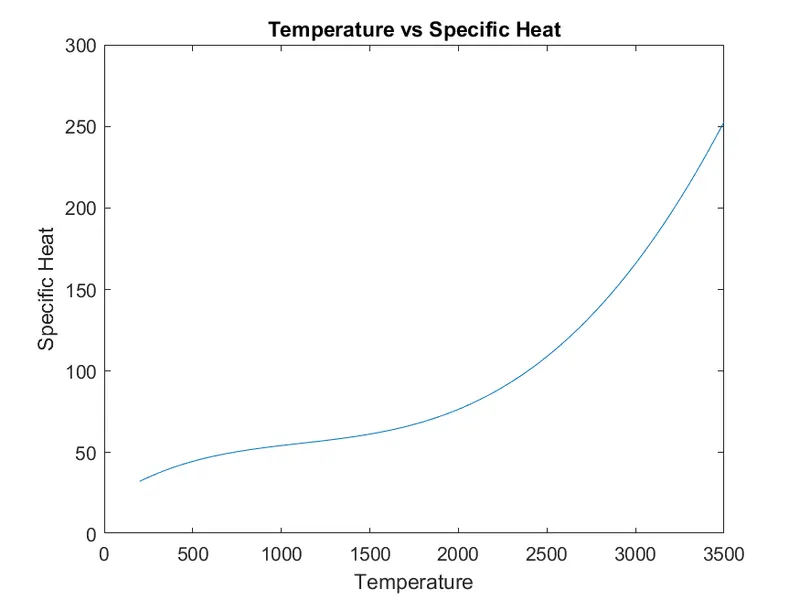
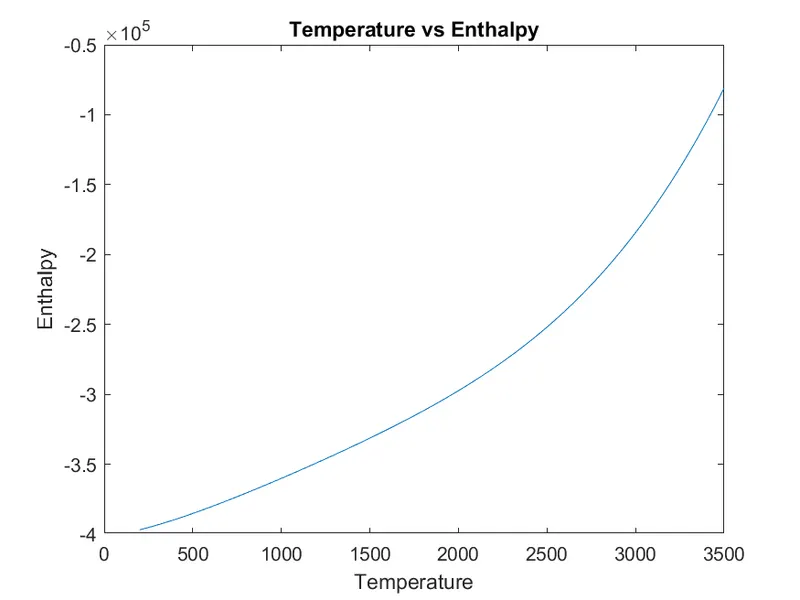
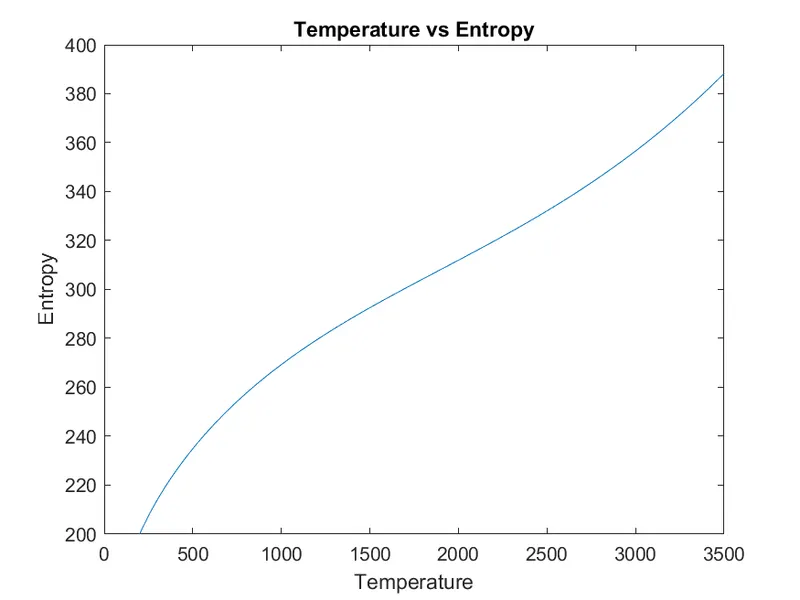
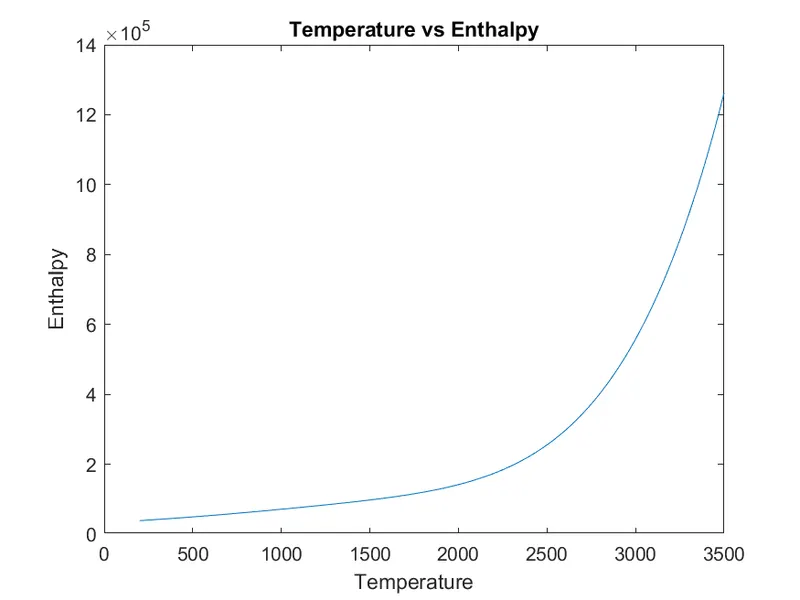
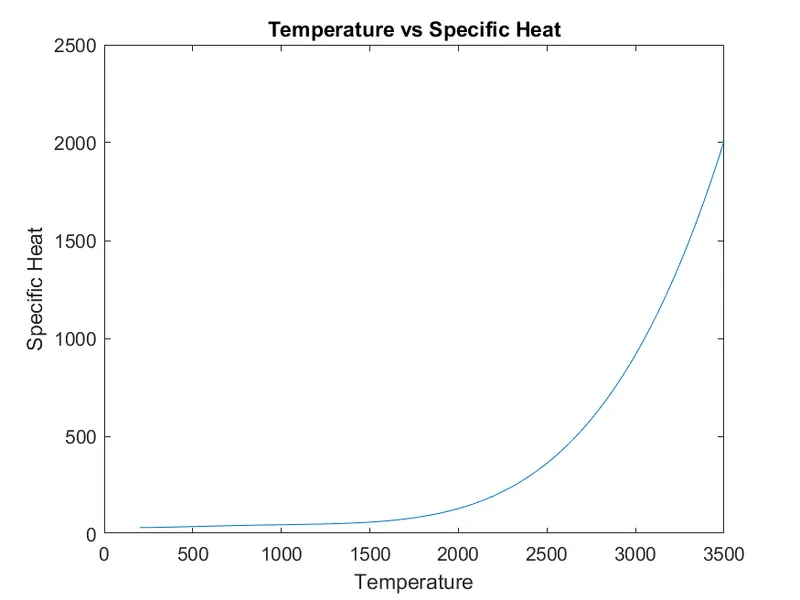
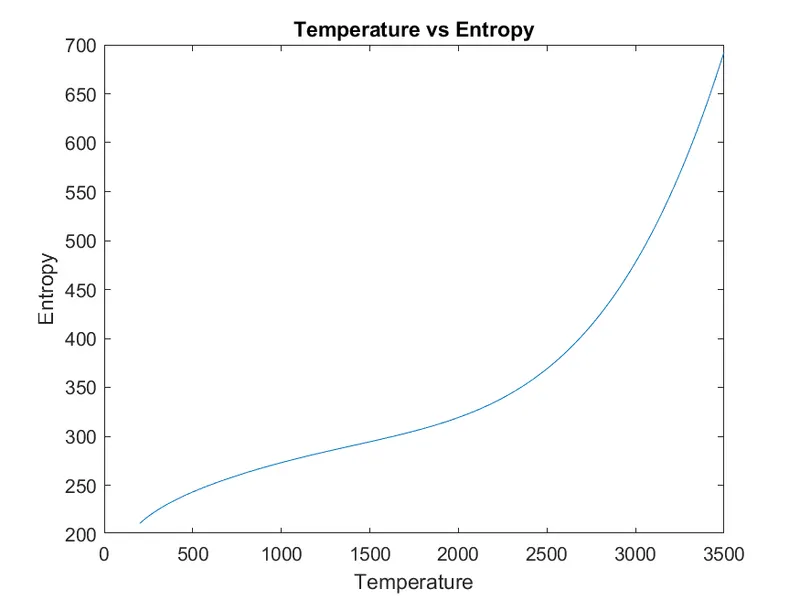
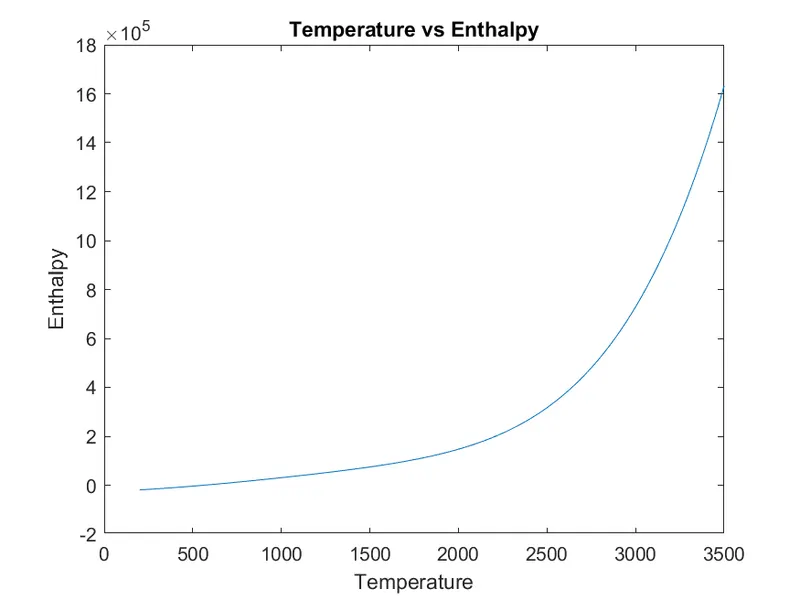
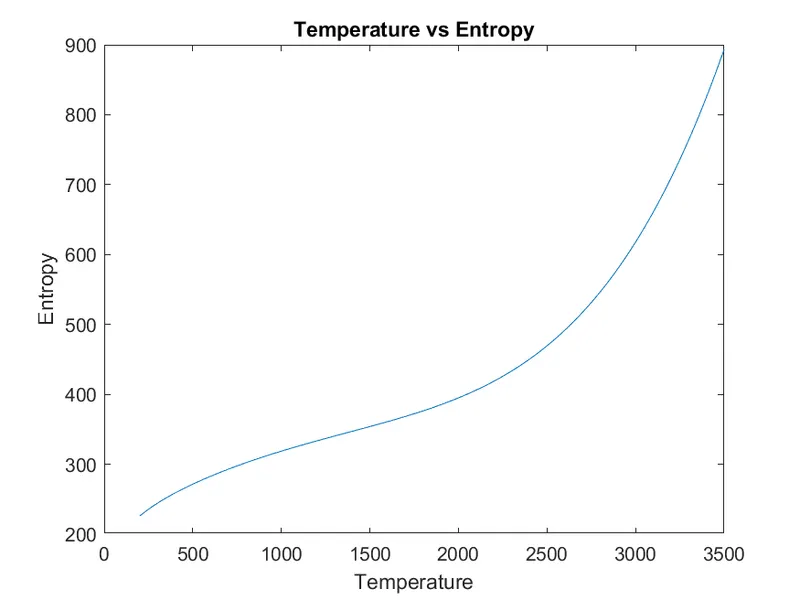
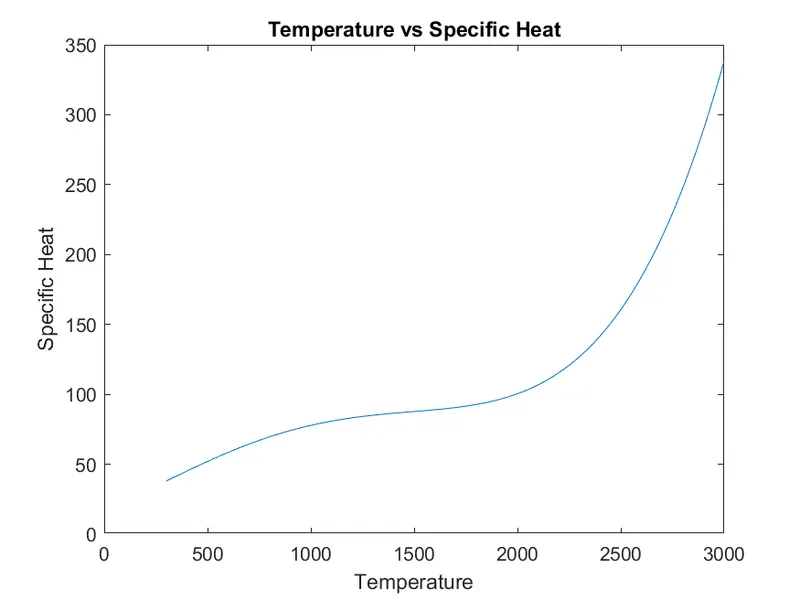
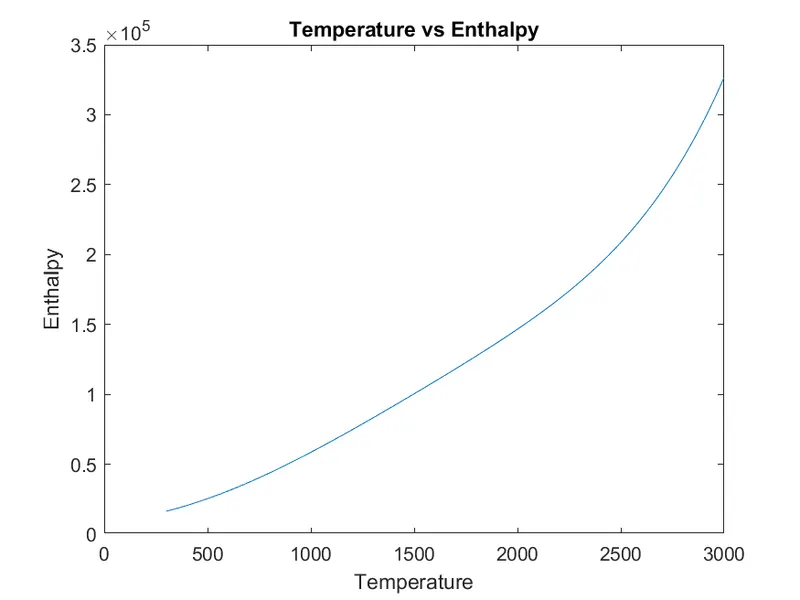
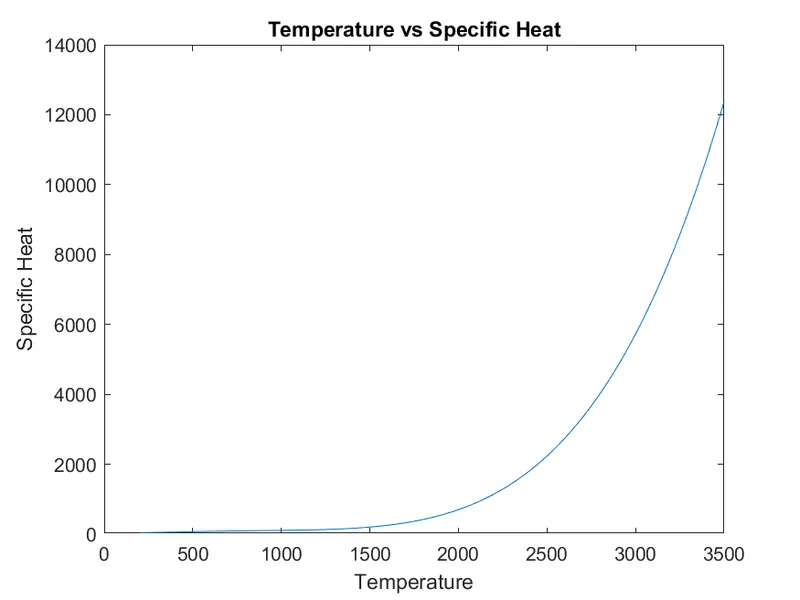
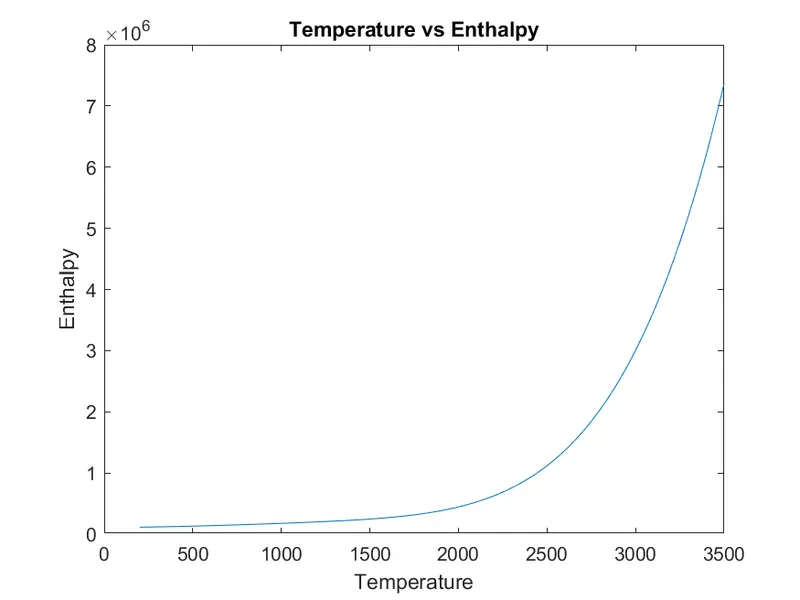
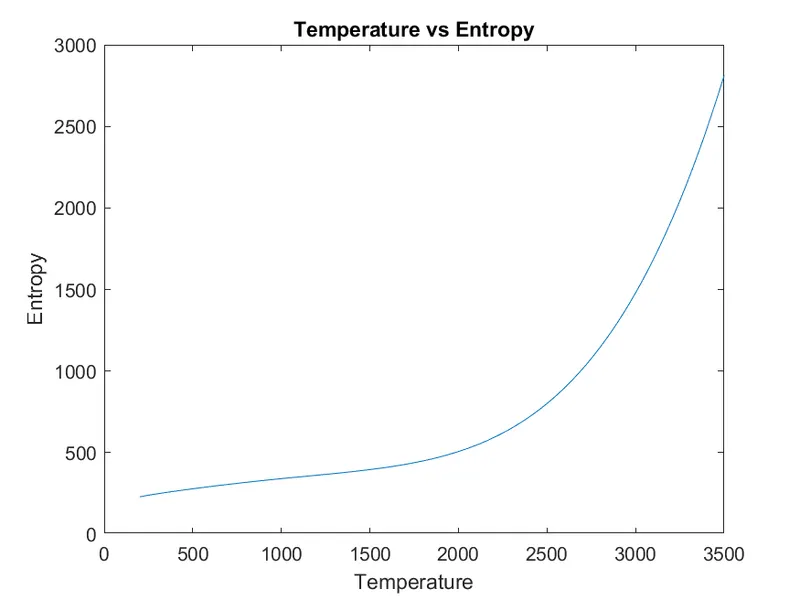
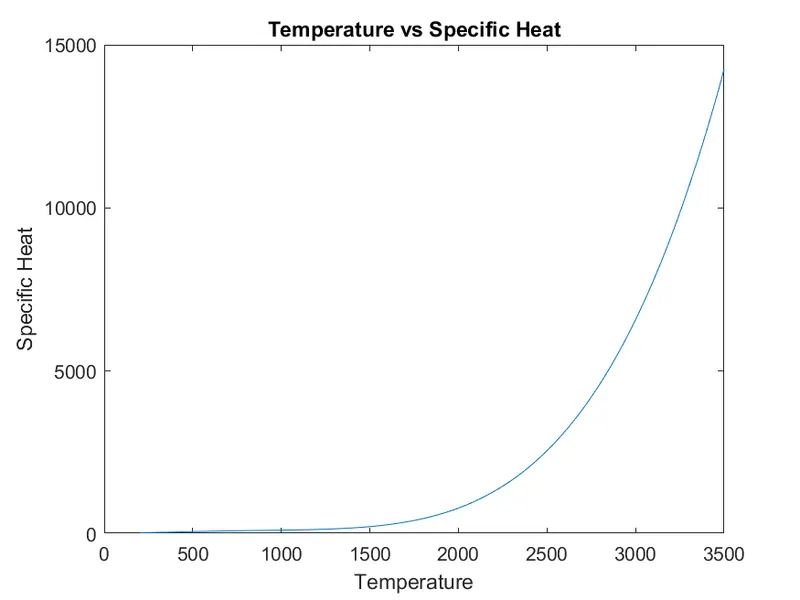
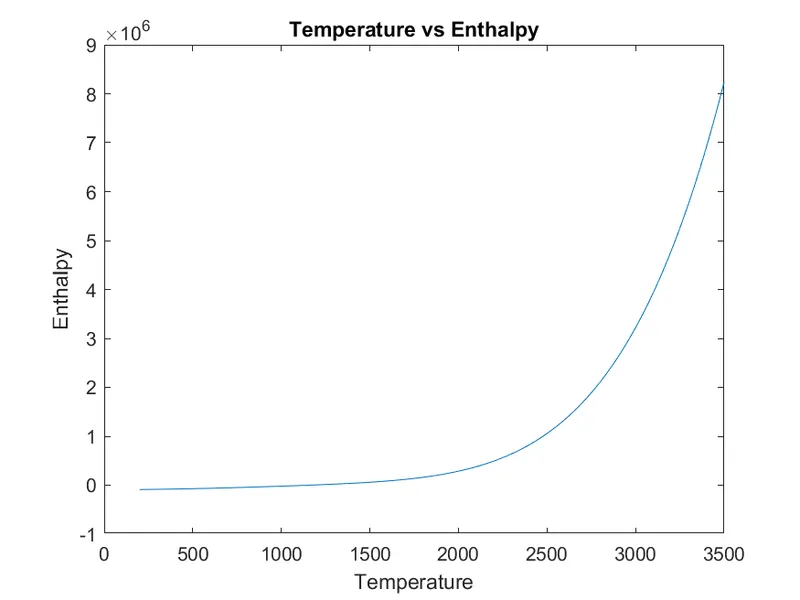
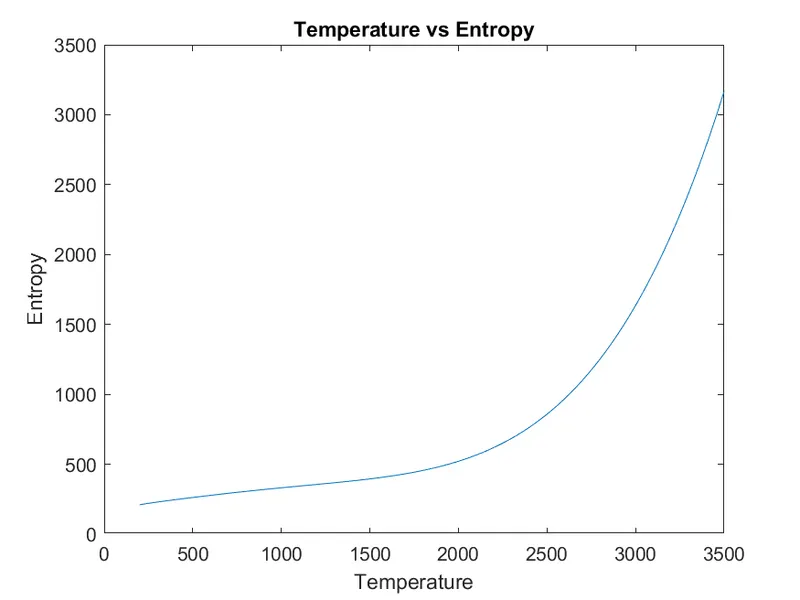
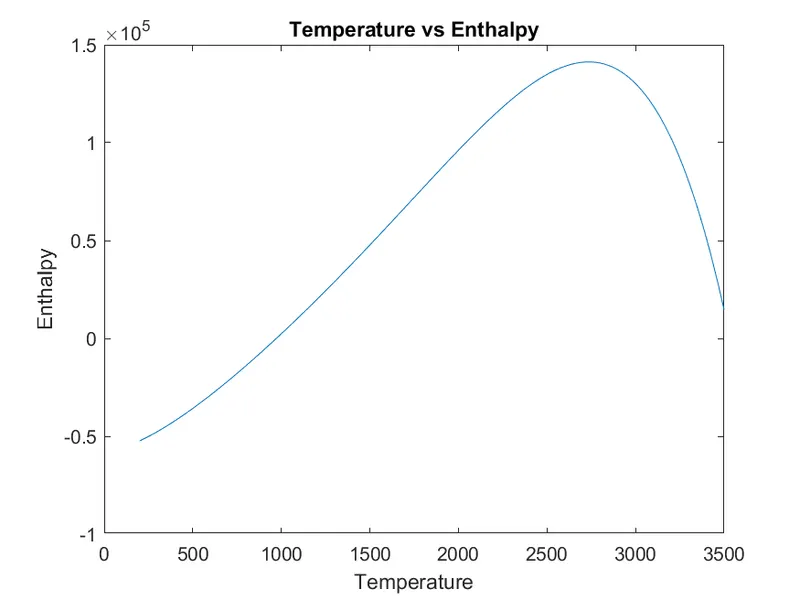
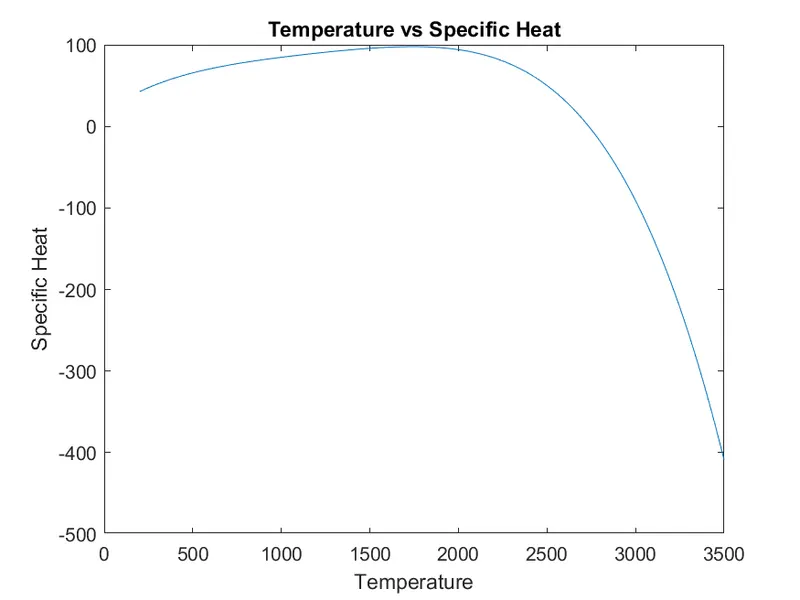
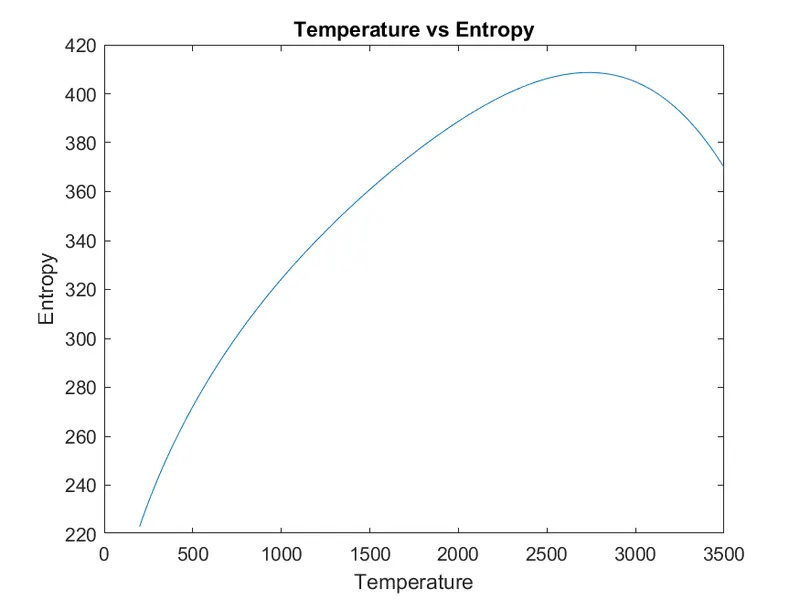
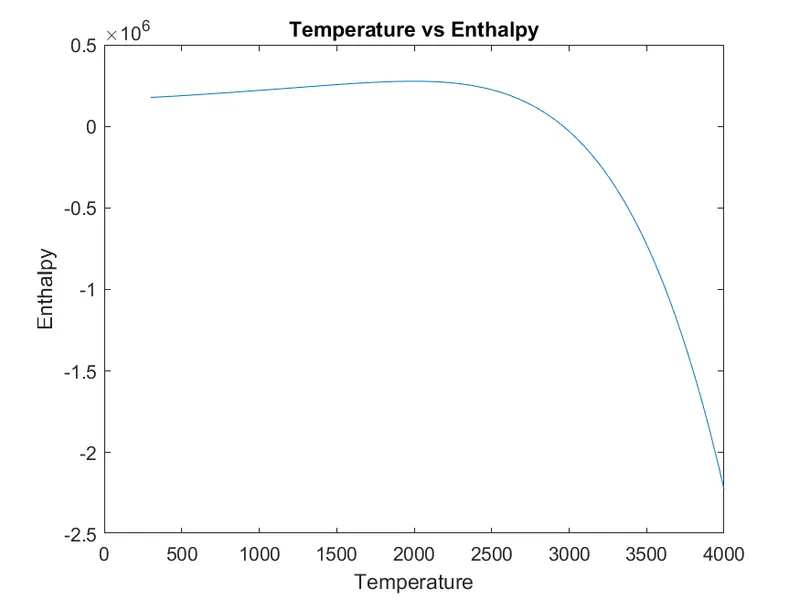
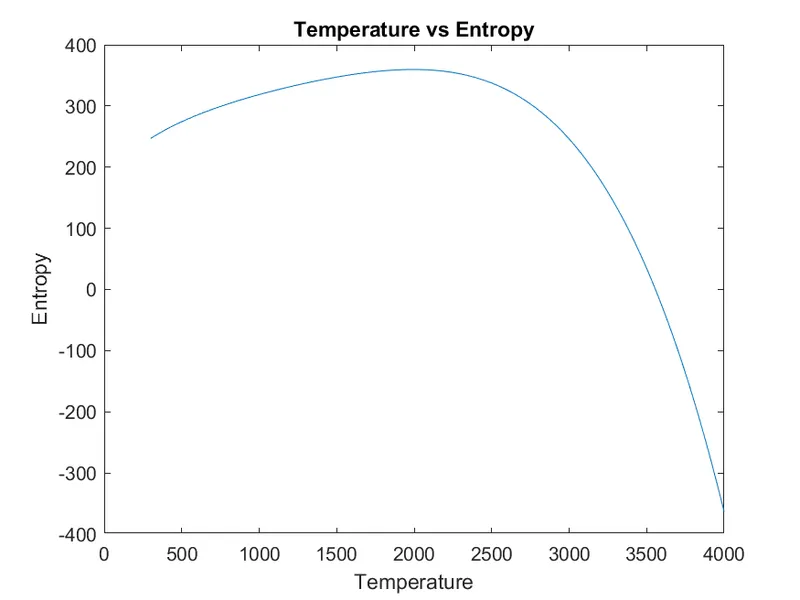
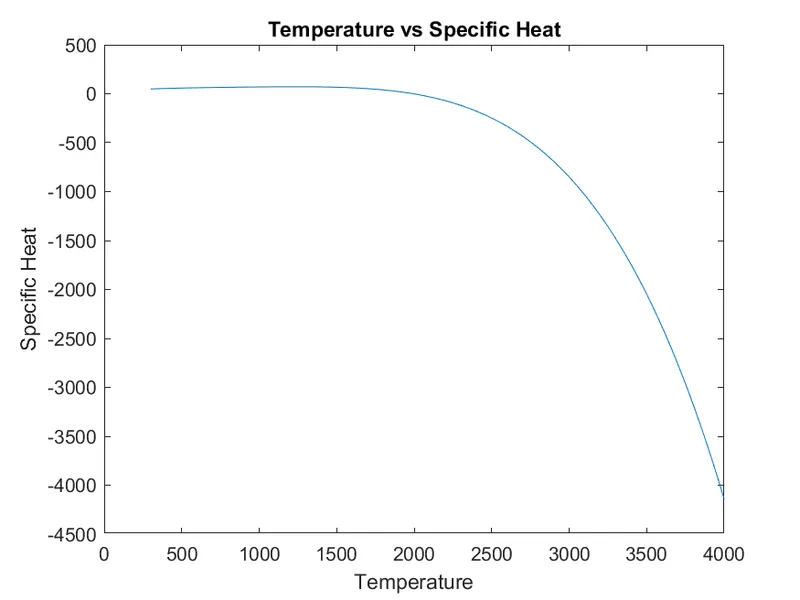
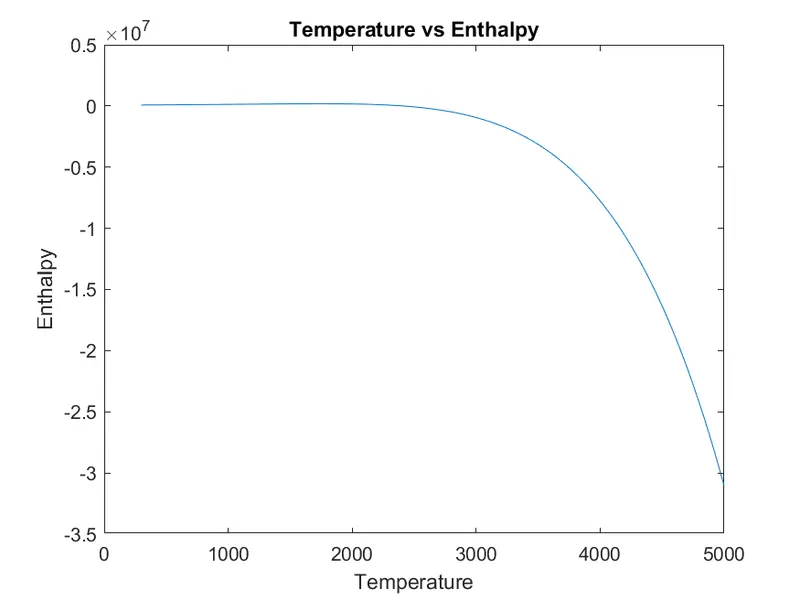
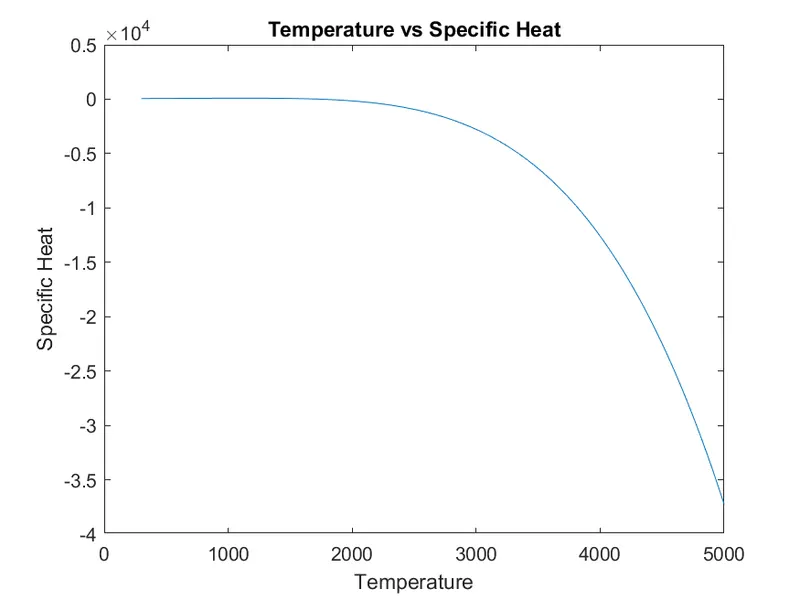
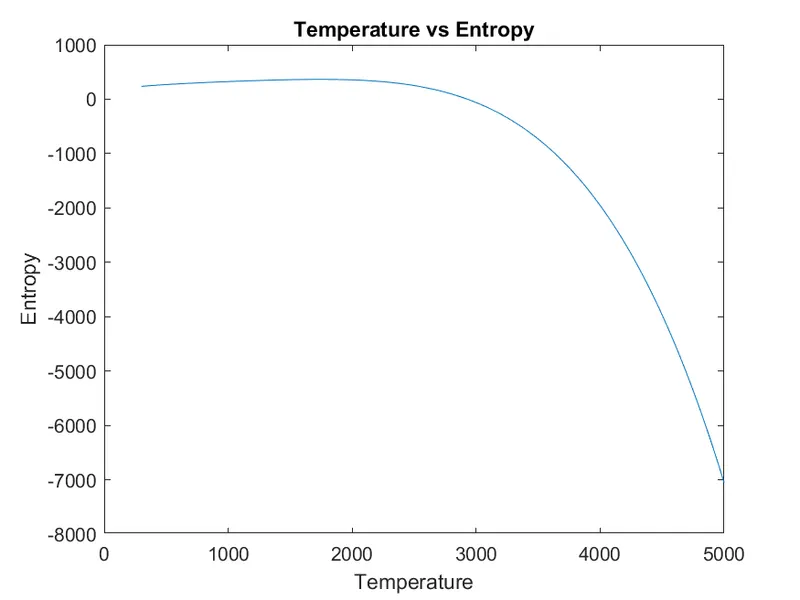
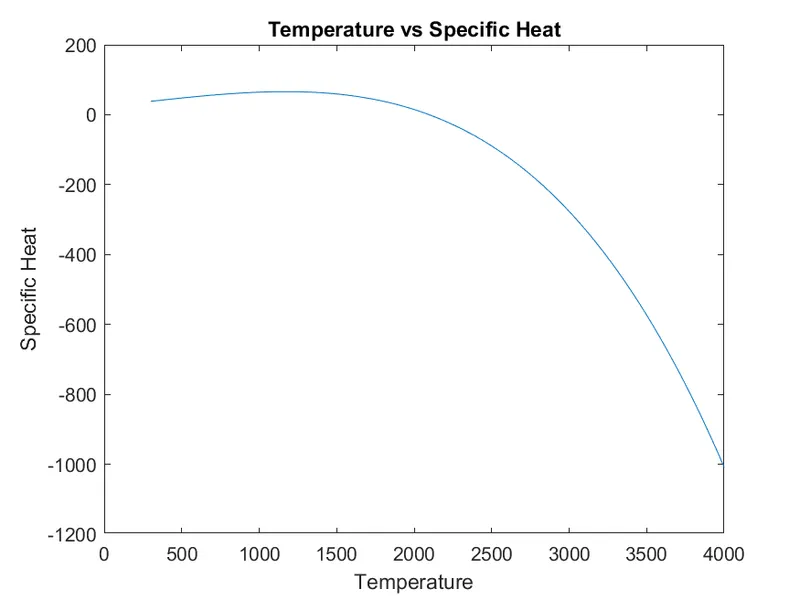
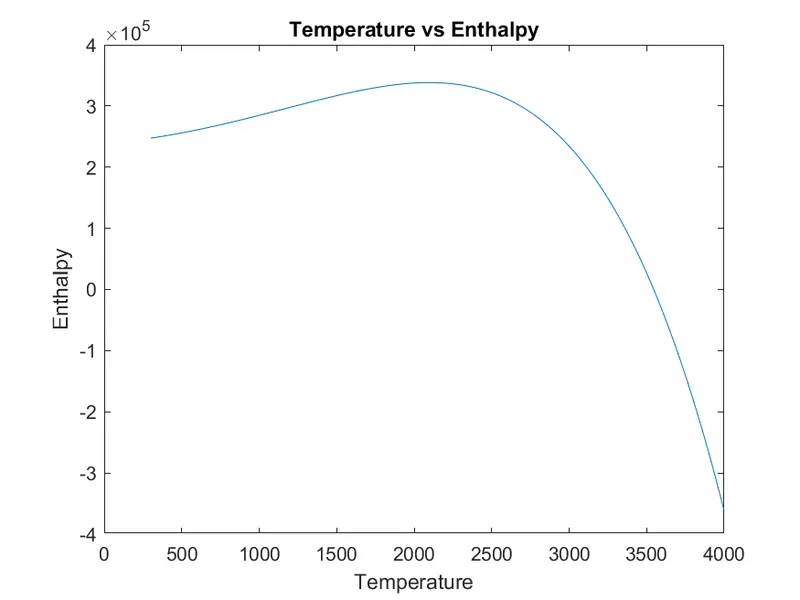
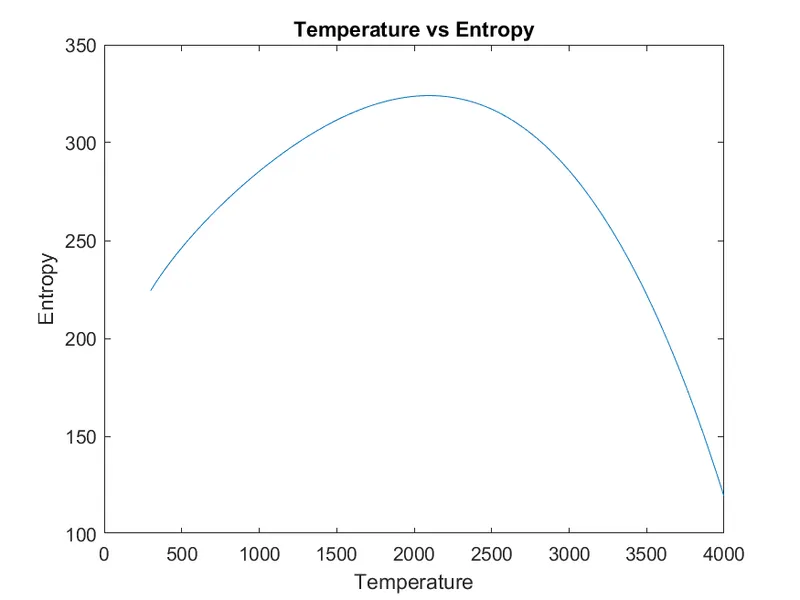
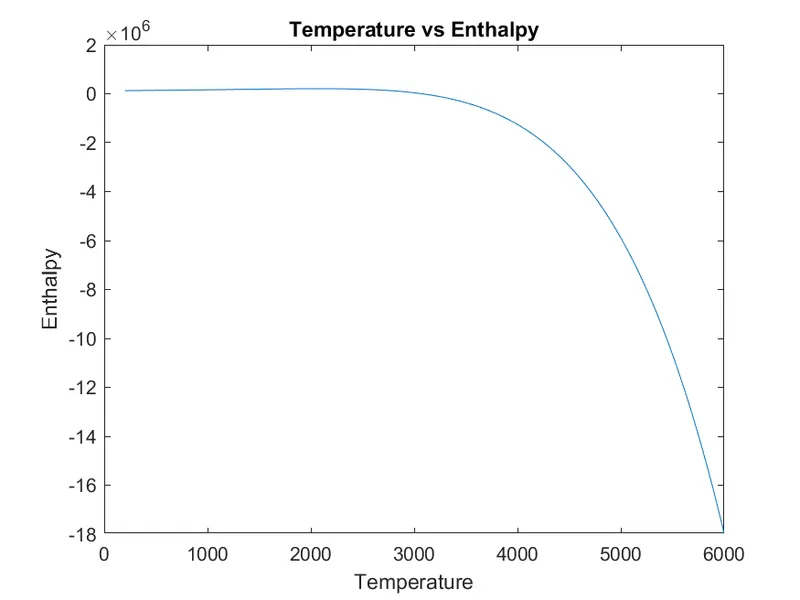
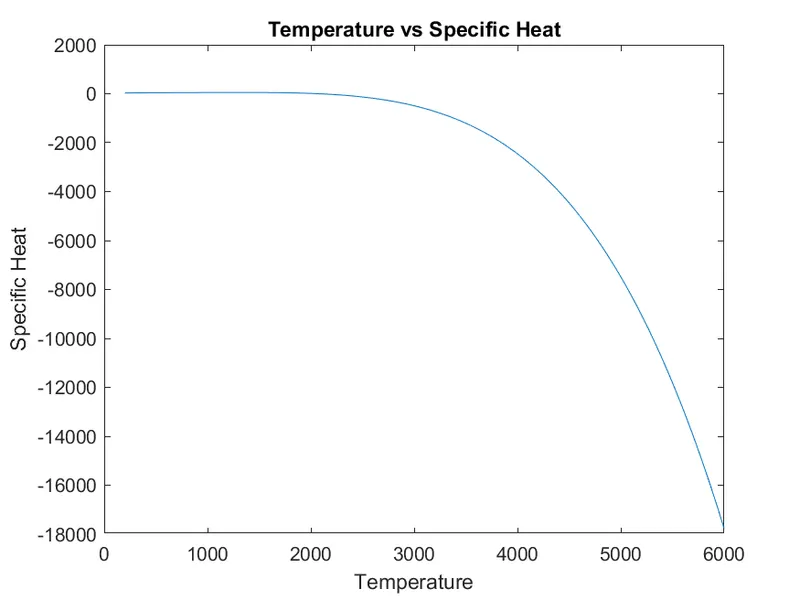
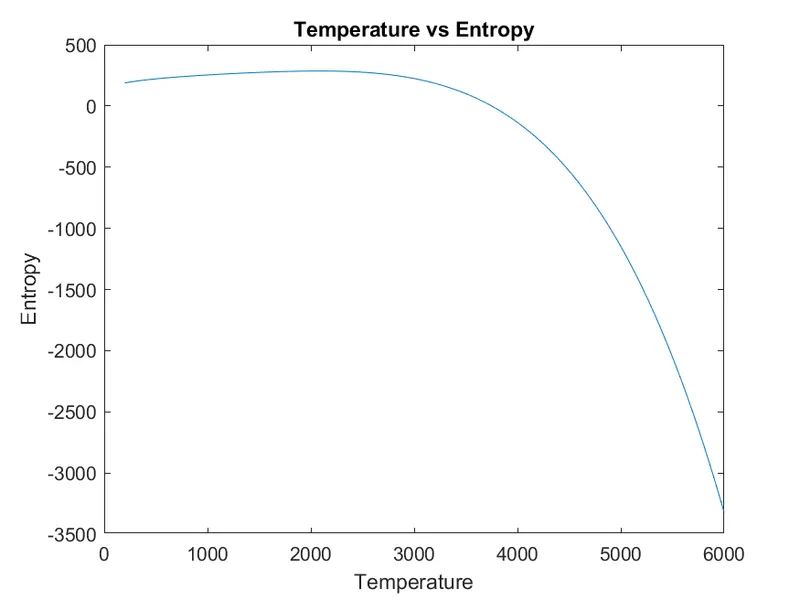
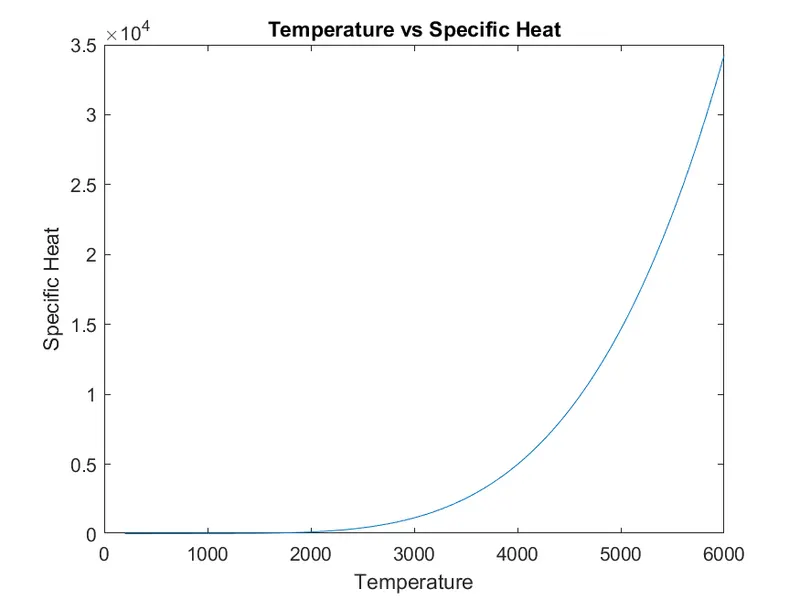
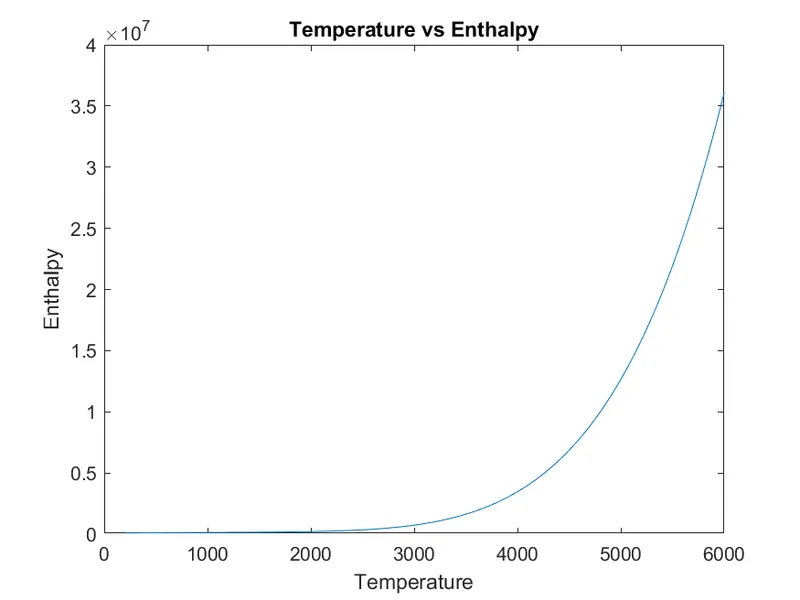
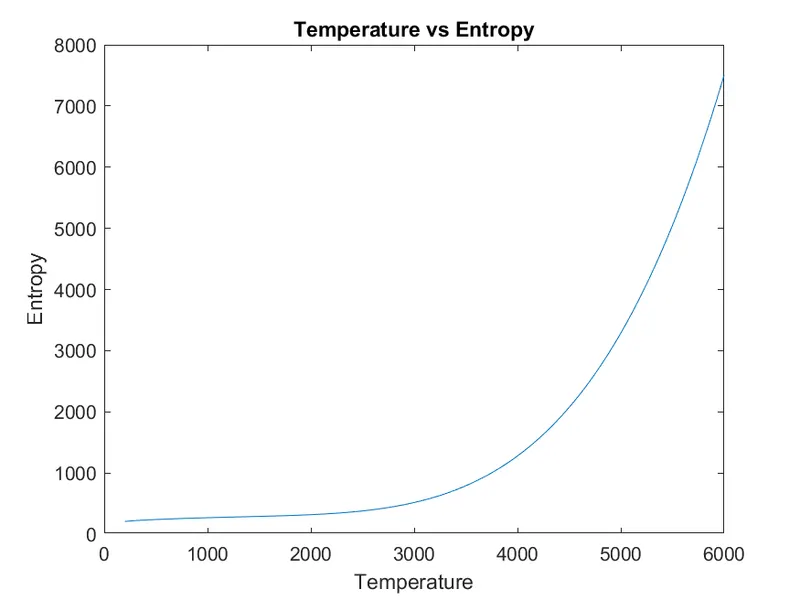
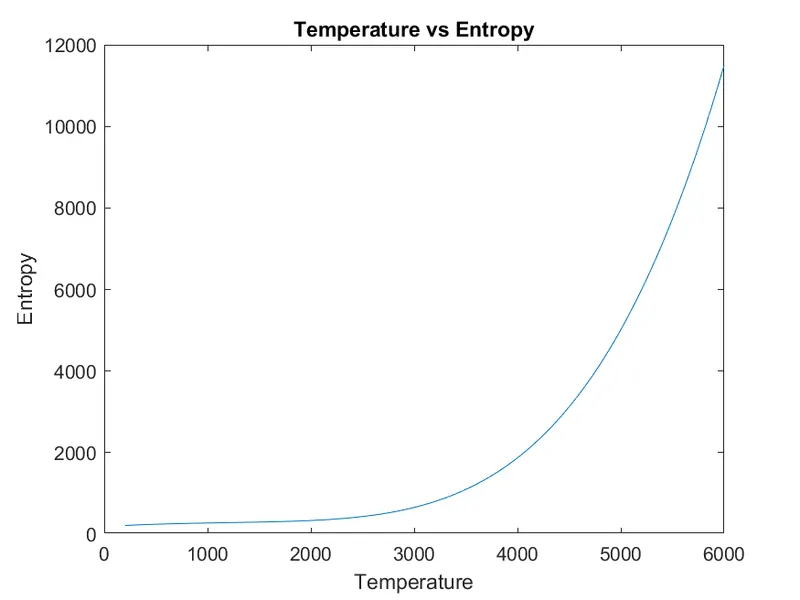
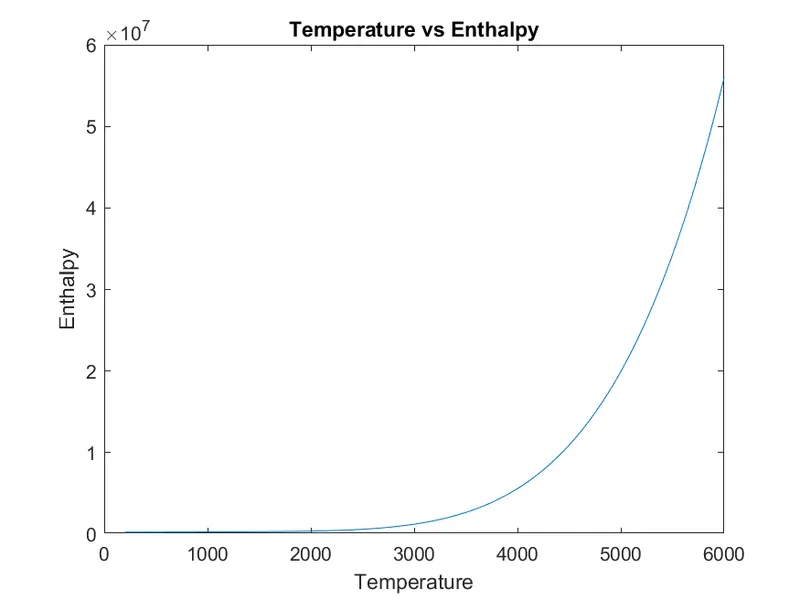
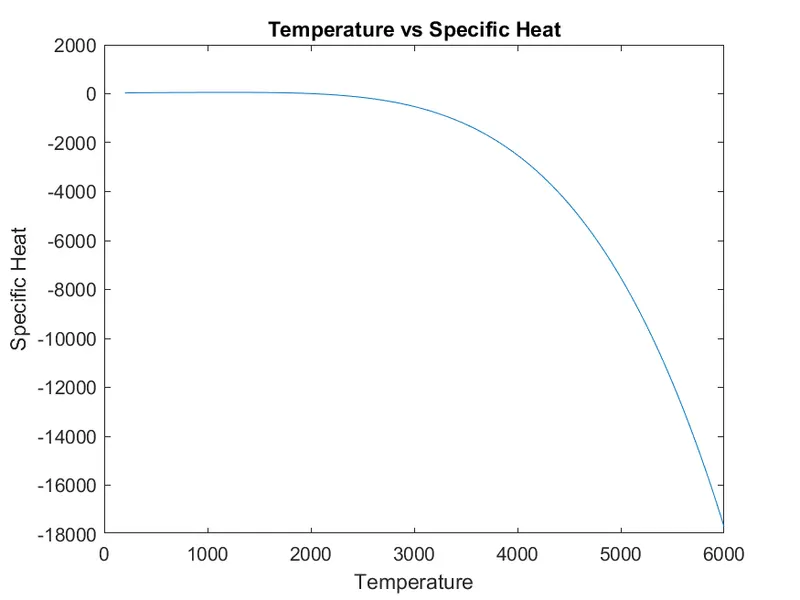
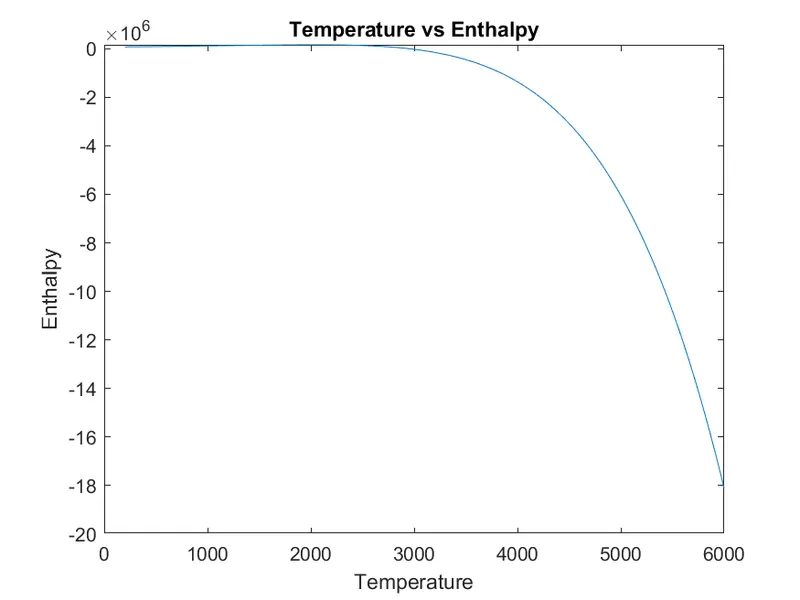
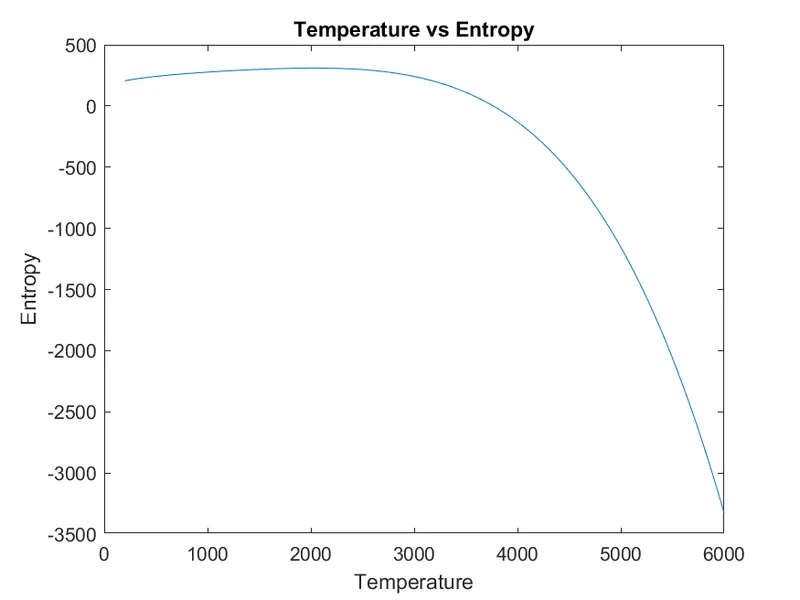
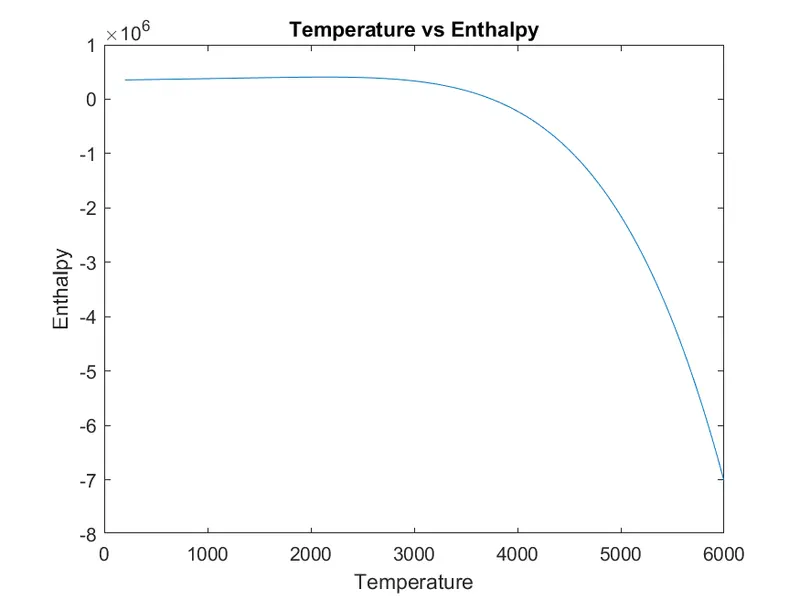
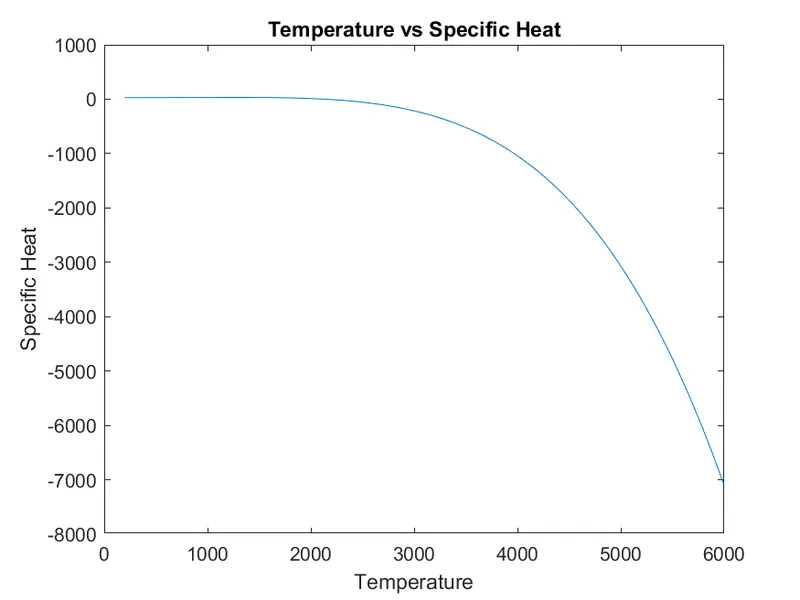
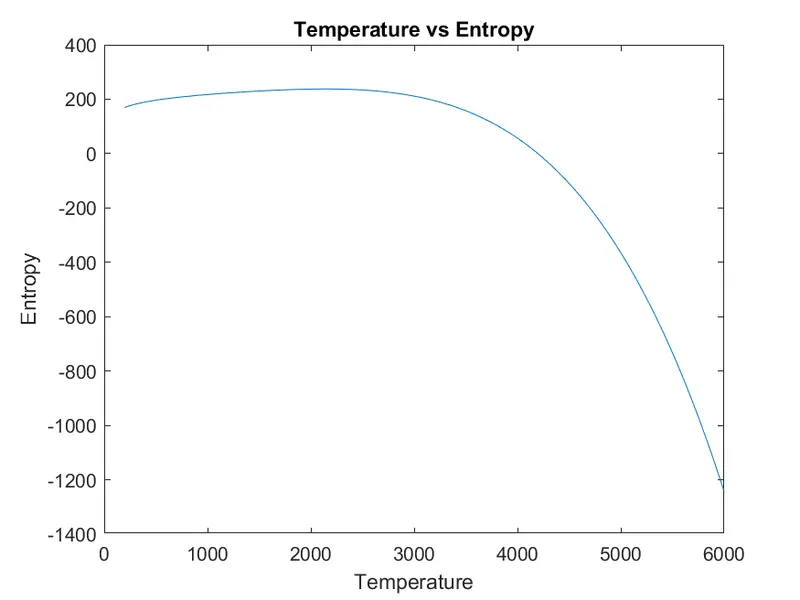
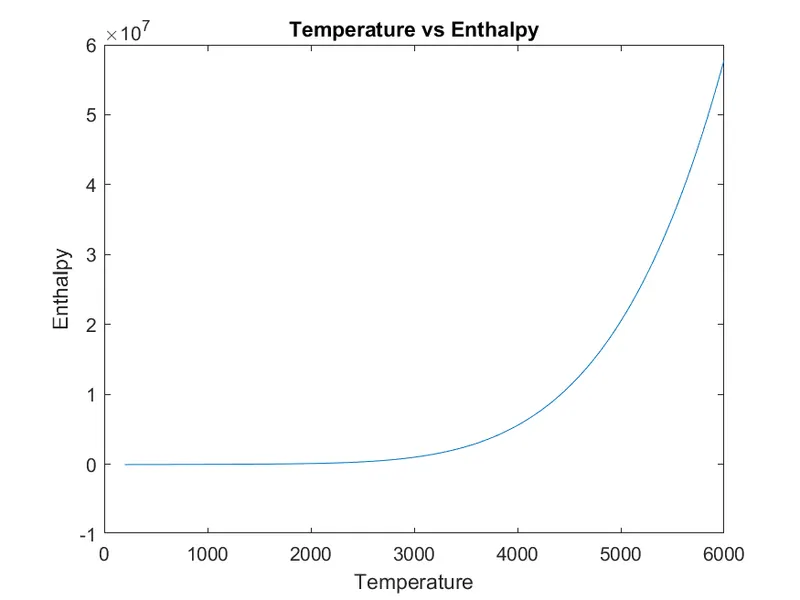
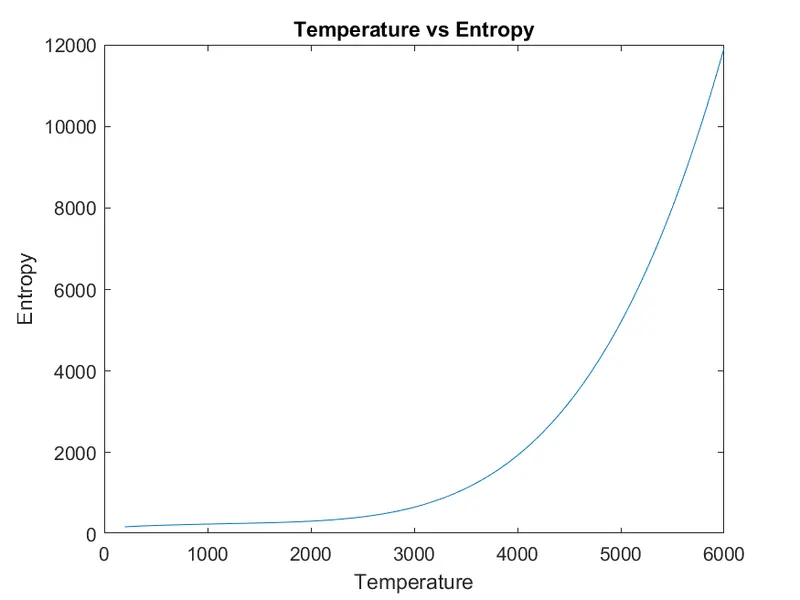
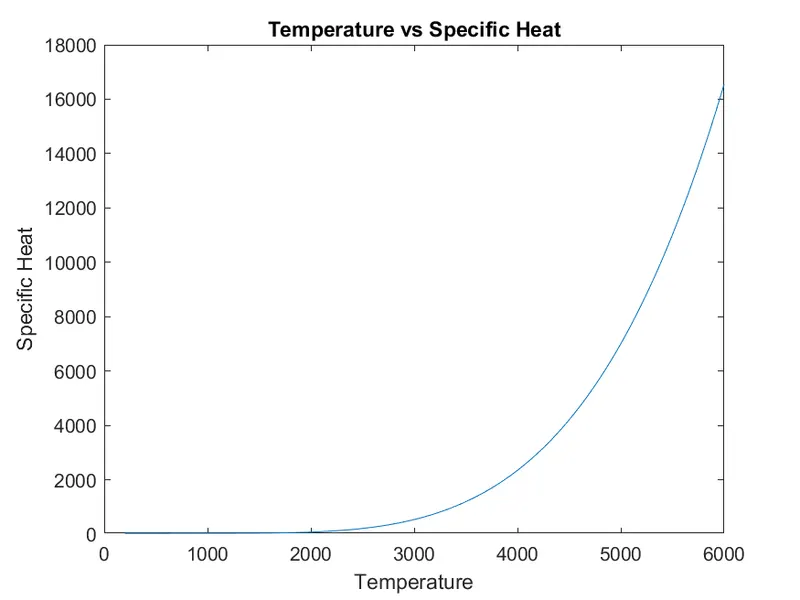
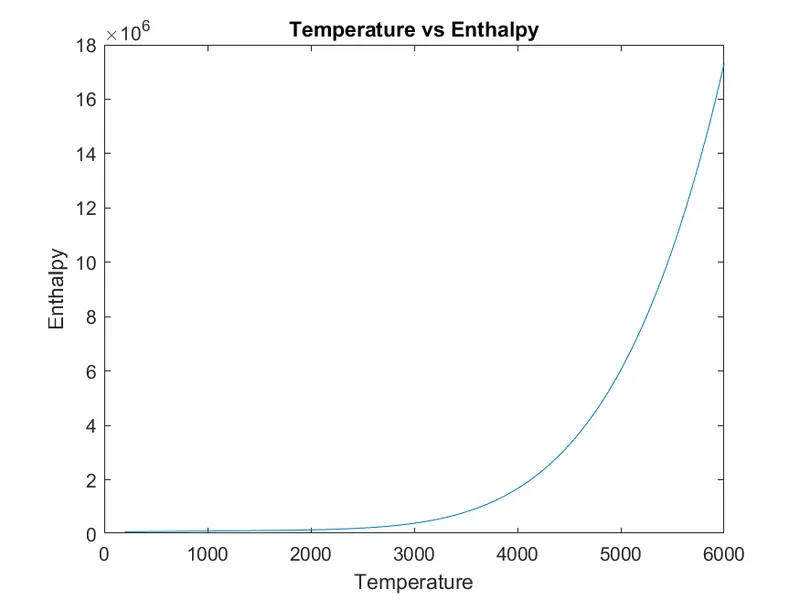
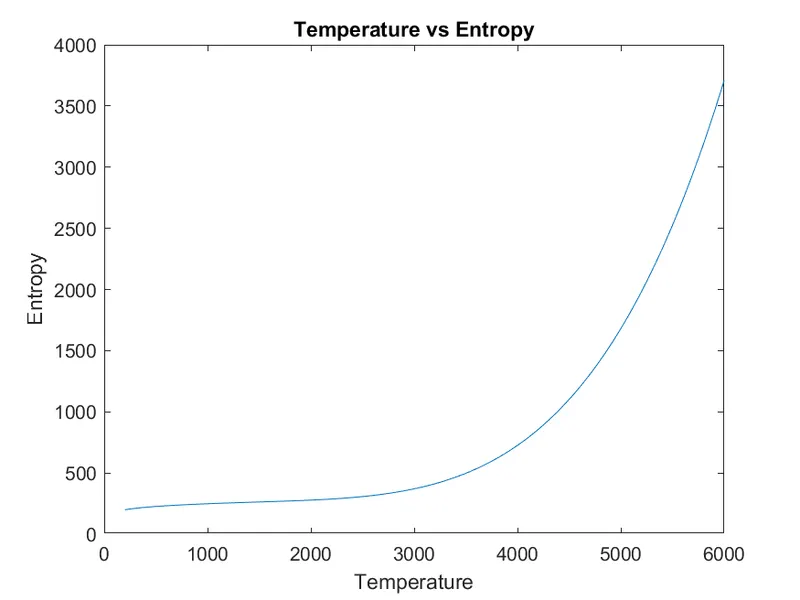
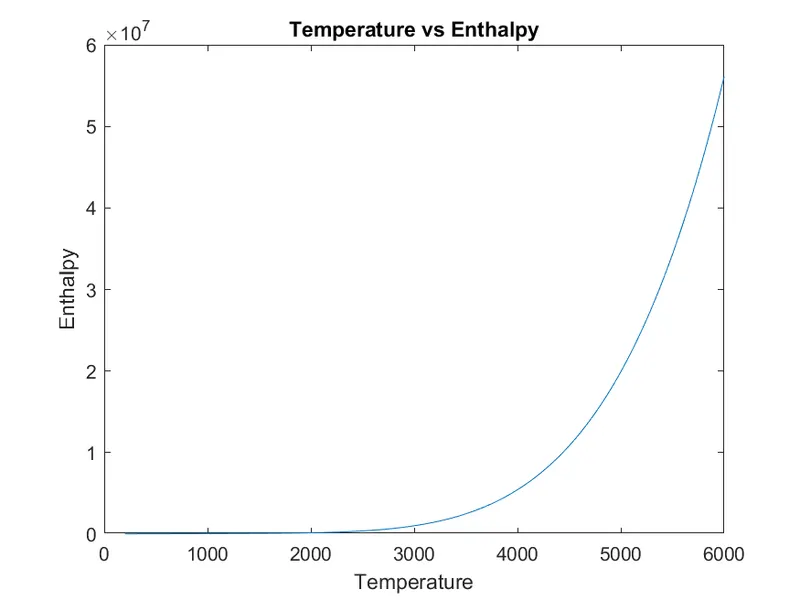
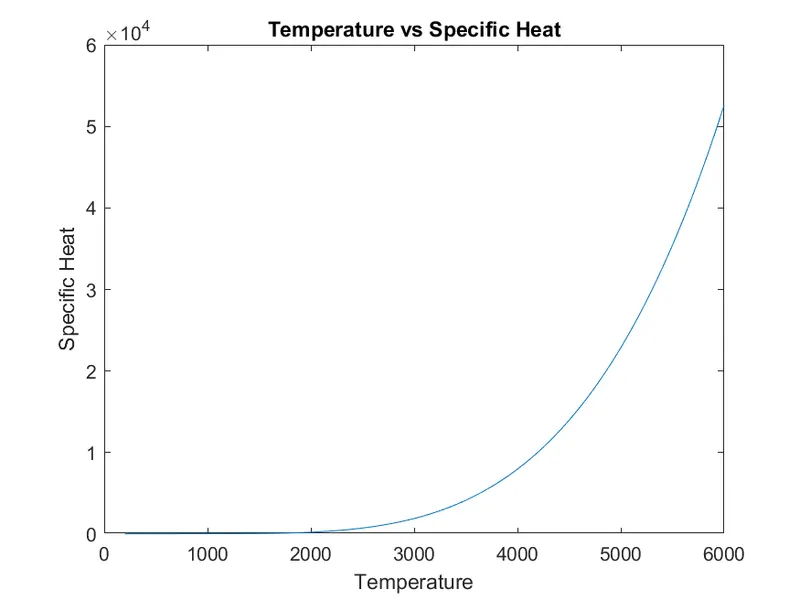
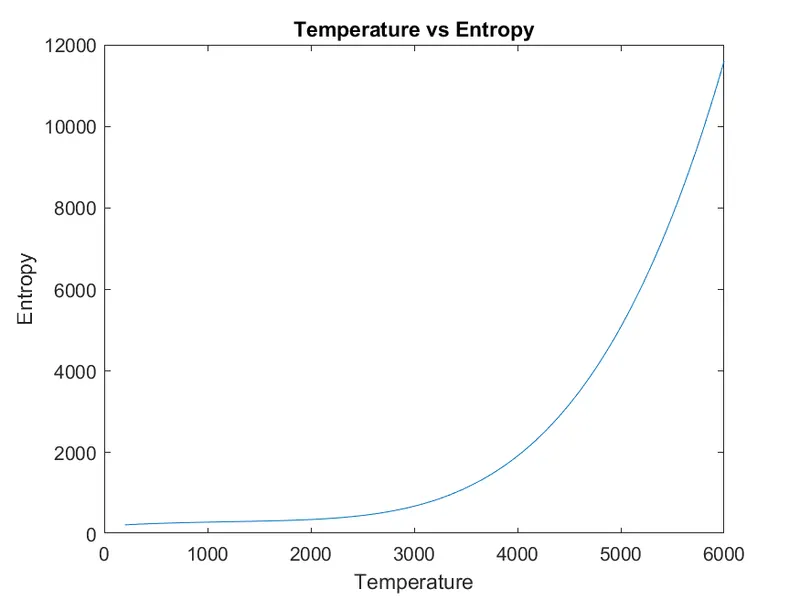
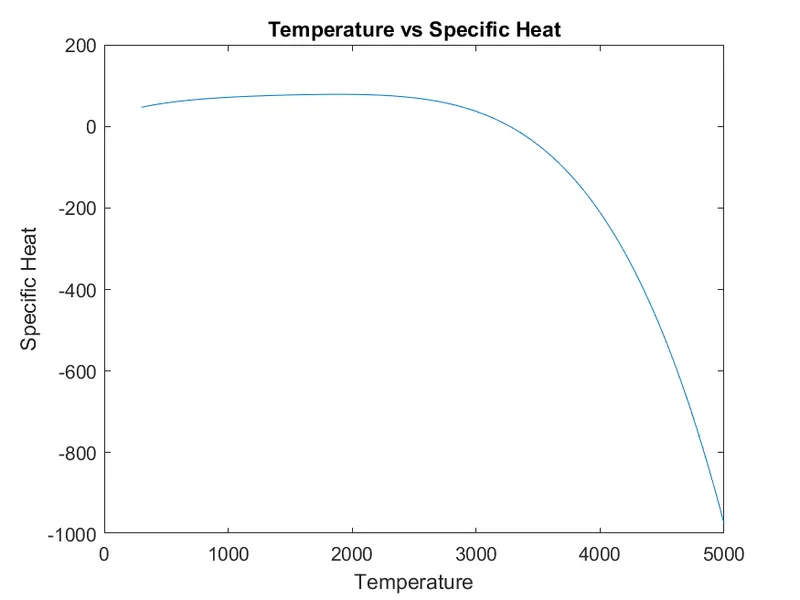
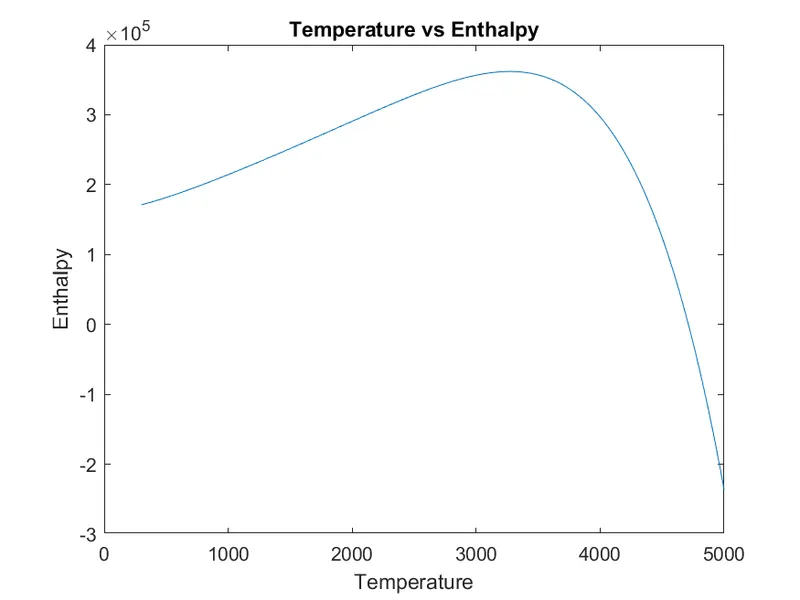
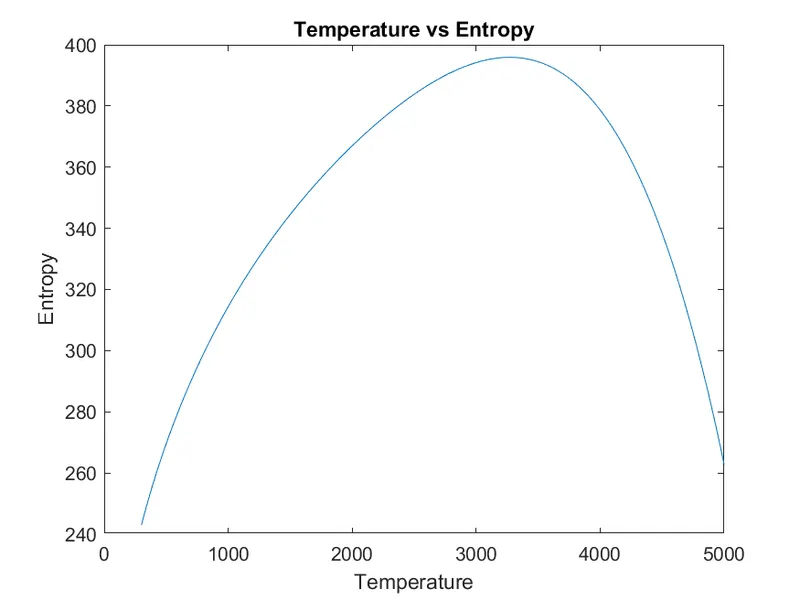
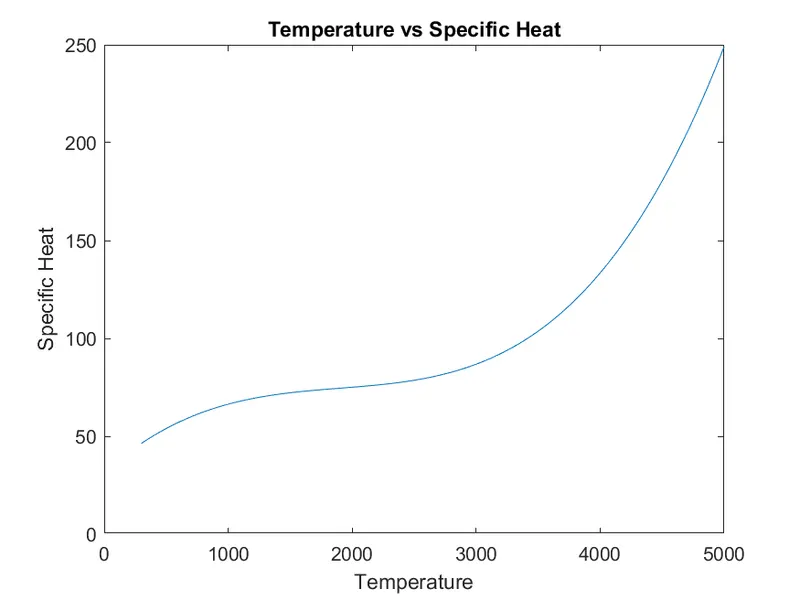
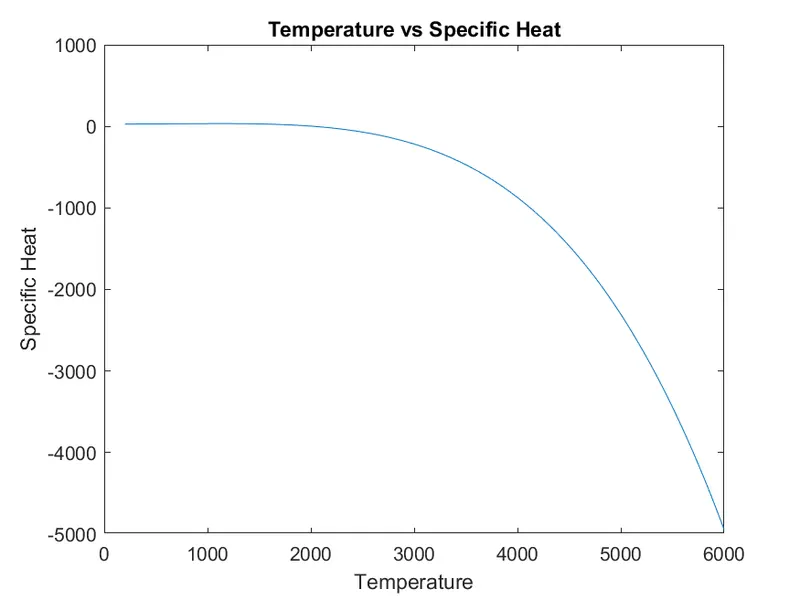
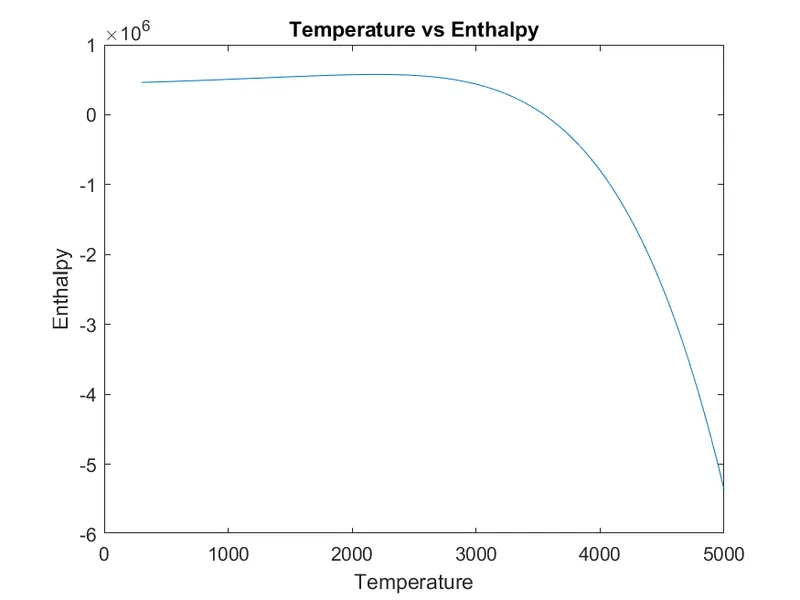
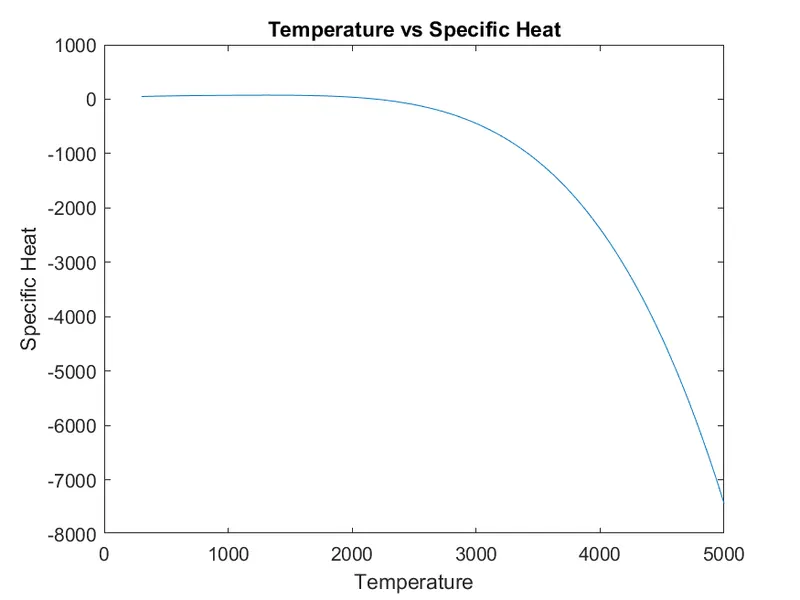
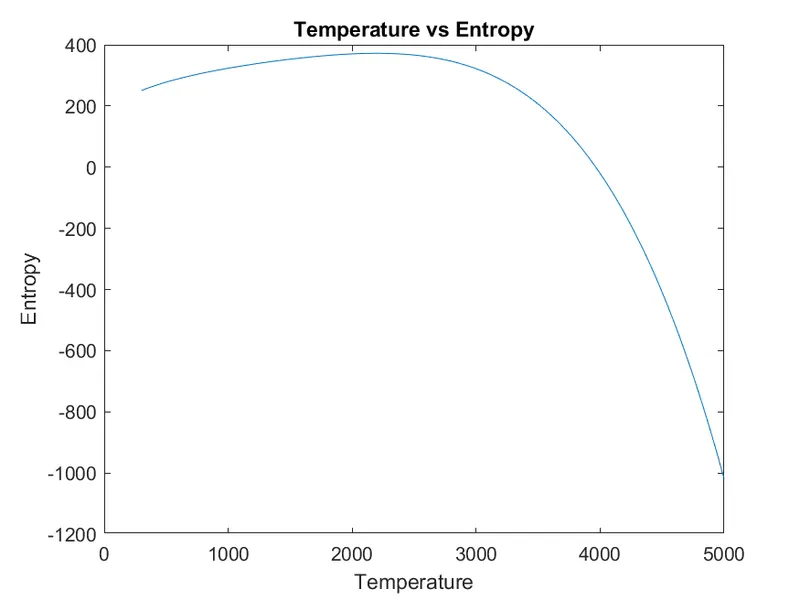
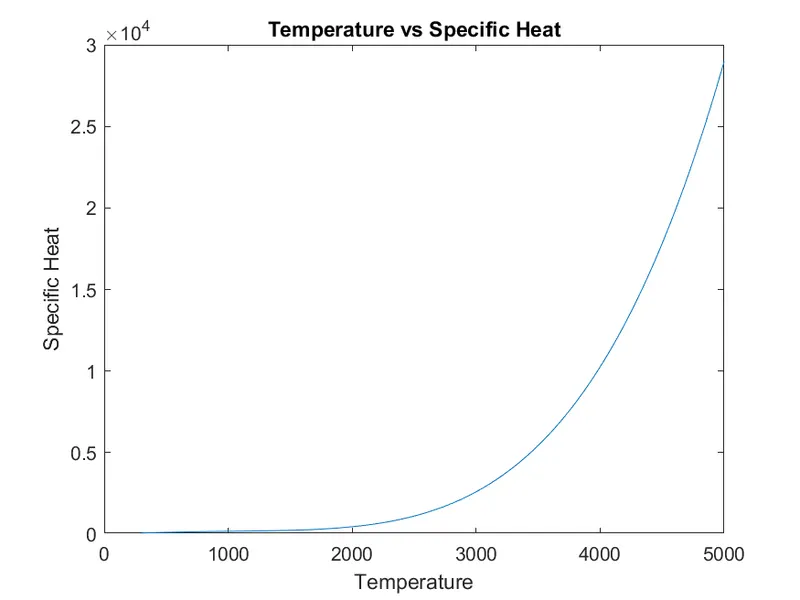
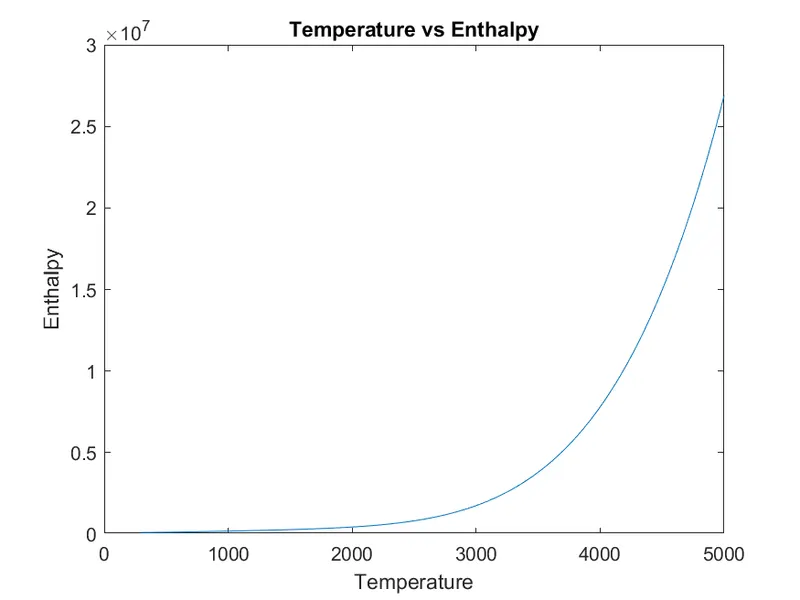
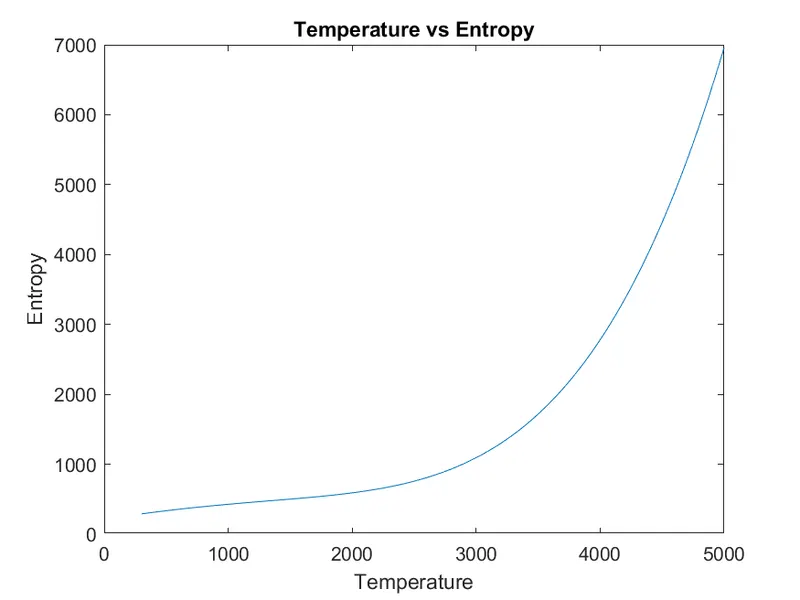
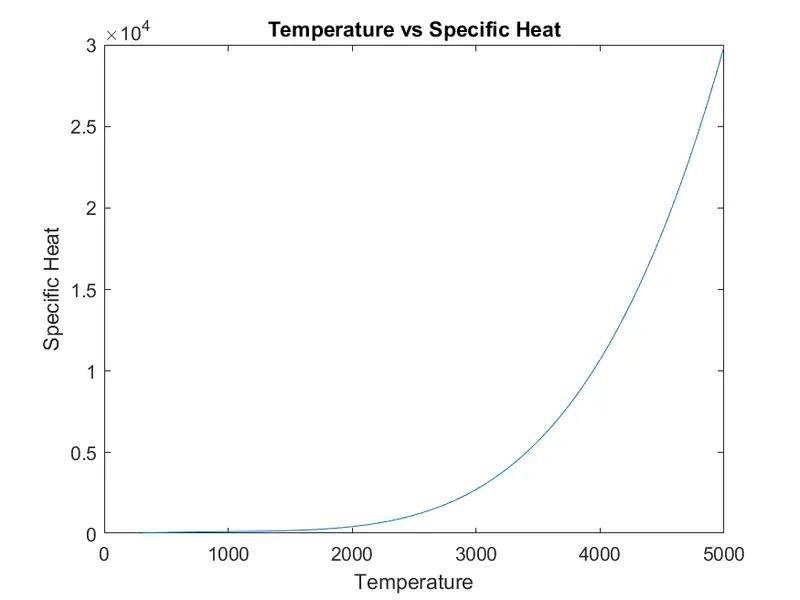
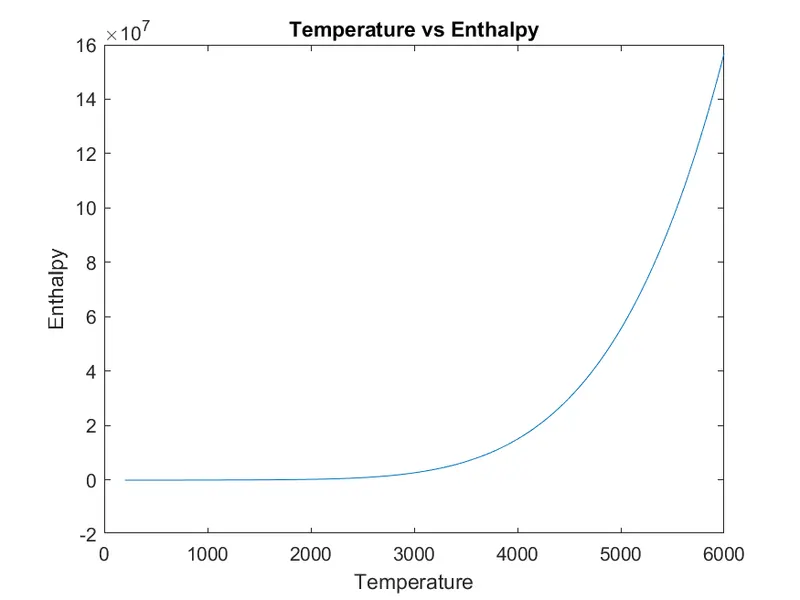
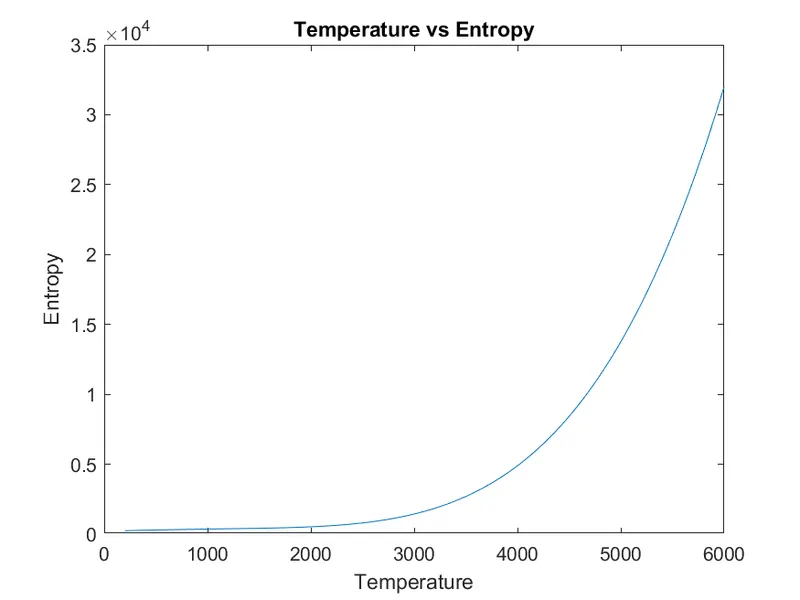
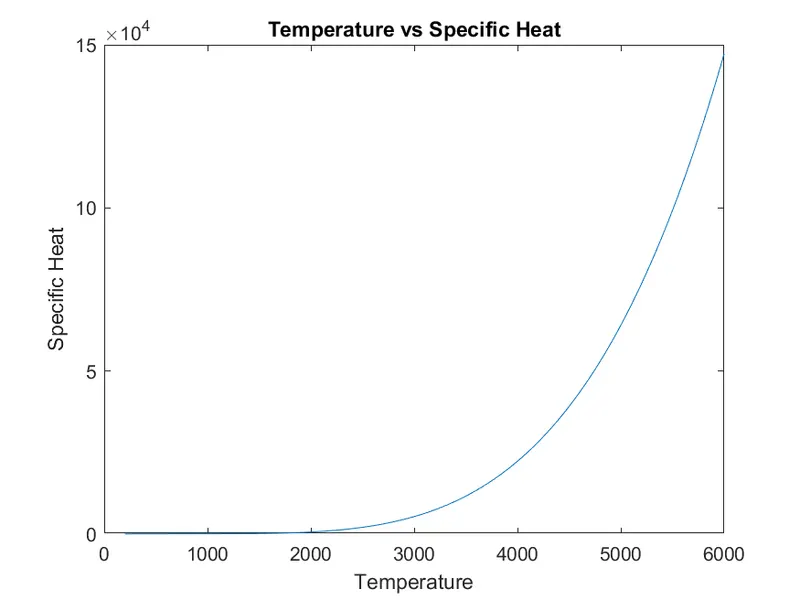
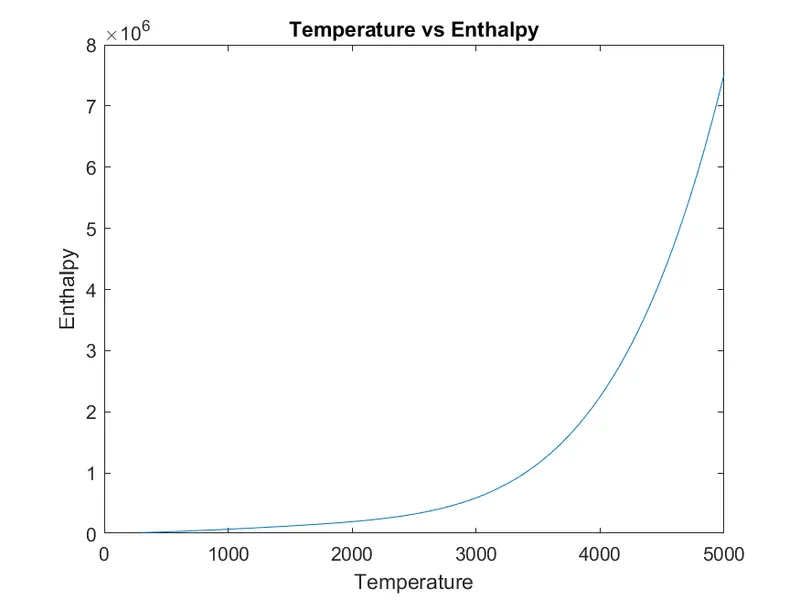
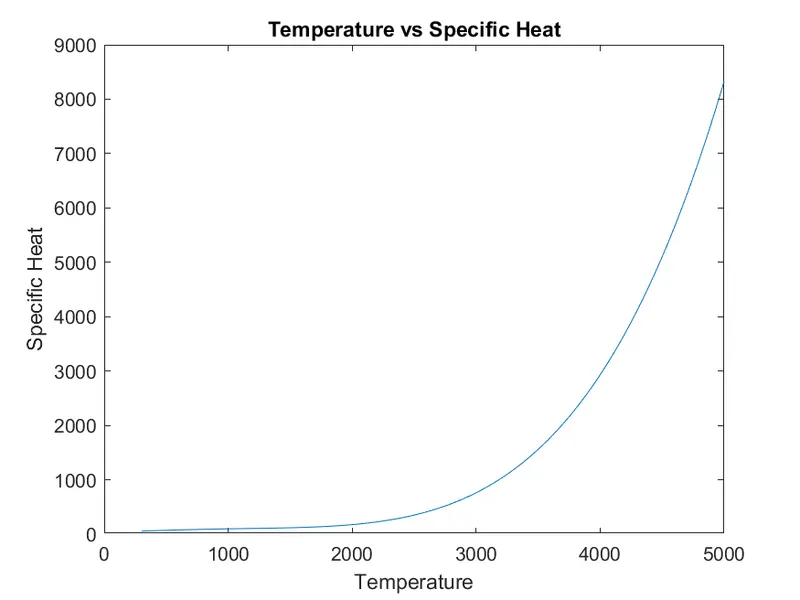
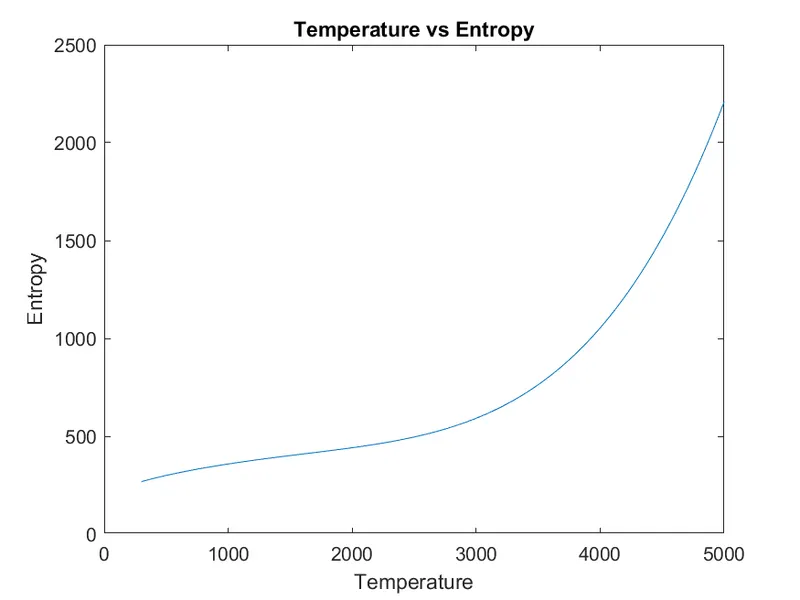
3. Plot the Cp, Enthalpy and Entropy for the local temperature range (low temperature : high temperature) specific for each species.
4. Save the plots as images with appropriate names and dump them in separate folders for each species with suitable name. All these should be generated automatically.
5. The main program that you will submit will just take the "THERMO.dat" file as an input and generate Cp, H and S plots.
6. Please write a detailed report to describe your logic.
Logic to extract data from 'Thermo.dat' file:
- It can be seen that the 1st line is the title and the 3rd, 4th and 5th lines are just comments, which are not in the scope of our parsing(they dont possess any valuble data needed for our calculation).
- The 2nd line has 3 temperature values which are the global temperatures for the entire data set. This can be stored in a variable and also not significant for our calculation as we intend to use the local temperatures of each species in particular to plot and calculate.
- From the 6th line the species data starts and goes upto the end of the dataset. It can easily be noted a significant pattern in the species data distribution.
- That is, each species has 4 lines of data.
- The 1st species line has, the local low, High and mid temperatures respectively.
- Whereas, the 2nd to 4th species line has the 14 coefiicient values(unique for each species).
- The first 7 coefficients are high temp coeffs, ie. the temp value above mid temperature must be used in order to calcualte Cp, H and S.
- The last 7 coefficients are low temp coeffs, ie. the temp values below mid temperature must be used in order to calculate Cp, H and S.
Introduction:
Parsing, syntax analysis, or syntactic analysis is the process of analyzing a string of symbols, either in natural language, computer languages or data structures, conforming to the rules of a formal grammar. The term parsing comes from Latin pars (orationis), meaning part (of speech).
Parsing in computer languages refers to syntactic analysis of the input code into its components parts in order to facilitate the writing of compilers and interpreters. It can be used to describe split or separation.
Parsing a file means reading in a data stream of some sort and building an in memory model of the semantic content of that data. This aims at facilitating perfoming some kind of transformation on the data.
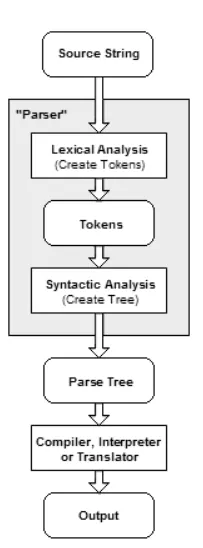
Types of parsers
The task of the parser is essentially to determine if and how the input can be derived from the start symbol of the grammar. This can be done in essentially two ways:
Top-down parsing - Top-down parsing can be viewed as an attempt to find left-most derivations of an input-stream by searching for parse trees using a top-down expansion of the given formal grammar rules. Tokens are consumed from left to right. Inclusive choice is used to accommodate ambiguity by expanding all alternative right-hand-sides of grammar rules.[11] This is known as the primordial soup approach. Very similar to sentence diagramming, primordial soup breaks down the constituencies of sentences.[12]
Bottom-up parsing - A parser can start with the input and attempt to rewrite it to the start symbol. Intuitively, the parser attempts to locate the most basic elements, then the elements containing these, and so on. LR parsers are examples of bottom-up parsers. Another term used for this type of parser is Shift-Reduce parsing.
SOLUTION:
Programming Language: MATLAB
Code :-
Function Code -
Main Code -
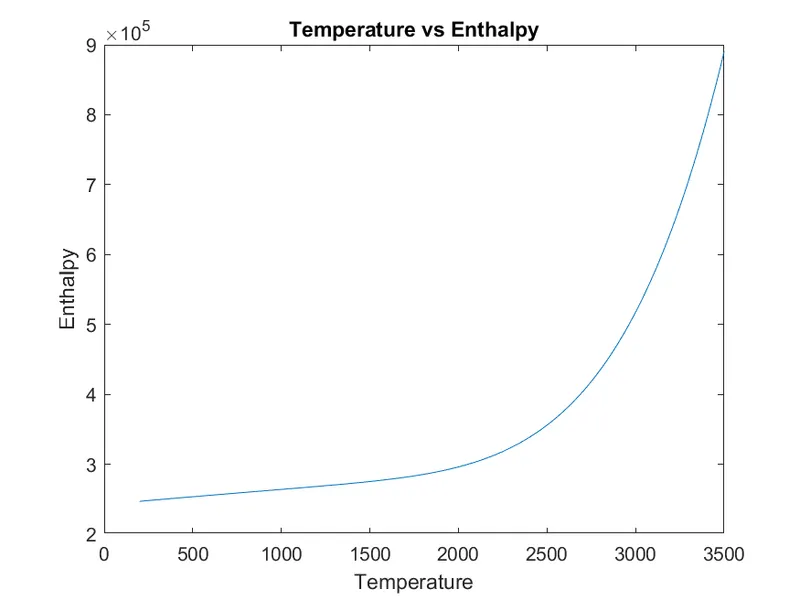
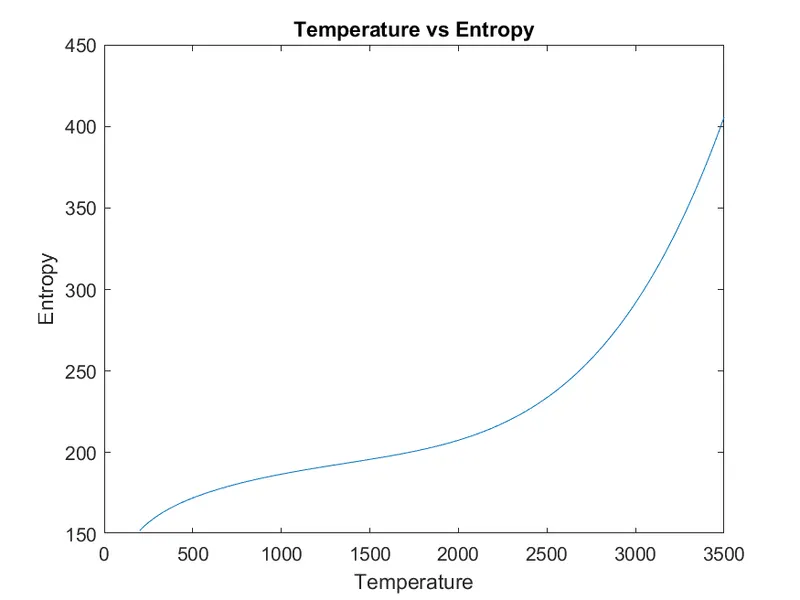
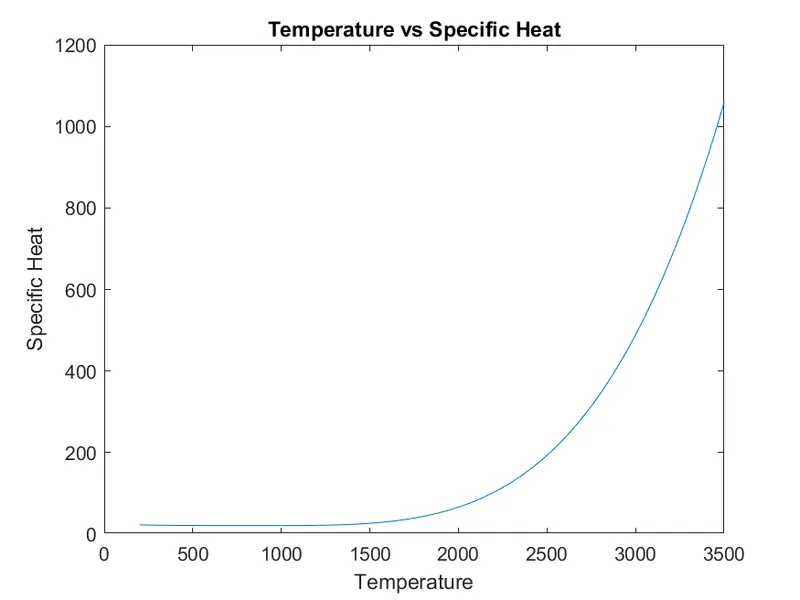
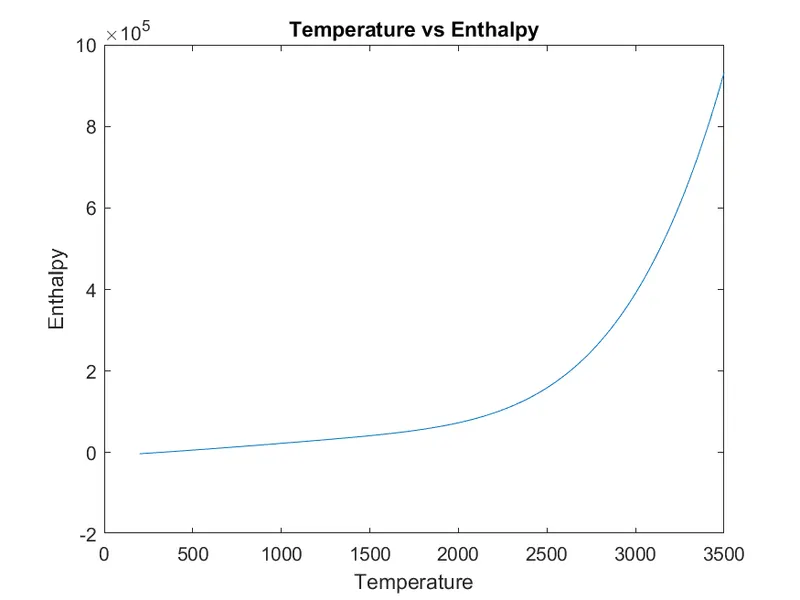
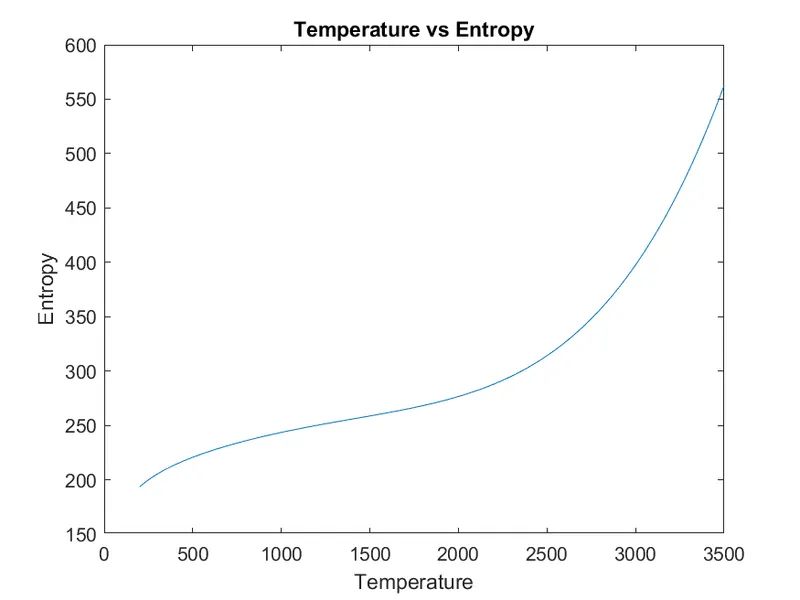
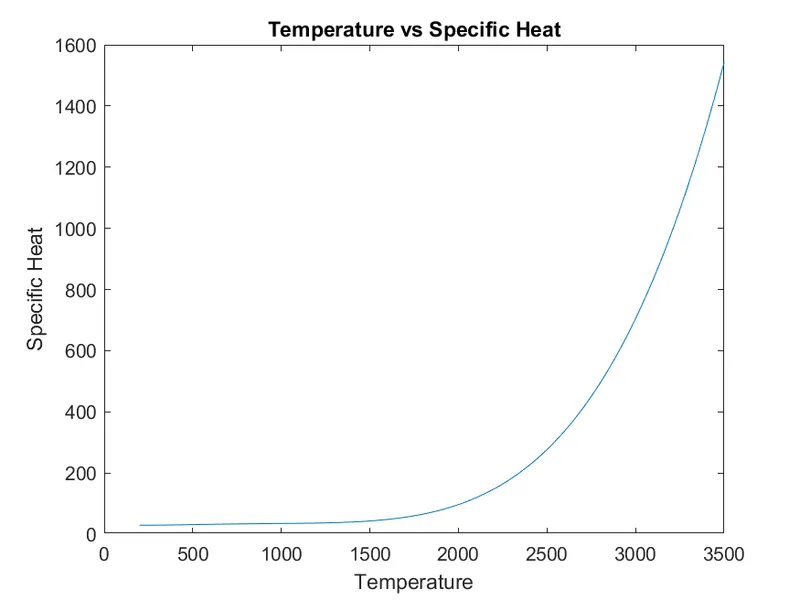
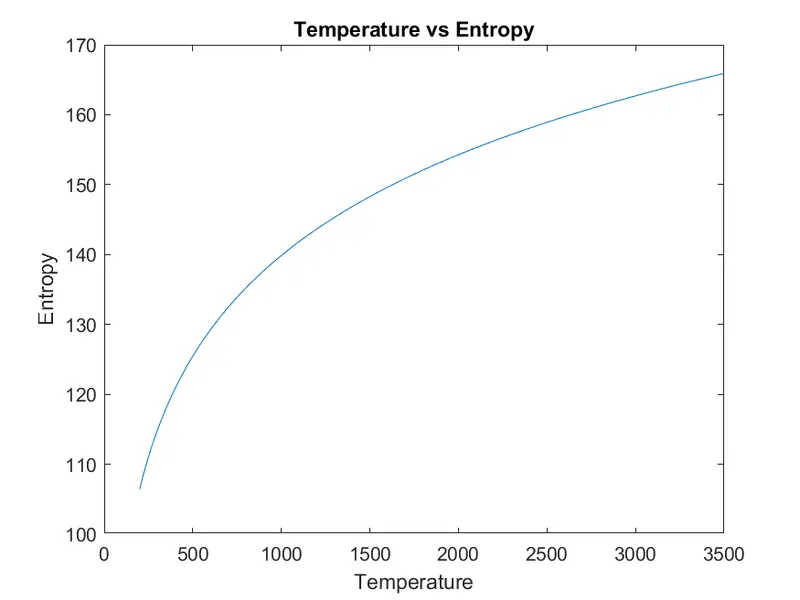
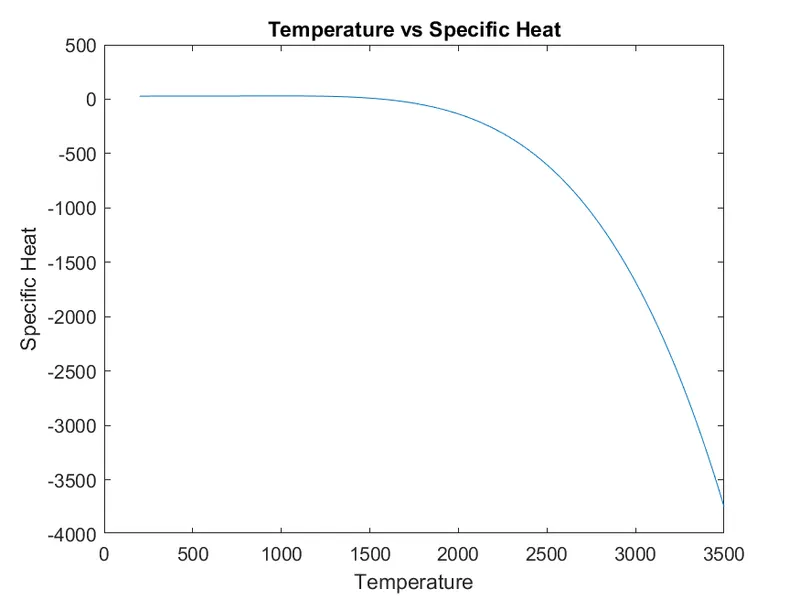
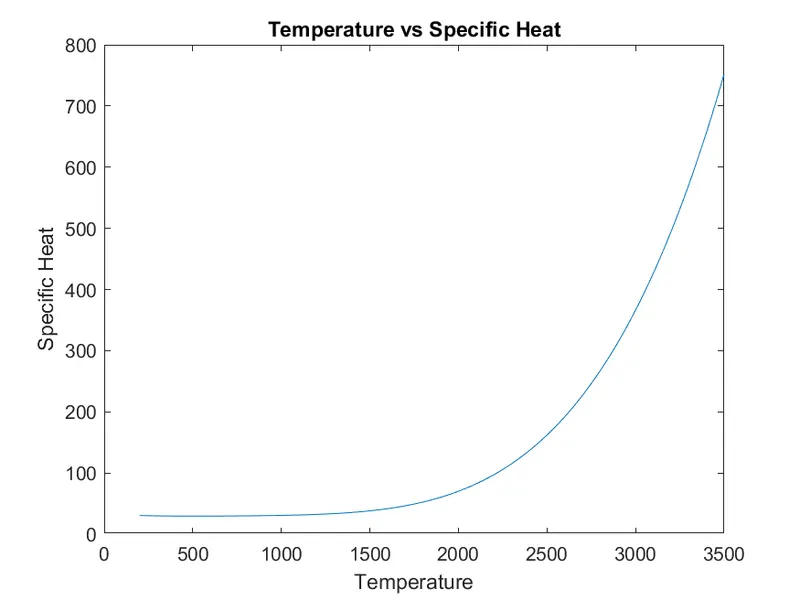
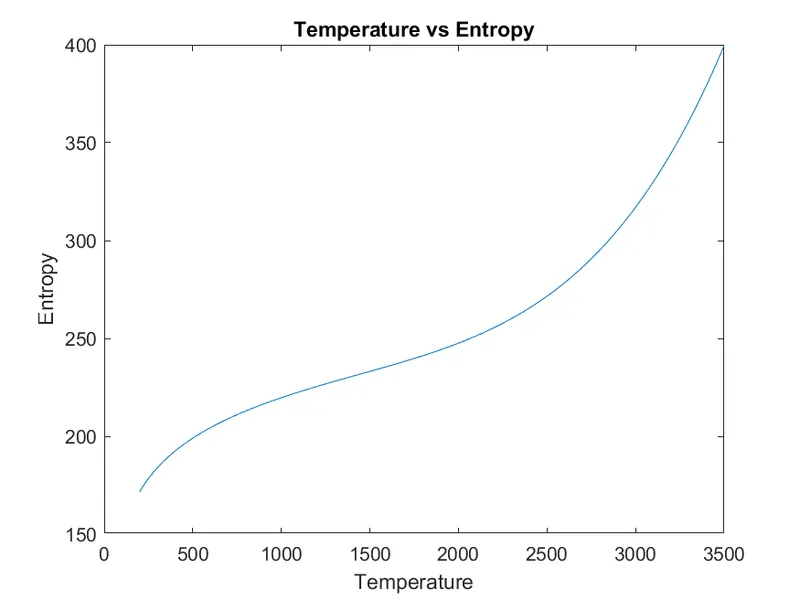
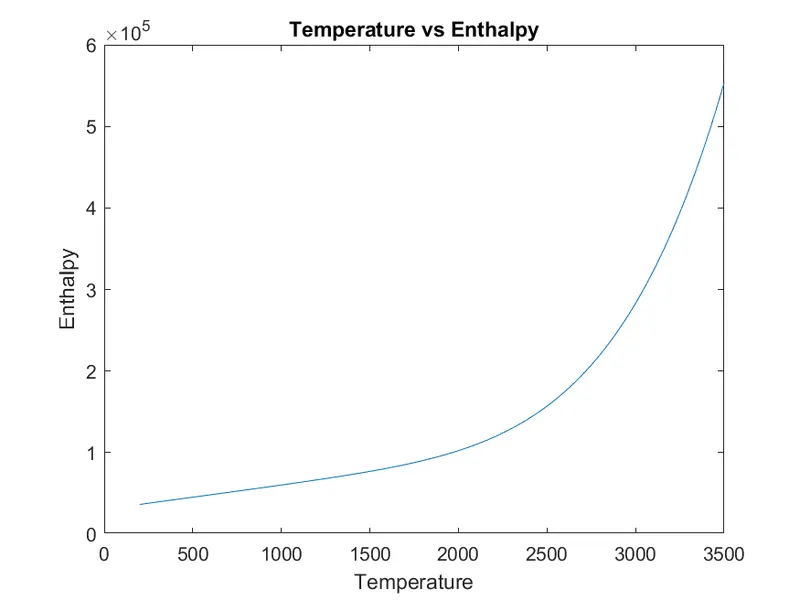
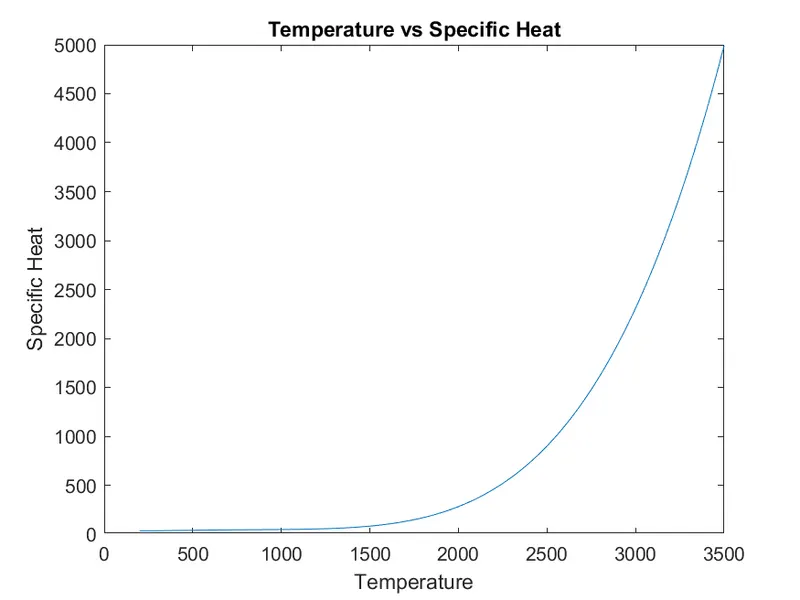
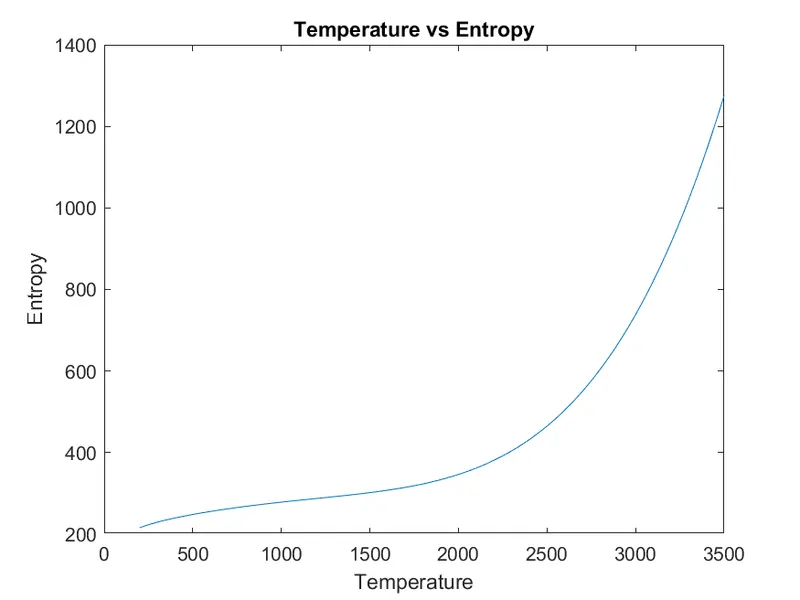
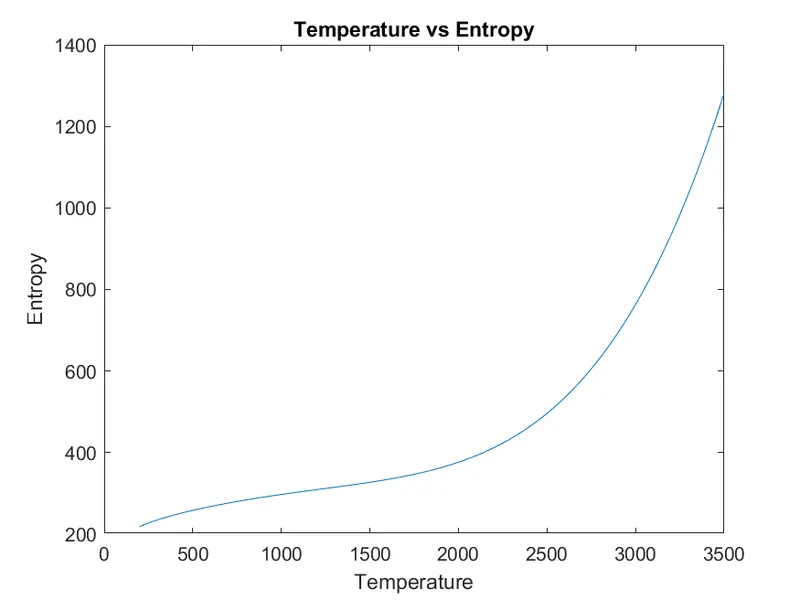
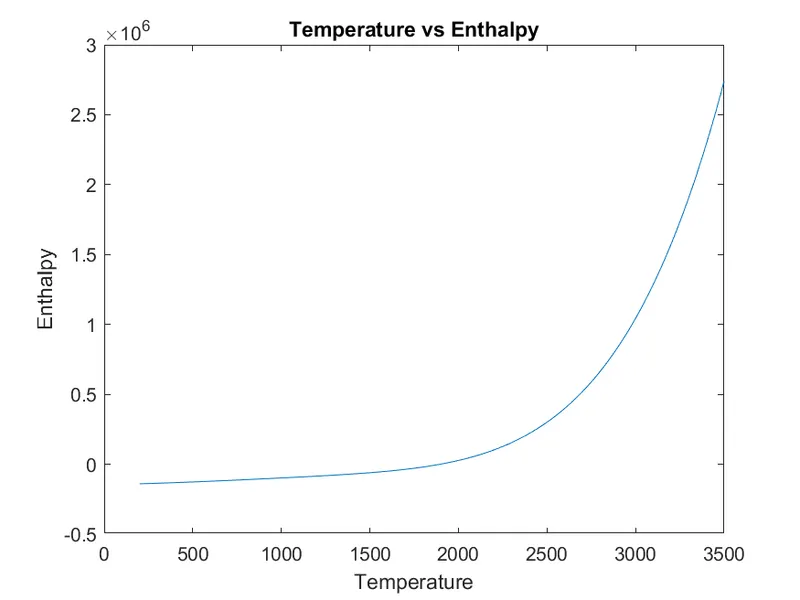
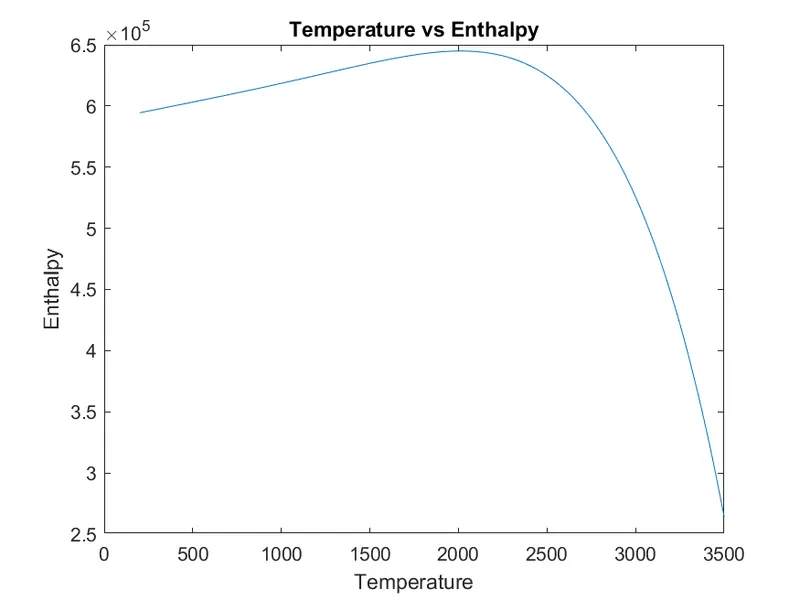
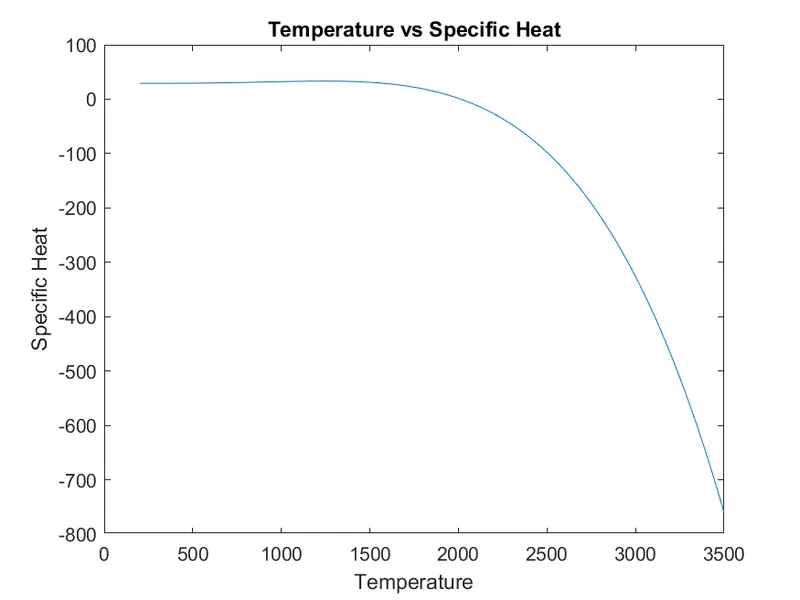
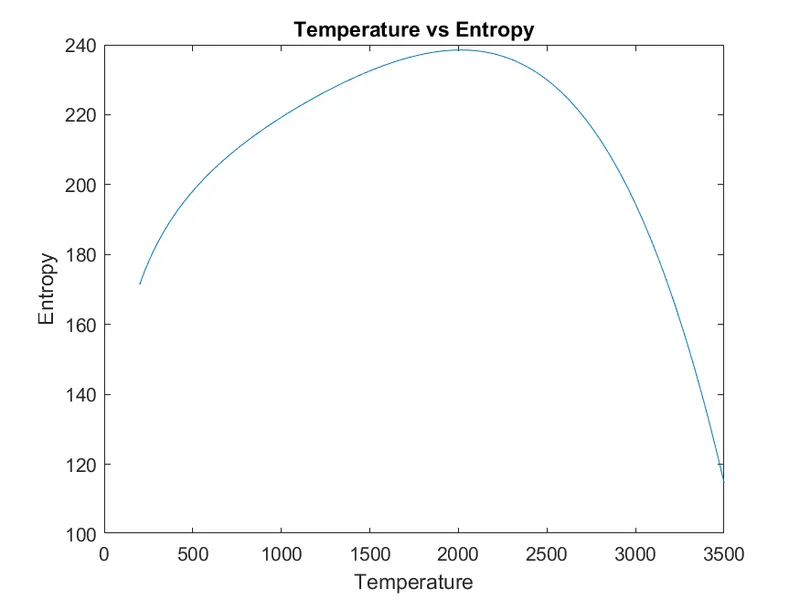
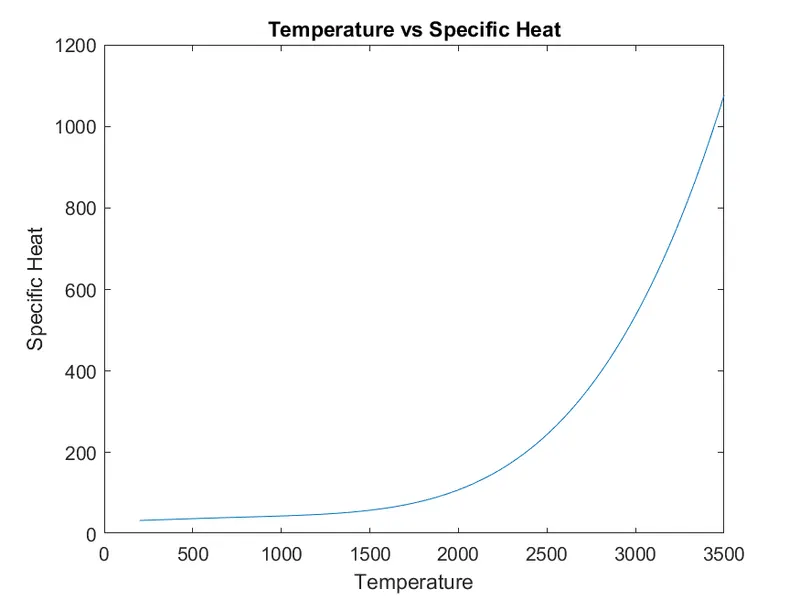
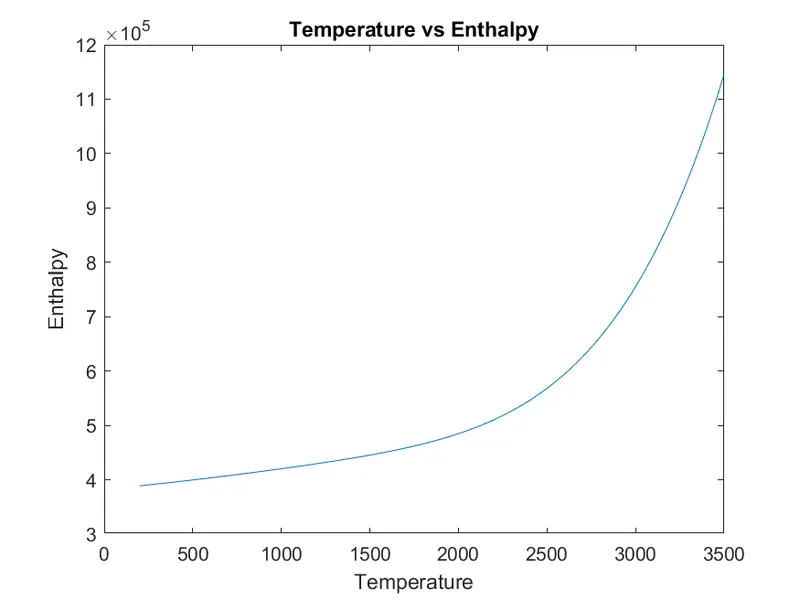
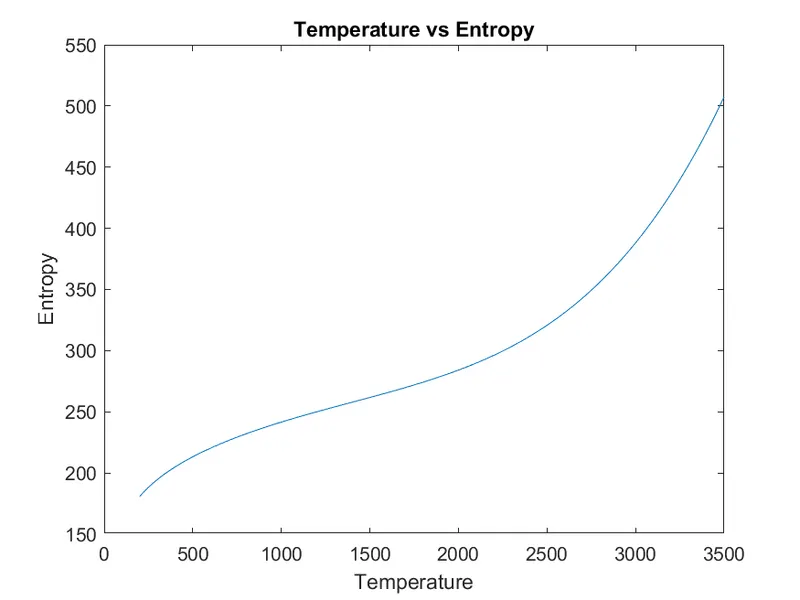
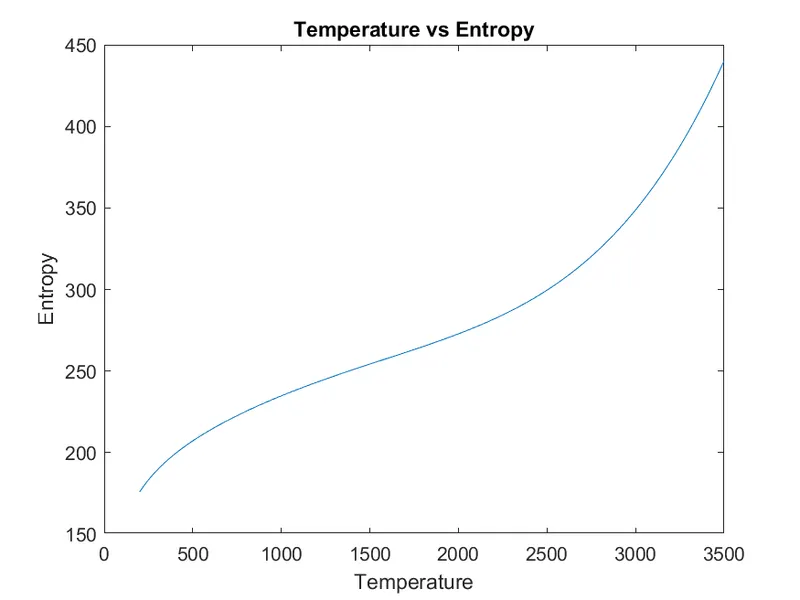
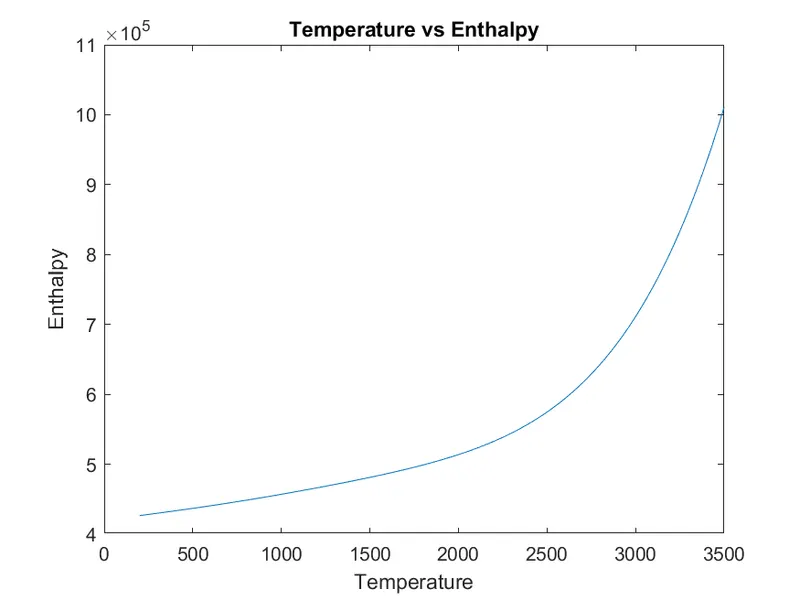
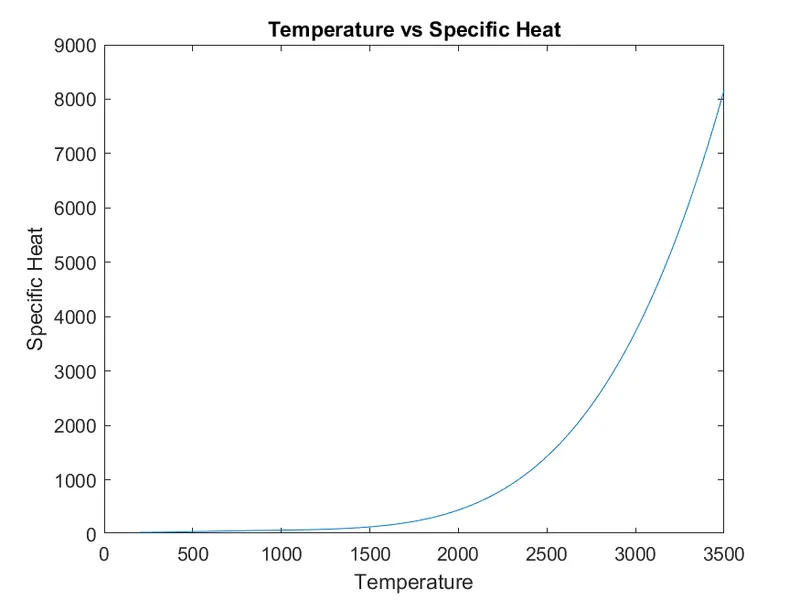
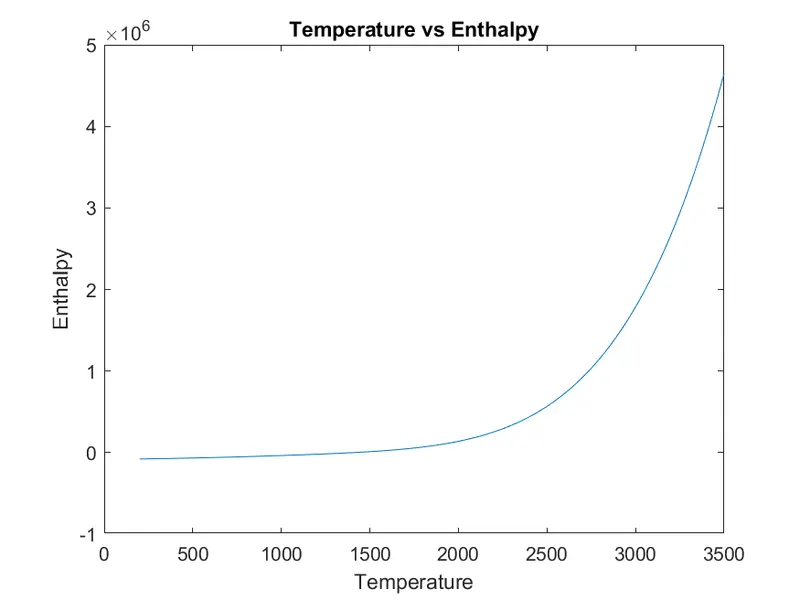
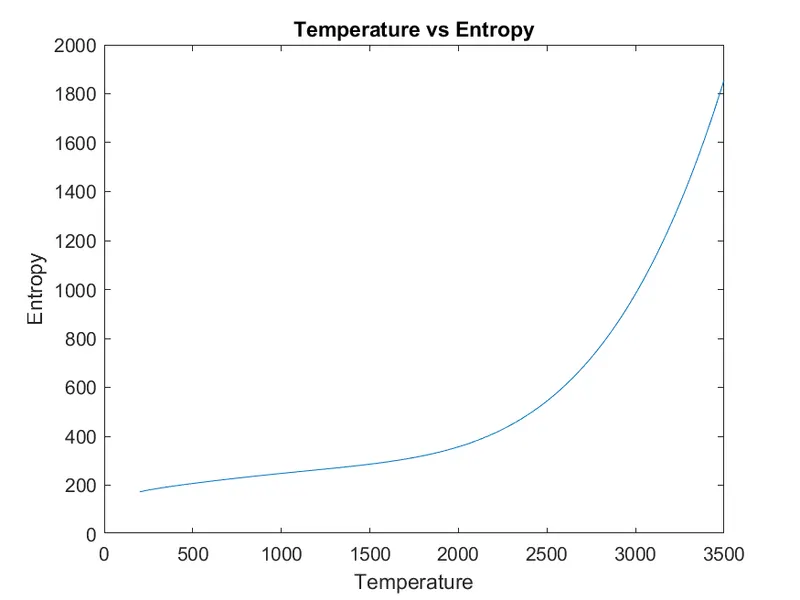
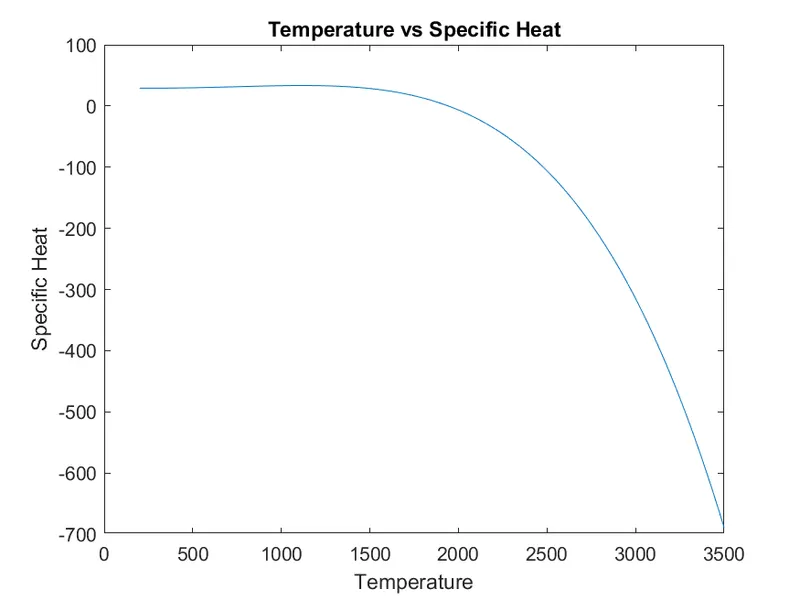
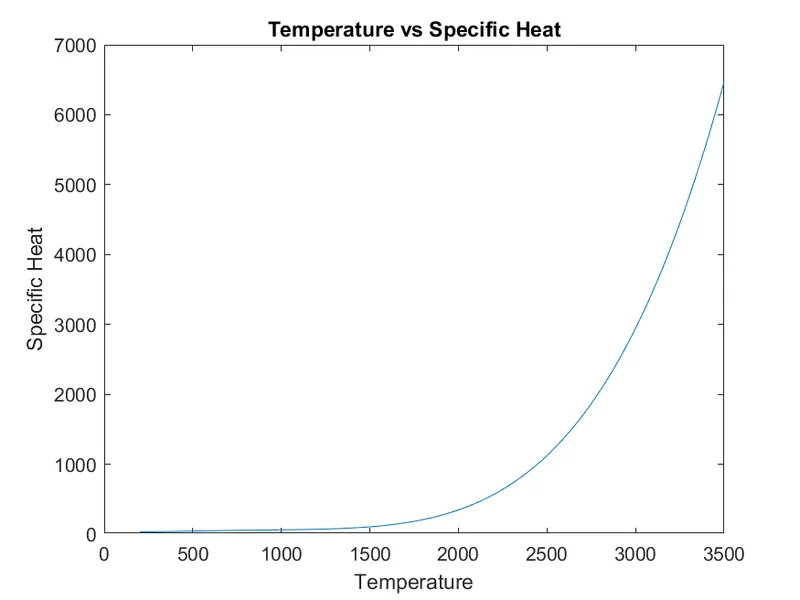
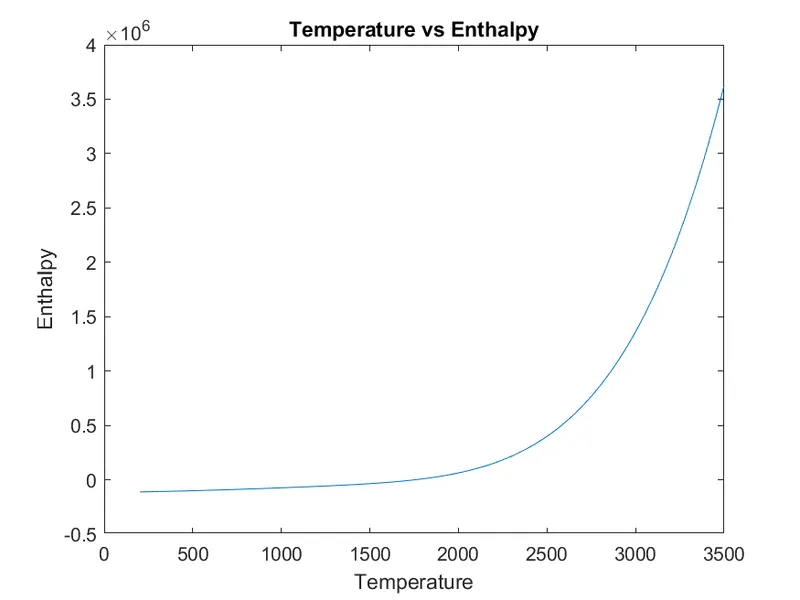
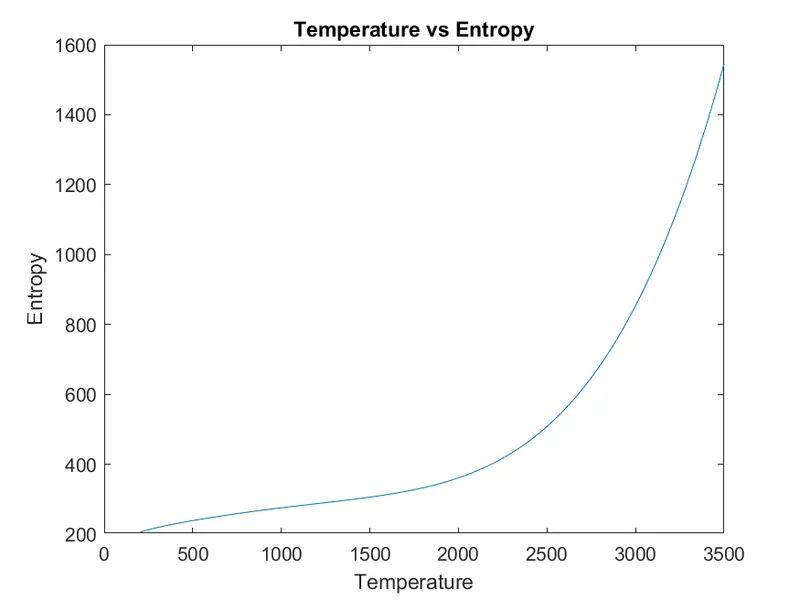
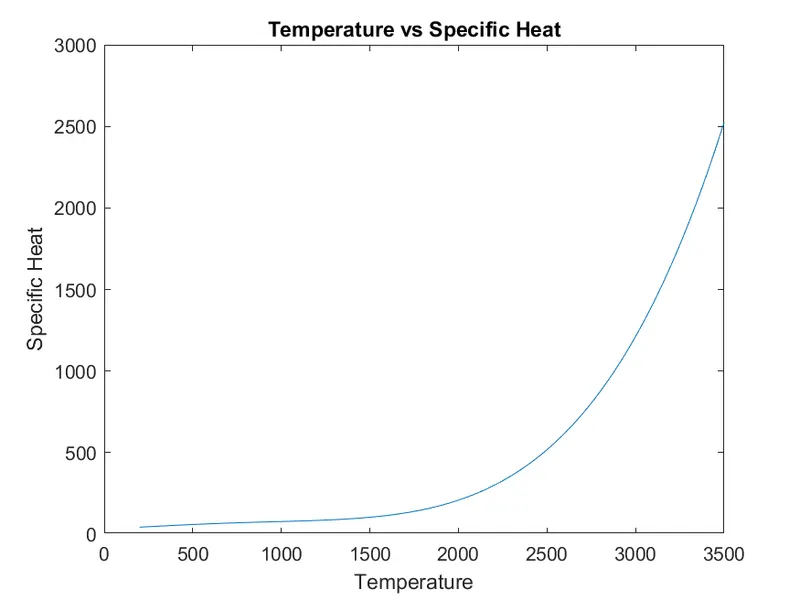
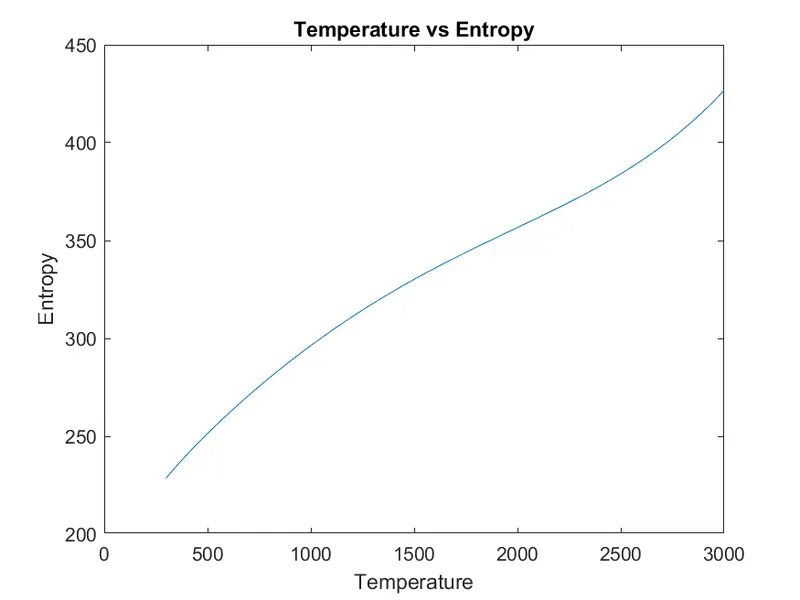
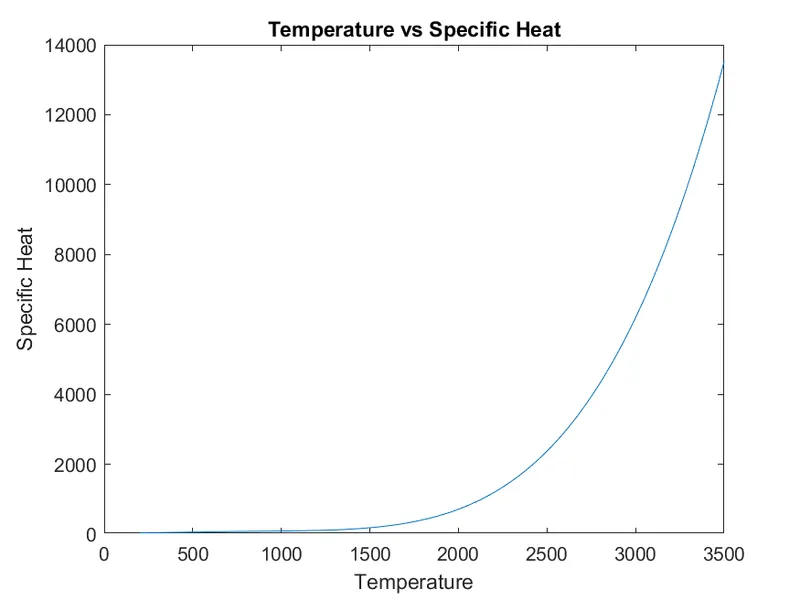
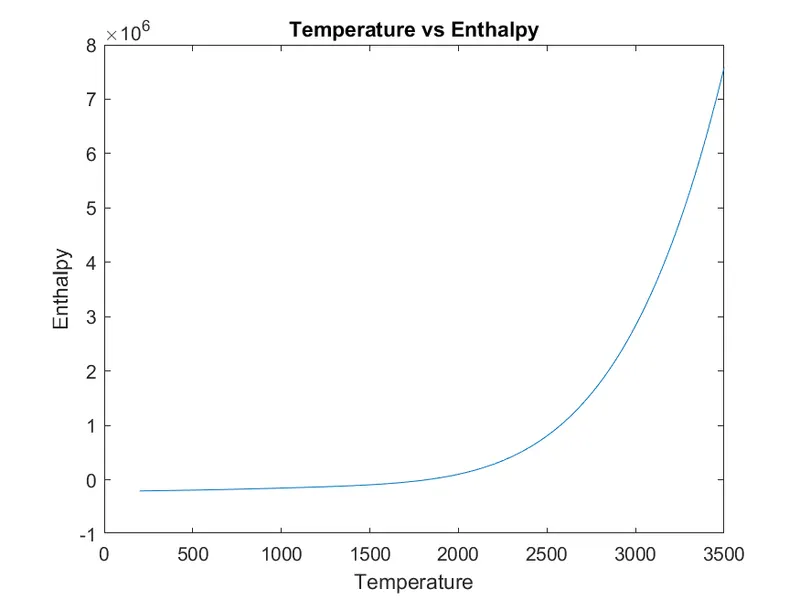
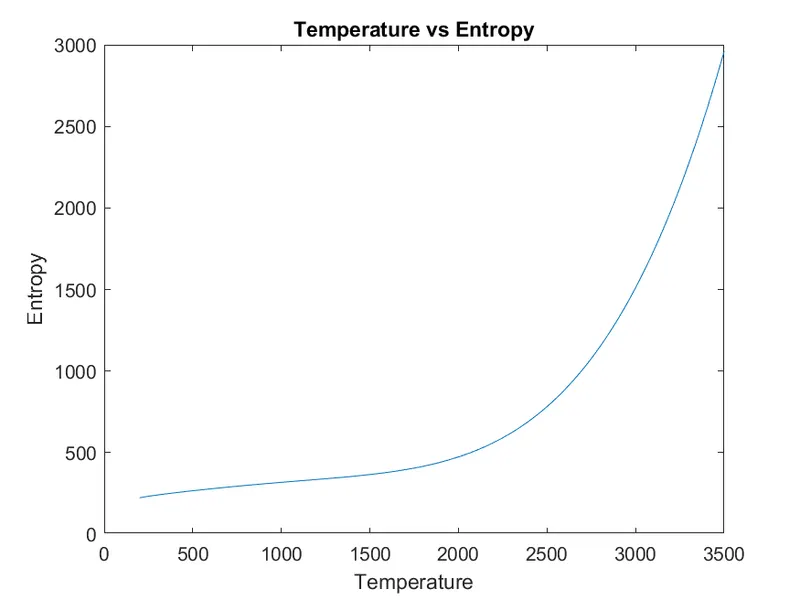
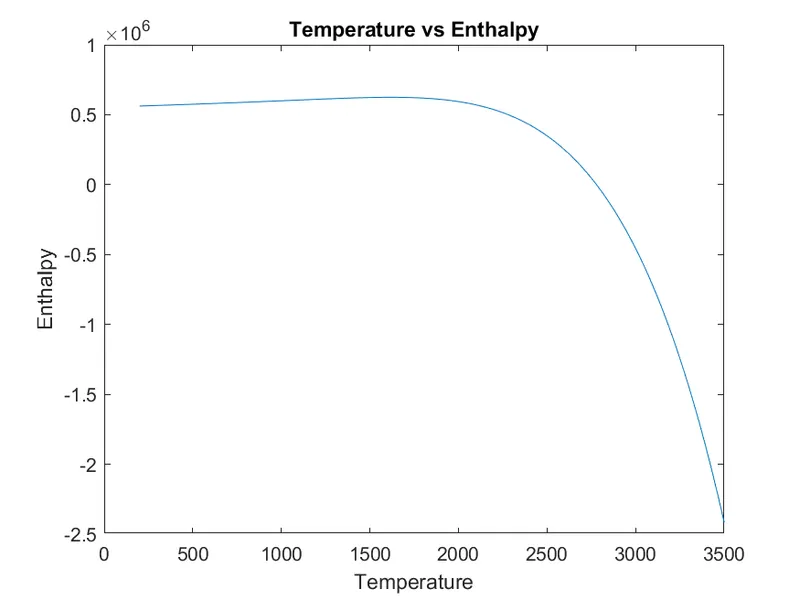
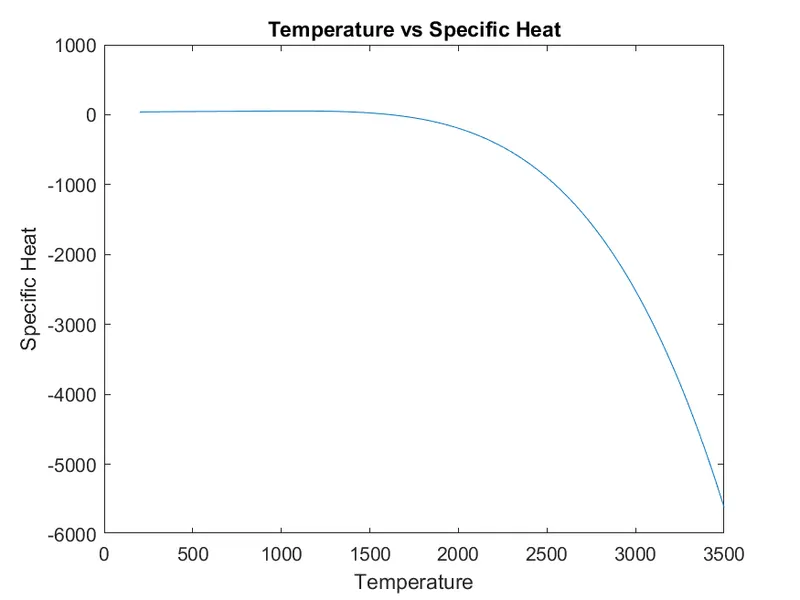
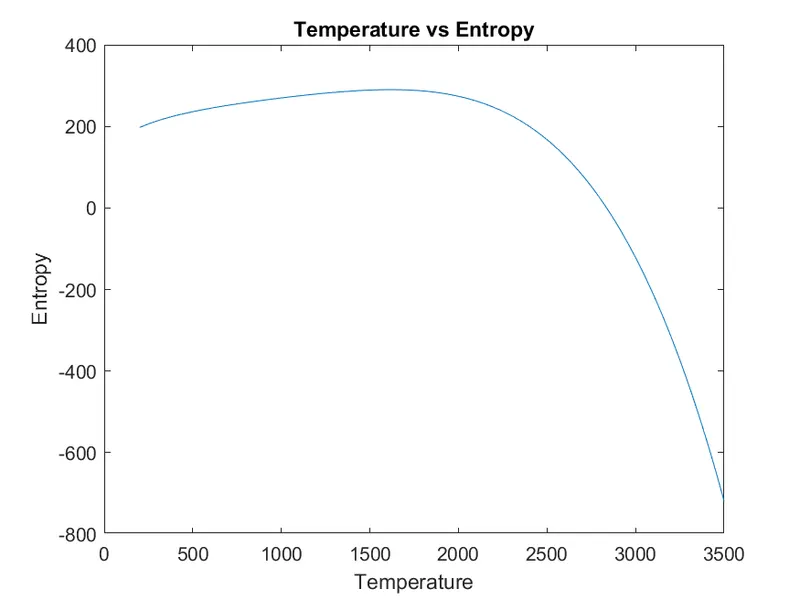
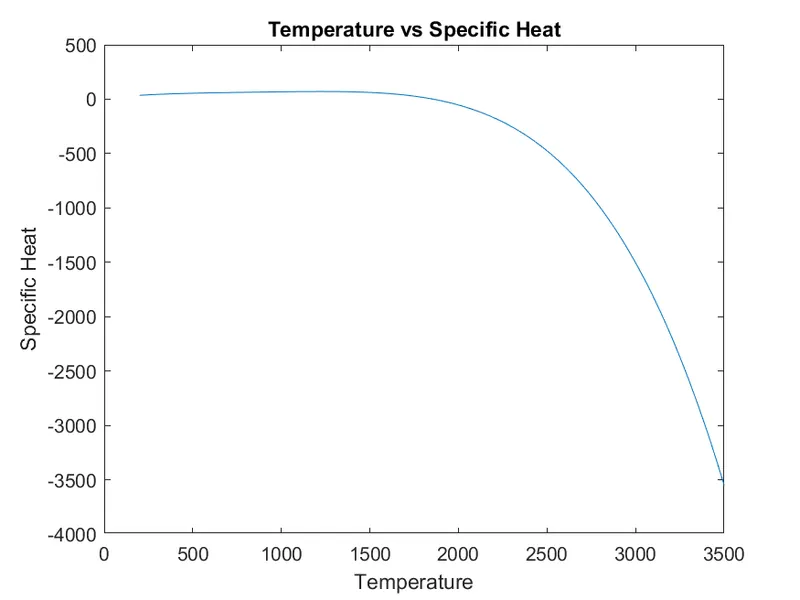
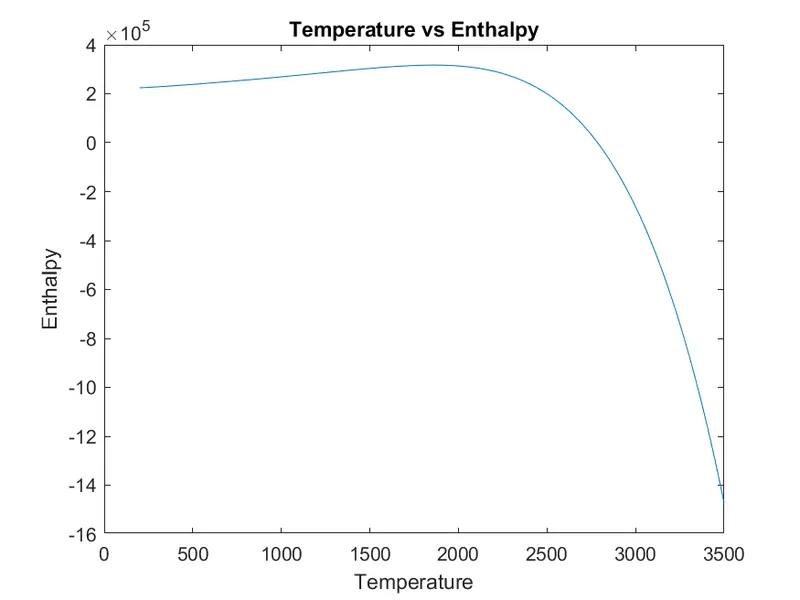
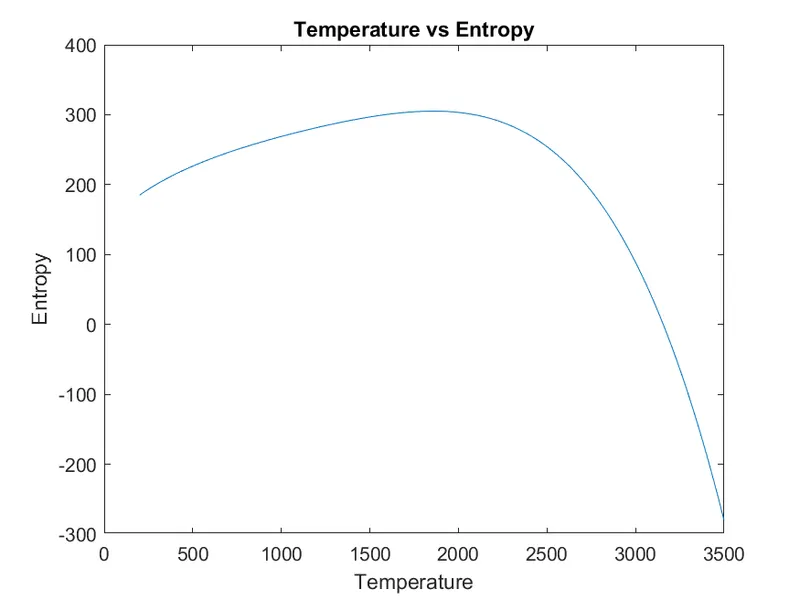
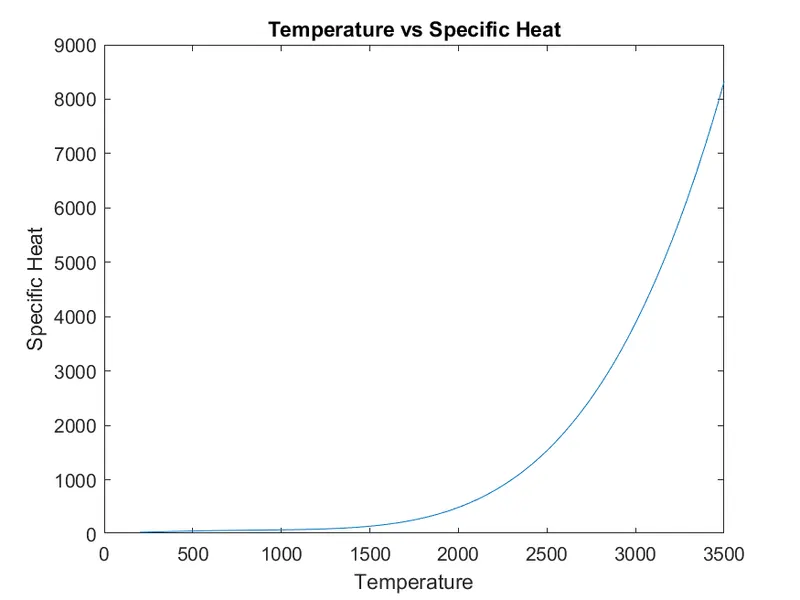
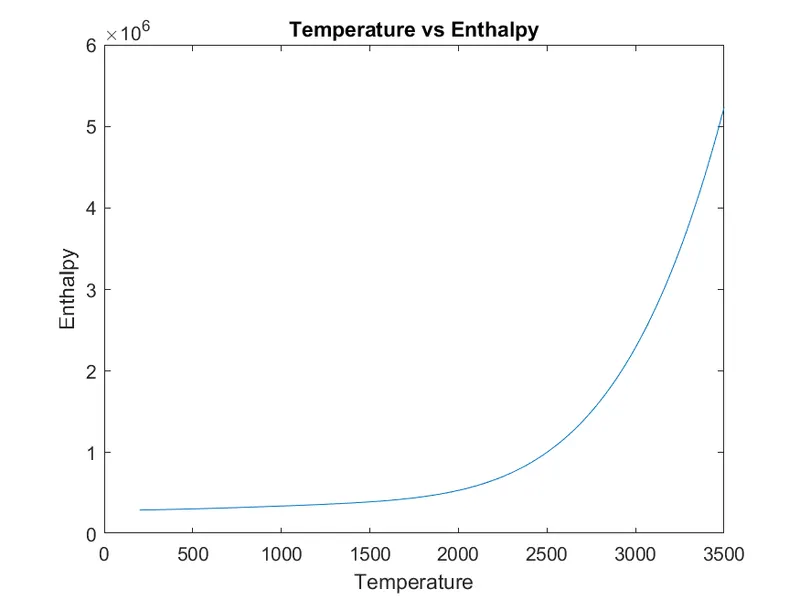
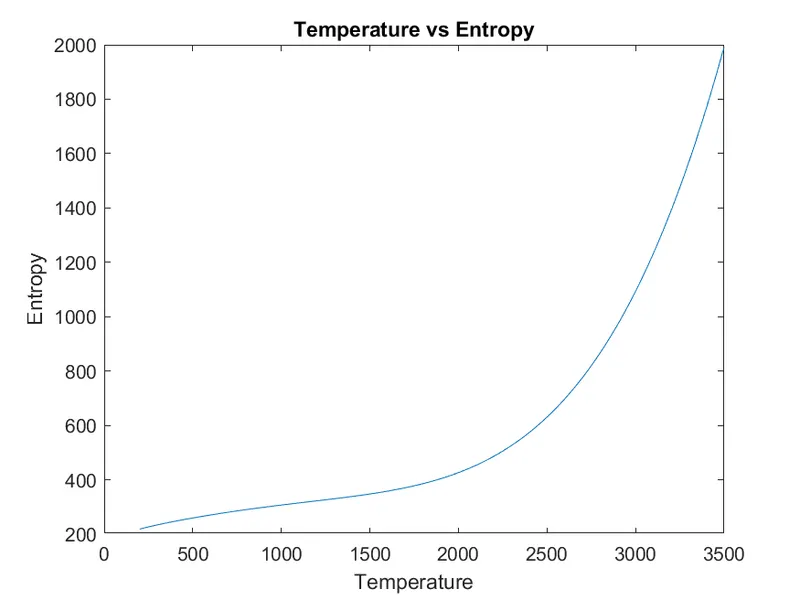
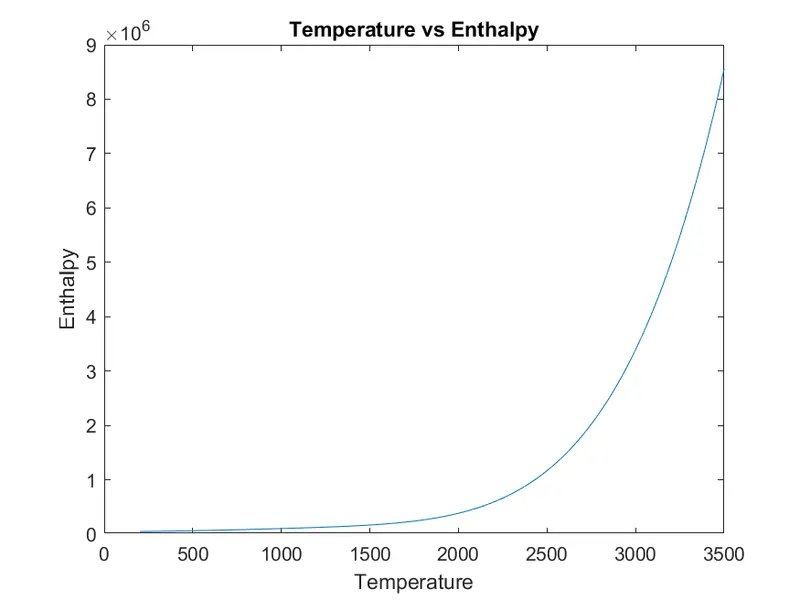
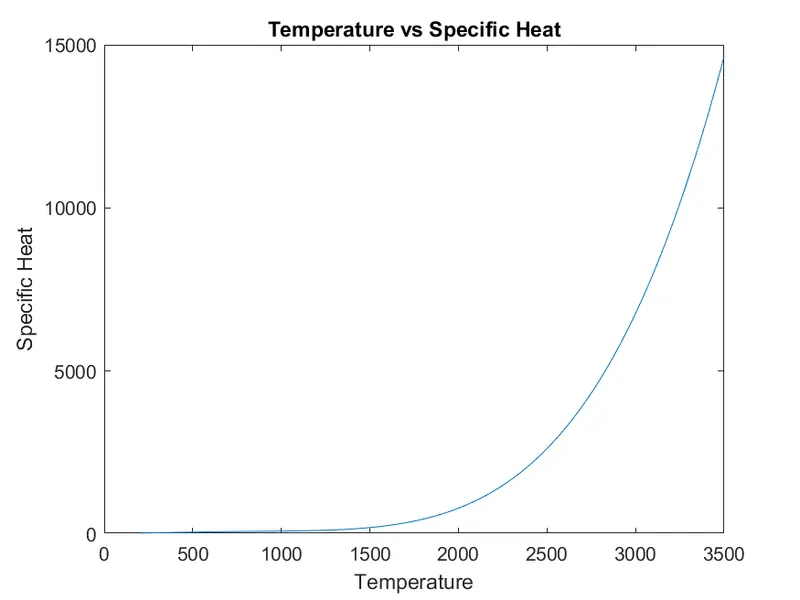
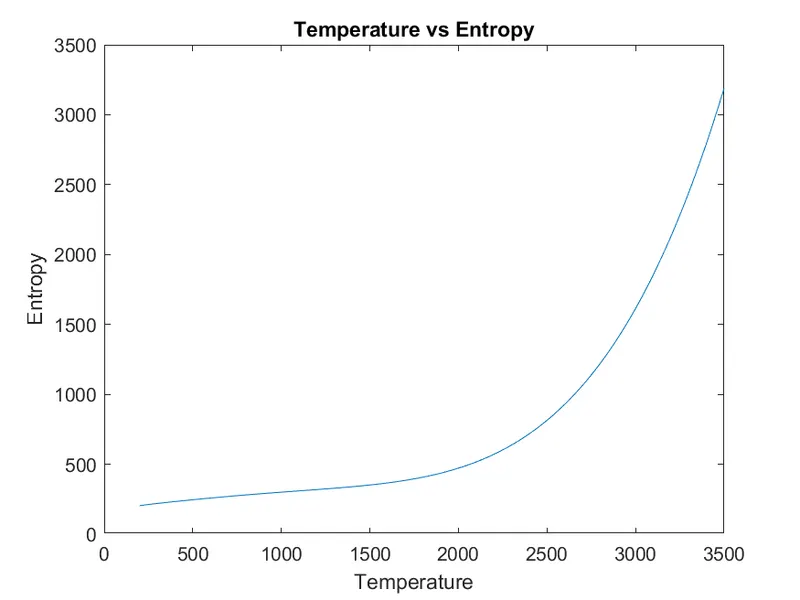
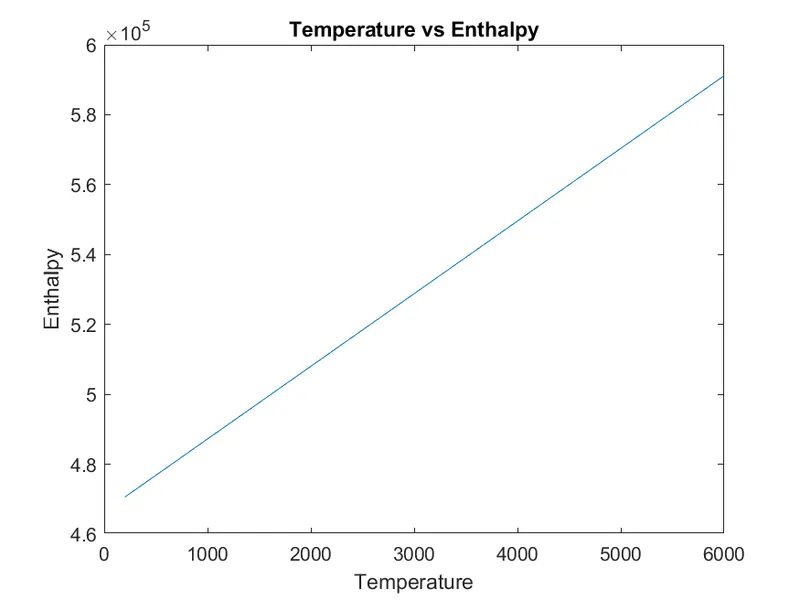
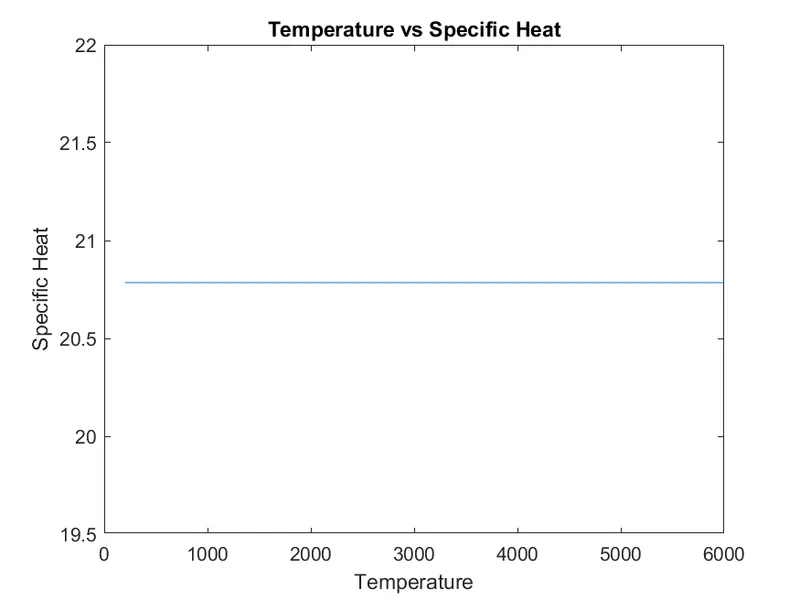
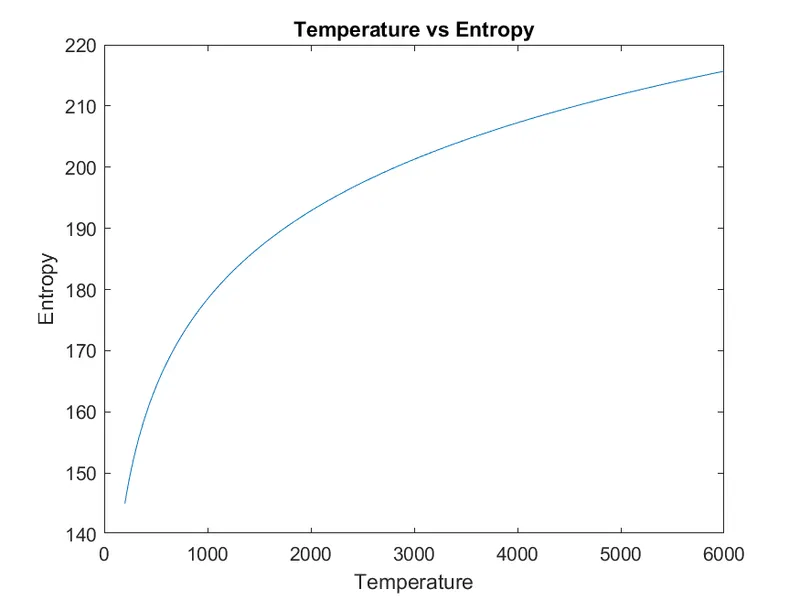
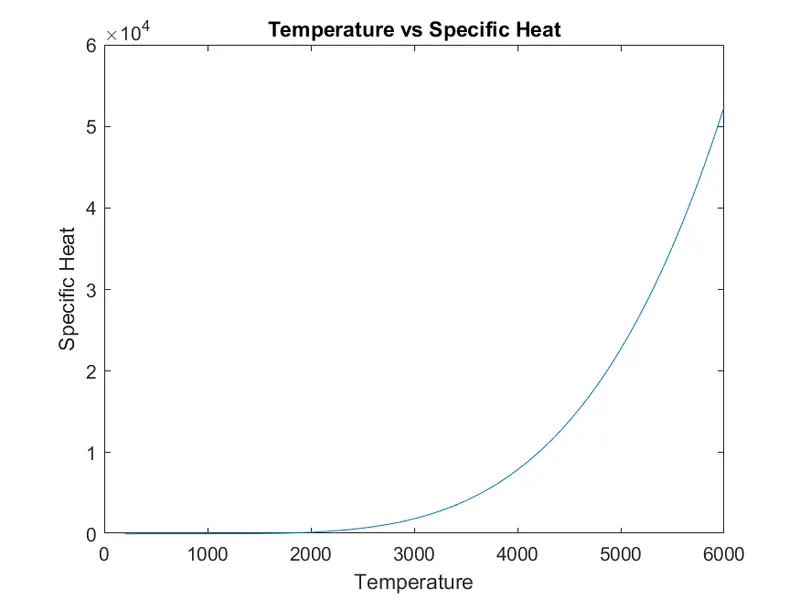
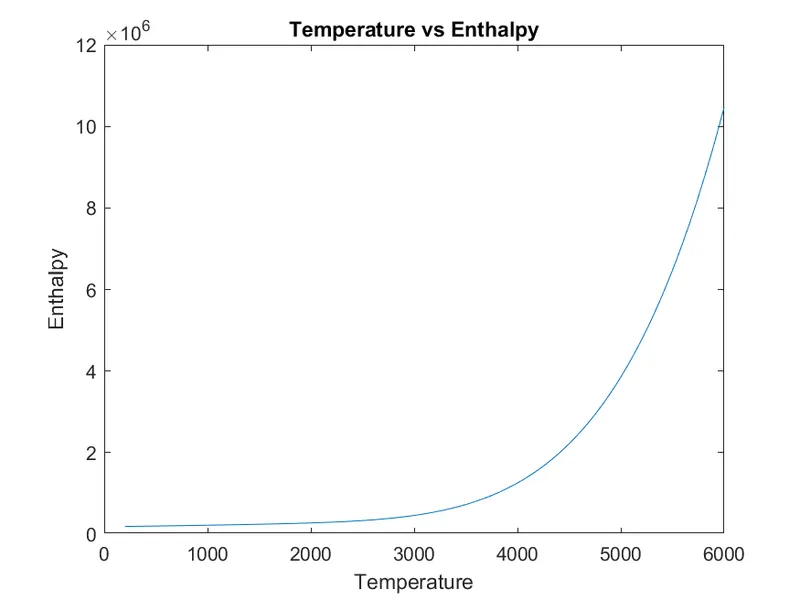
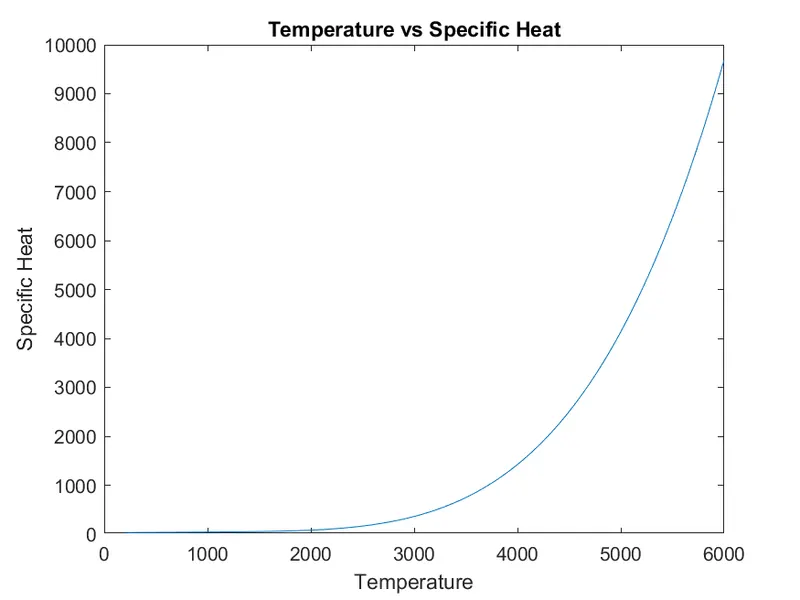
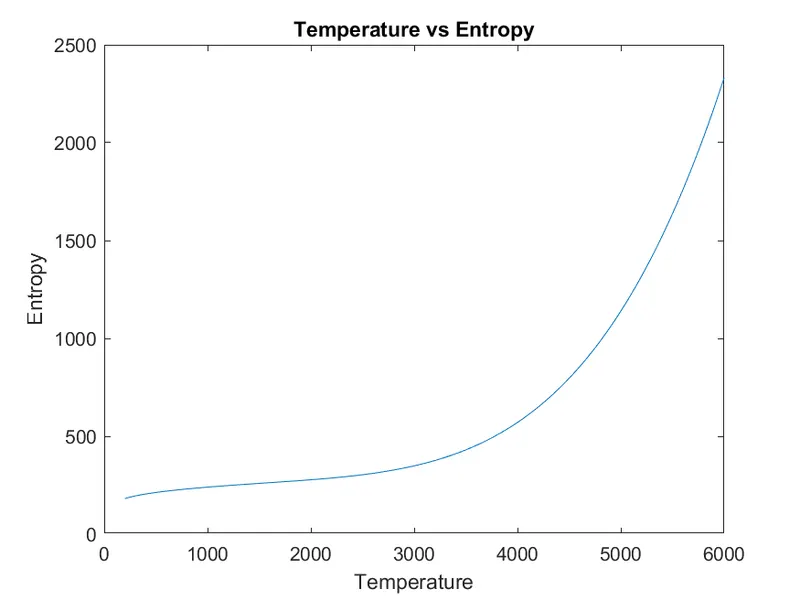
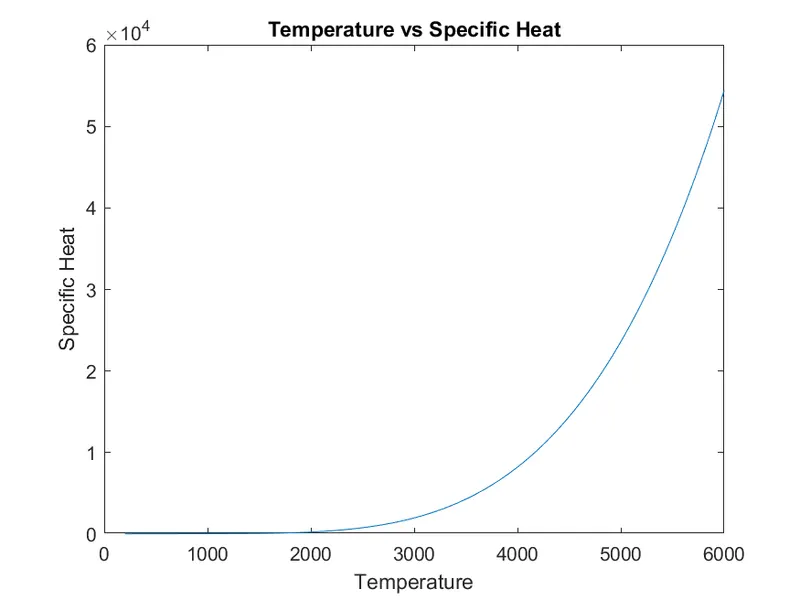
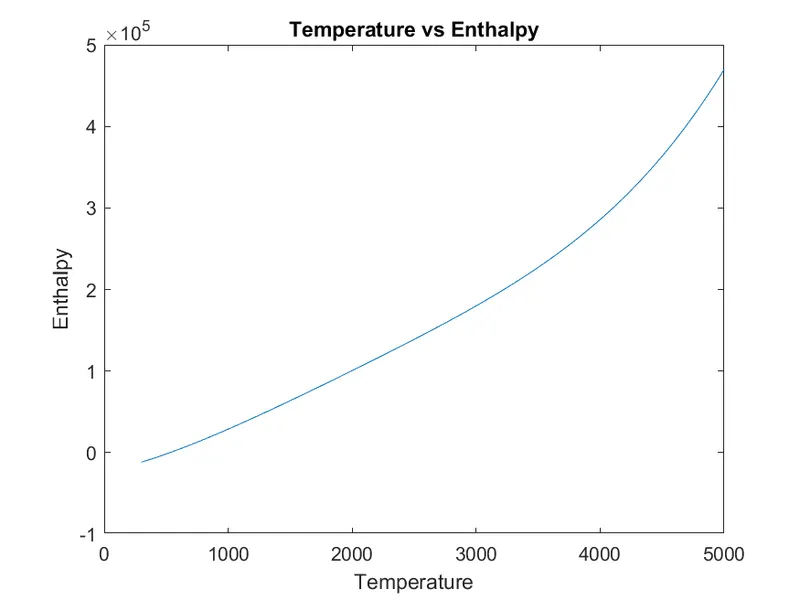
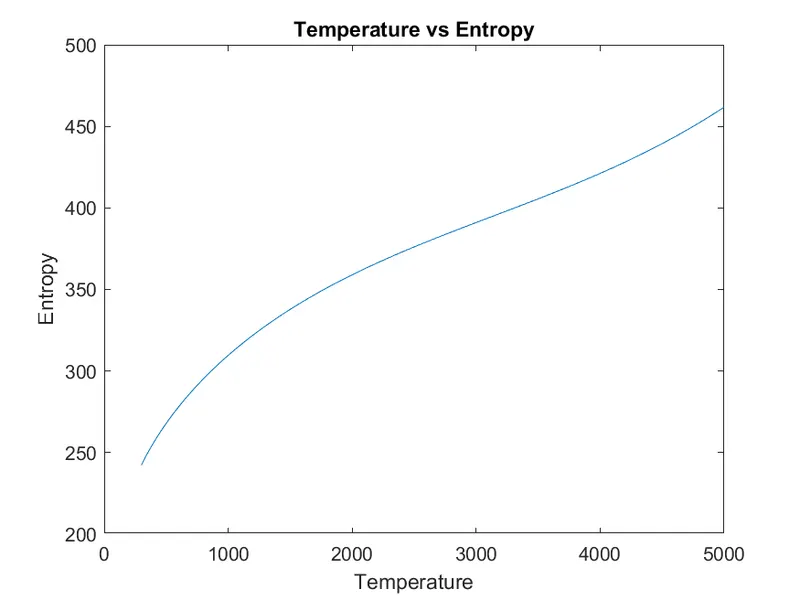
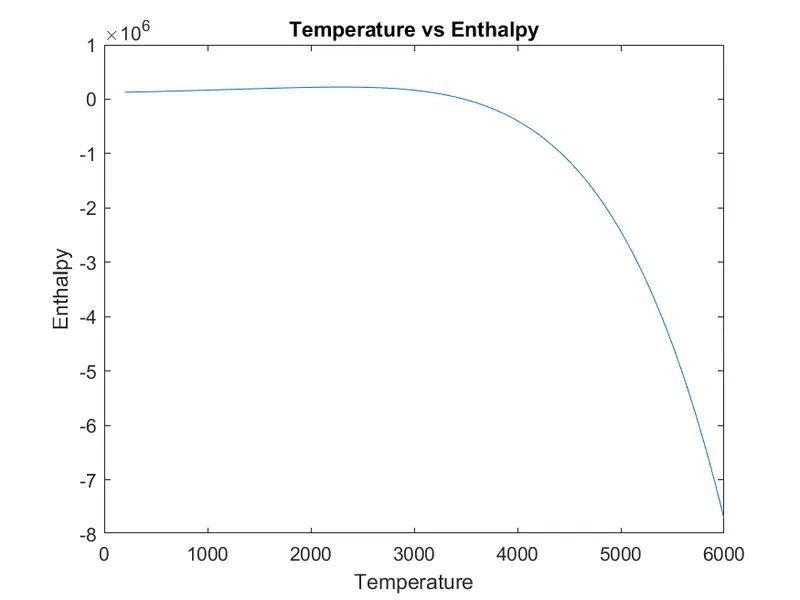
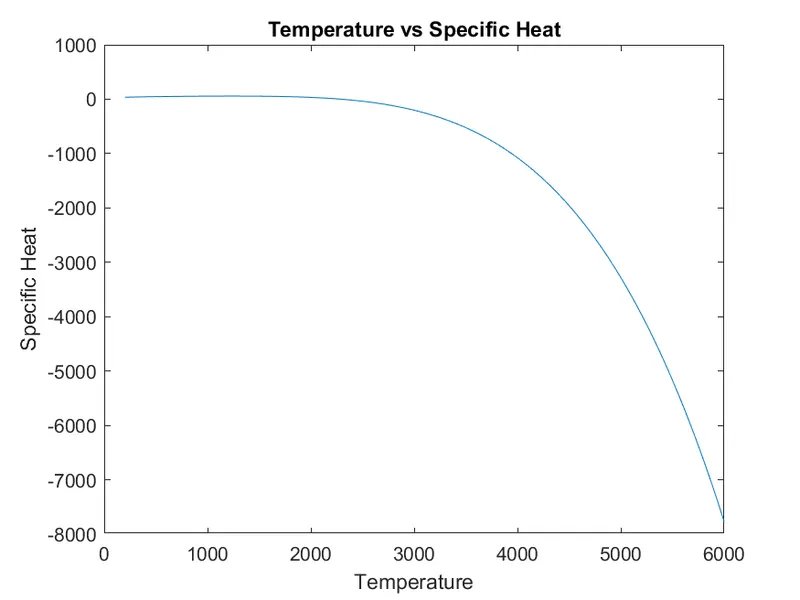
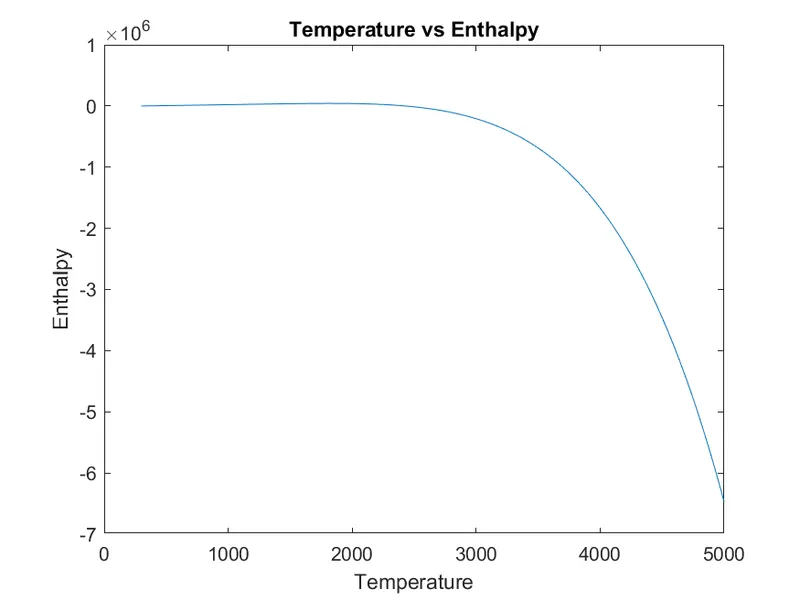
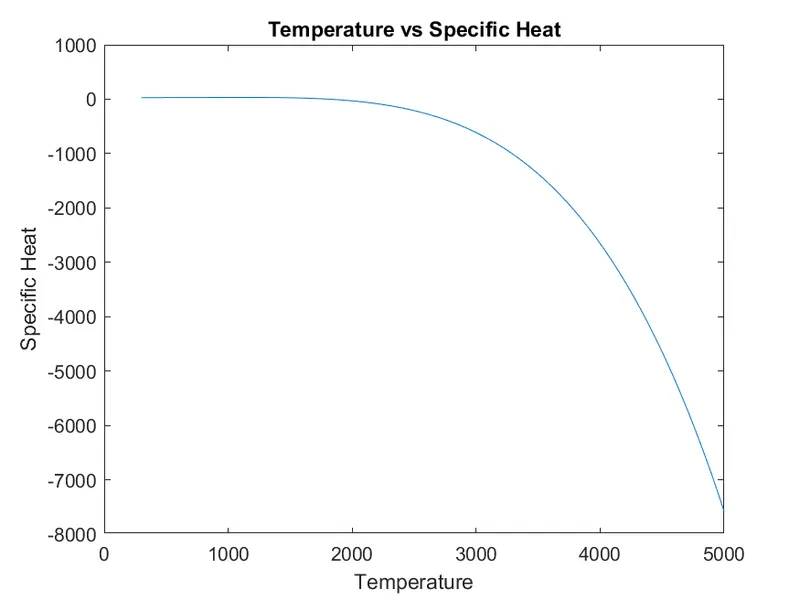
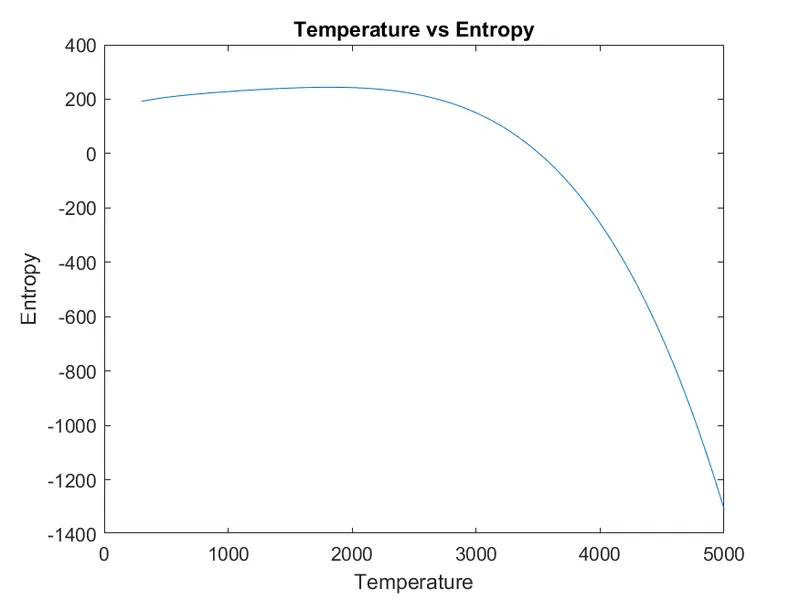
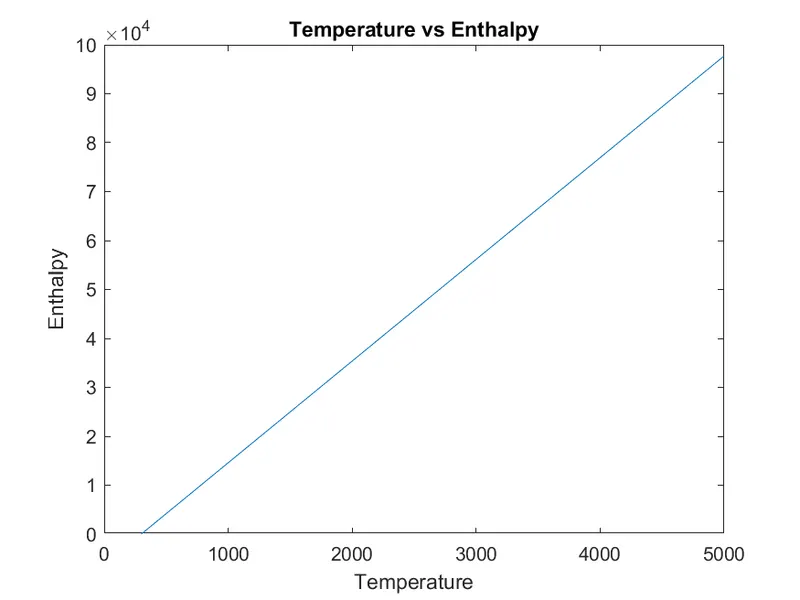
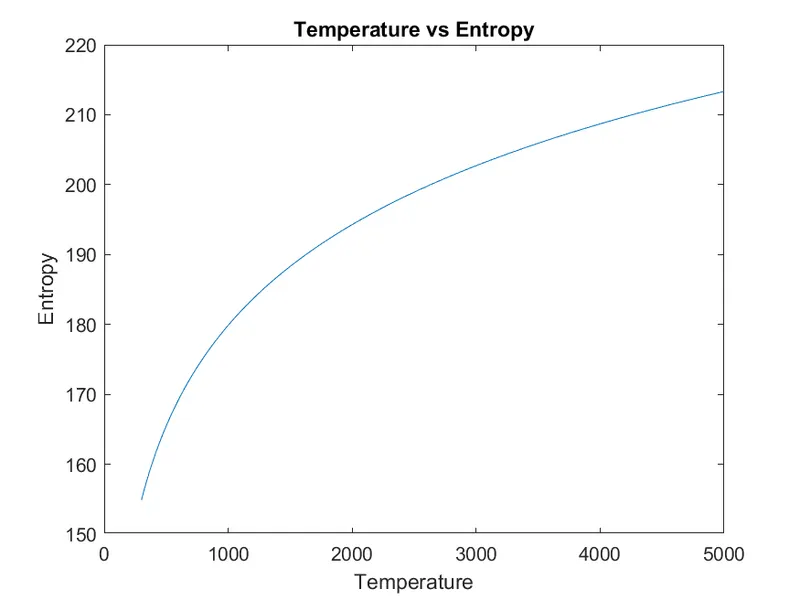
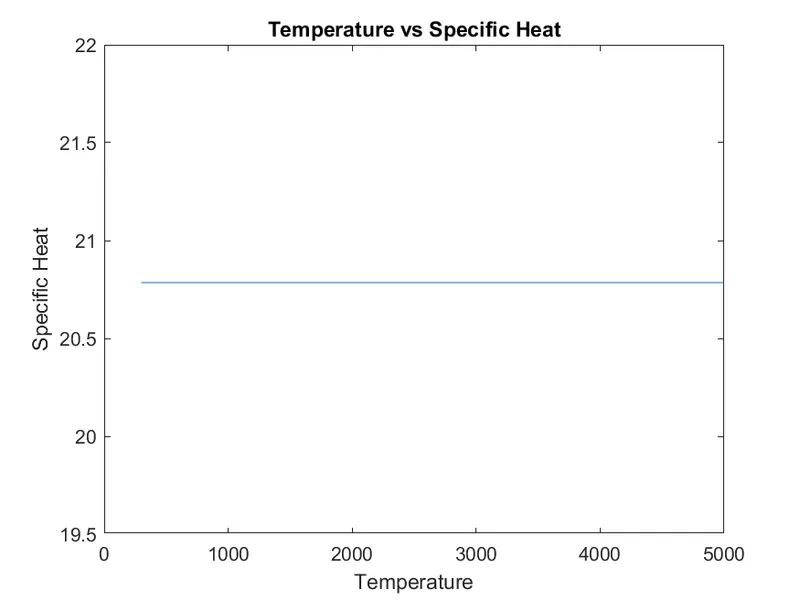
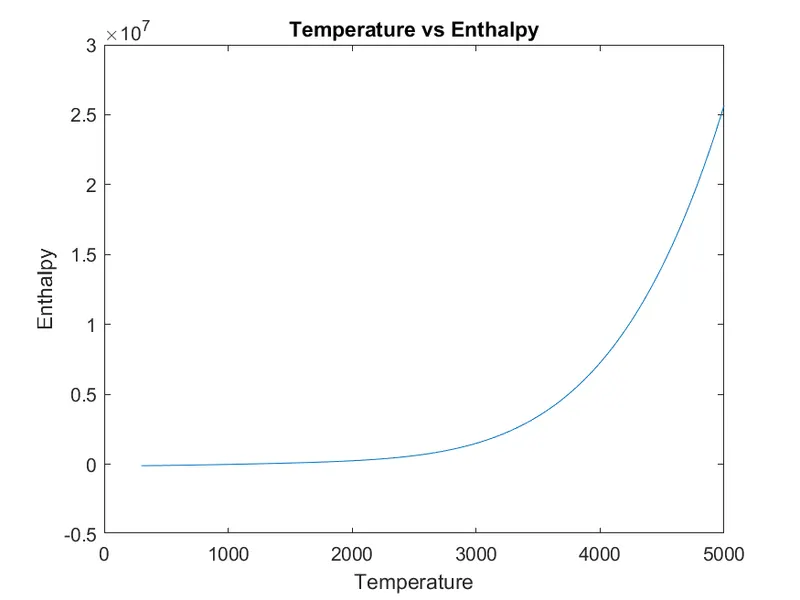
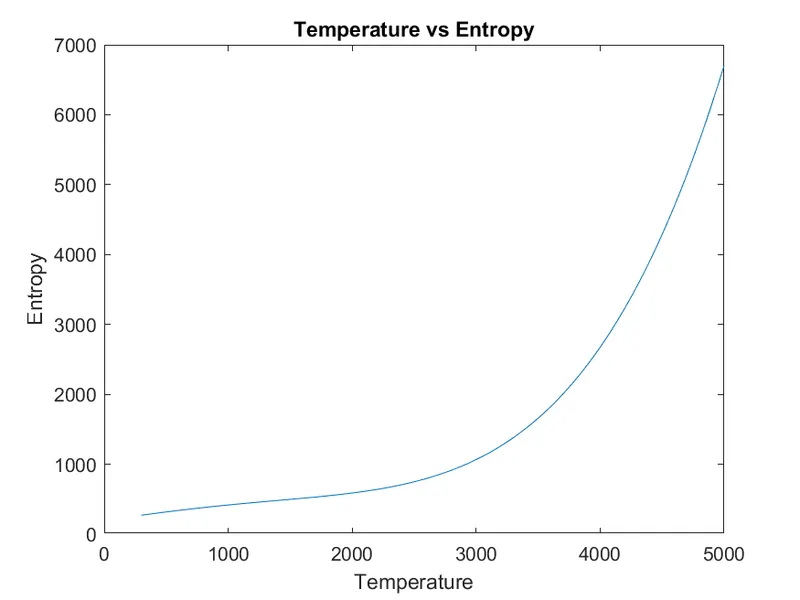
CODE EXPLAINATION:-
FUNCTION CODE EXPLAINATION-
- First step is to assign the value for each element using an array.
- Then using 'strcmp' command the species name and array elements are compared. Then the atomic weight is added according to the compared string element value.
- To find the repetiton of elements of the same species, the numerical value(n) is extracted using the str2 num and then the atomic weight of the previous element is added to 'n-1' times.
MAIN CODE EXPLAINATION-
Before writing the code, it's important to start with clear all, close all and clc commands since
Clear all - removes data from the workspace, freeing up system memory
Close all- deletes the current figure or the specified figure
clc - clears all input and output from the Command Window display, giving you a "clean screen
- The first step is to open the data file using the fopen command and the 'r' denotes reading the file.
- Using fgetl command the first line data is taken and stored in a variable line_1.
- Again using the fgetl command results in reading the next consecutive line in the data file. Thus using this command 5 times we can extarct the first five line by the use of the FOR loop.
- There are totally 53 species as explained below,
- total lines = 218.
- irrelevant lines = 6 (first 5 lines as explained above and the last line which has 'END').
- total relevant species lines = 218-6 = 212.
- each species has 4 lines of data.
- so, number of species = 212/4 = 53 species.
- Using a 'for' loop with the 53 species, and with fgetl command each line of species is read and the coefficient values are stored from c1 to c14.
- The coeff values can be found using the 'E' as an indicator and with strfind command.
- Using a nested 'for' loop the Cp, H and S values are calculated as explained above.
- Now the extracted data is saved in a directory with the species name using the 'mkdir' command.
- The graphs for each species are plotted and the images are saved in the directory using the saveas command.
- To calculate the molecular weight a separate function is used with name 'molecular_weight'.
- The value of universal gas constant is taken as 8.314 J/mol-K.