Project 1 - Parsing NASA thermodynamic data
PARSING NASA THERMODYNAMIC DATA
AIM:-
- Write a function that extracts the 14 coefficients and calculates the enthalpy, entropy and specific heats for all the species in the data file.
- Calculate the molecular weight of each species and display it in the command window.
- Plot the Cp, Enthalpy and Entropy for the local temperature range (low temperature : high temperature) specific for each species.
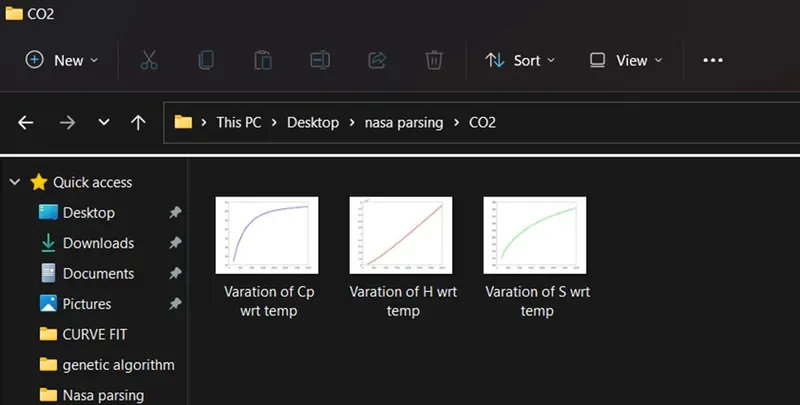
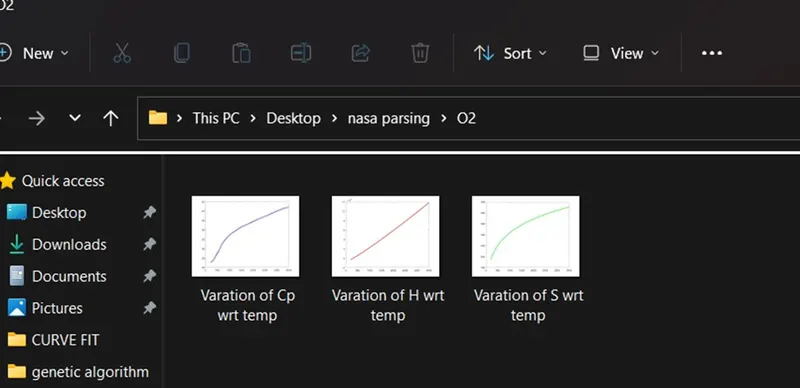
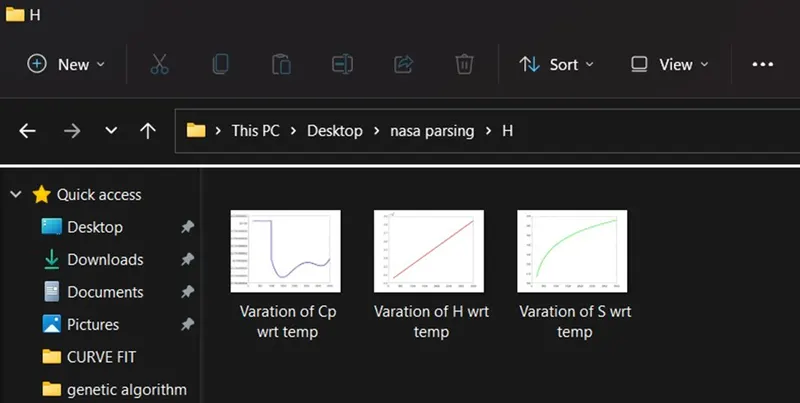
- Save the plots as images with appropriate names and dump them in separate folders for each species with suitable name. All these should be generated automatically.
- The main program that you will submit will just take the “THERMO.dat” file as an input and generate Cp, H and S plots.
- Please write a detailed report to describe your logic.
EXPLANATION OF THEORY:-
The official record of thermodynamic values at different temperatures has been stored by NASA in the form of polynomials with specified ranging from one to fourteen (1-14) for various species. In order to quantify the values, the polynomials can be solved with defined temperature values in accordance with our requirements.
The term’parsing’ refers to MATLAB reading an m-file (script or function ) and translating it into an internal code that it stores in memory. It is this ‘parsed’ file in memory that is actually run when you execute the code.
Governing equations :-

Where,
Cp = Specific Heat
H = Enthalpy
S = Entropy
R = Universal Gas Constant (8.314 J/mol.k)
T = Temperature
- The first 7 coefficient are high temperature coefficient and the second 7 coefficient are low temperature coefficient.
CODE SCREEN SHOT:-
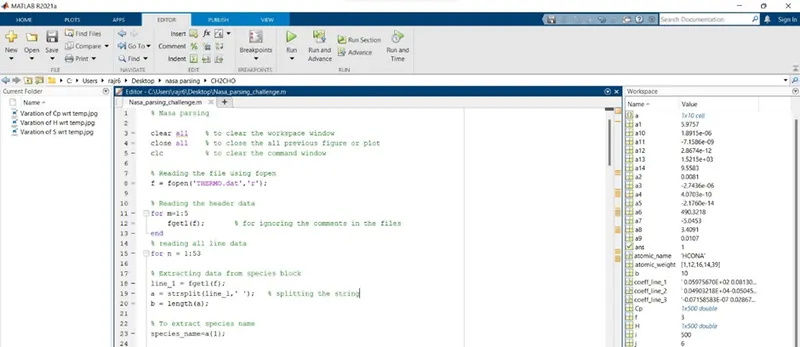
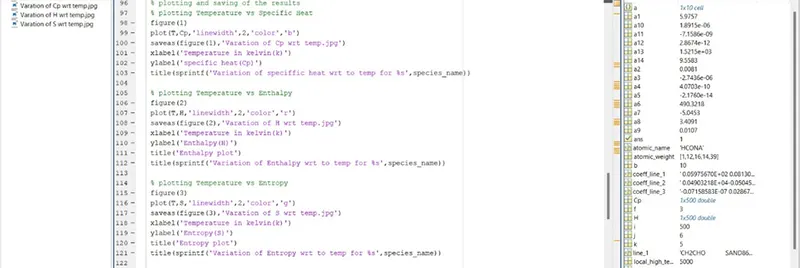
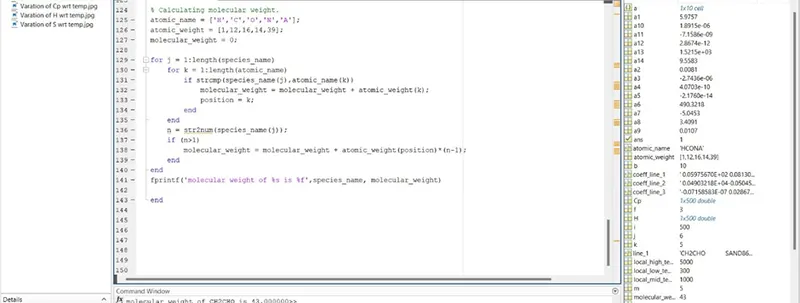
Explanation of coding is given below:-
% Parsing NASA Thermodynamic data.
clear all % to clear the workspace window
close all % to close the all previous figure or plot
clc % to clear the command window
% Reading the file using fopen
f = fopen('THERMO.dat','r');
% Reading the header data
for m=1:5
fgetl(f); % for ignoring the comments in the files
end
% reading all line data
for n = 1:53
% Extracting data from species block
line_1 = fgetl(f);
a = strsplit(line_1,' '); % splitting the string
b = length(a);
% To extract species name
species_name=a{1};
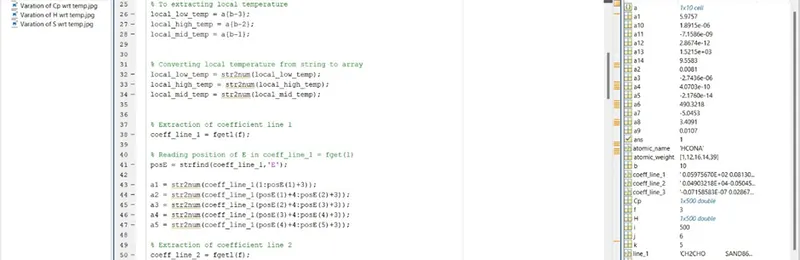
% To extracting local temperature
local_low_temp = a{b-3};
local_high_temp = a{b-2};
local_mid_temp = a{b-1};
% Converting local temperature from string to array
local_low_temp = str2num(local_low_temp);
local_high_temp = str2num(local_high_temp);
local_mid_temp = str2num(local_mid_temp);
% Extraction of coefficient line 1
coeff_line_1 = fgetl(f);
% Reading position of E in coeff_line_1 = fget(l)
posE = strfind(coeff_line_1,'E');
a1 = str2num(coeff_line_1(1:posE(1)+3));
a2 = str2num(coeff_line_1(posE(1)+4:posE(2)+3));
a3 = str2num(coeff_line_1(posE(2)+4:posE(3)+3));
a4 = str2num(coeff_line_1(posE(3)+4:posE(4)+3));
a5 = str2num(coeff_line_1(posE(4)+4:posE(5)+3));
% Extraction of coefficient line 2
coeff_line_2 = fgetl(f);
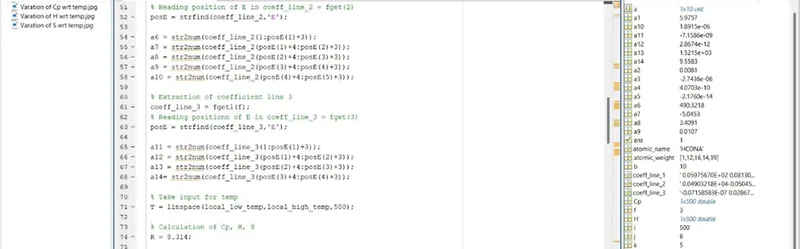
% Reading position of E in coeff_line_2 = fget(2)
posE = strfind(coeff_line_2,'E');
a6 = str2num(coeff_line_2(1:posE(1)+3));
a7 = str2num(coeff_line_2(posE(1)+4:posE(2)+3));
a8 = str2num(coeff_line_2(posE(2)+4:posE(3)+3));
a9 = str2num(coeff_line_2(posE(3)+4:posE(4)+3));
a10 = str2num(coeff_line_2(posE(4)+4:posE(5)+3));
% Extraction of coefficient line 3
coeff_line_3 = fgetl(f);
% Reading positionn of E in coeff_line_3 = fget(3)
posE = strfind(coeff_line_3,'E');
a11 = str2num(coeff_line_3(1:posE(1)+3));
a12 = str2num(coeff_line_3(posE(1)+4:posE(2)+3));
a13 = str2num(coeff_line_3(posE(2)+4:posE(3)+3));
a14= str2num(coeff_line_3(posE(3)+4:posE(4)+3));
% Take input for temp
T = linspace(local_low_temp,local_high_temp,500);
% Calculation of Cp, H, S
R = 8.314;
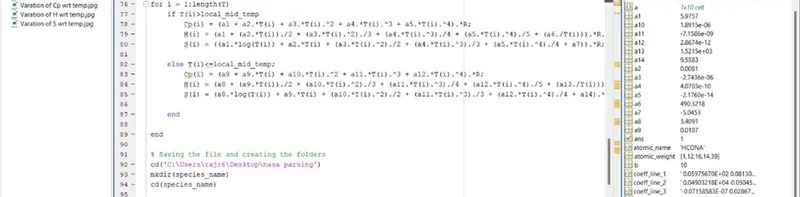
for i = 1:length(T)
if T(i)>local_mid_temp
Cp(i) = (a1 + a2.*T(i) + a3.*T(i).^2 + a4.*T(i).^3 + a5.*T(i).^4).*R;
H(i) = (a1 + (a2.*T(i))./2 + (a3.*T(i).^2)./3 + (a4.*T(i).^3)./4 + (a5.*T(i).^4)./5 + (a6./T(i))).*R.*T(i);
S(i) = ((a1.*log(T(i)) + a2.*T(i) + (a3.*T(i).^2)./2 + (a4.*T(i).^3)./3 + (a5.*T(i).^4)./4 + a7)).*R;
else T(i)<=local_mid_temp;
Cp(i) = (a8 + a9.*T(i) + a10.*T(i).^2 + a11.*T(i).^3 + a12.*T(i).^4).*R;
H(i) = (a8 + (a9.*T(i))./2 + (a10.*T(i).^2)./3 + (a11.*T(i).^3)./4 + (a12.*T(i).^4)./5 + (a13./T(i))).*R.*T(i);
S(i) = (a8.*log(T(i)) + a9.*T(i) + (a10.*T(i).^2)./2 + (a11.*T(i).^3)./3 + (a12.*T(i).^4)./4 + a14).*R;
end
end
% Saving the file and creating the folders
cd('C:\Users\rajr6\Desktop\nasa parsing')
mkdir(species_name)
cd(species_name)
% plotting and saving of the results
% plotting Temperature vs Specific Heat
figure(1)
plot(T,Cp,'linewidth',2,'color','b')
saveas(figure(1),'Varation of Cp wrt temp.jpg')
xlabel('Temperature in kelvin(k)')
ylabel('specific heat(Cp)')
title(sprintf('Variation of speciffic heat wrt to temp for %s',species_name))
% plotting Temperature vs Enthalpy
figure(2)
plot(T,H,'linewidth',2,'color','r')
saveas(figure(2),'Varation of H wrt temp.jpg')
xlabel('Temperature in kelvin(k)')
ylabel('Enthalpy(H)')
title('Enthalpy plot')
title(sprintf('Variation of Enthalpy wrt to temp for %s',species_name))
% plotting Temperature vs Entropy
figure(3)
plot(T,S,'linewidth',2,'color','g')
saveas(figure(3),'Varation of S wrt temp.jpg')
xlabel('Temperature in kelvin(k)')
ylabel('Entropy(S)')
title('Entropy plot')
title(sprintf('Variation of Entropy wrt to temp for %s',species_name))
% Calculating molecular weight.
atomic_name = ['H','C','O','N','A'];
atomic_weight = [1,12,16,14,39];
molecular_weight = 0;
for j = 1:length(species_name)
for k = 1:length(atomic_name)
if strcmp(species_name(j),atomic_name(k))
molecular_weight = molecular_weight + atomic_weight(k);
position = k;
end
end
n = str2num(species_name(j));
if (n>1)
molecular_weight = molecular_weight + atomic_weight(position)*(n-1);
end
end
fprintf('molecular weight of %s is %f',species_name, molecular_weight)
end
EXPLANATION OF CODE LINE BY LINE:-
- First start with clear all, close all, clc command to clear the workspace window, to close the all previous figure or plot , and to clear the command window.
- Opening and reading the given data from the folder using fopen command.
- Fgetl command is used to read the file and skip the next 5 line in the data file.
- Aftr that a loop is created for 1:53, as we are having 53 species in the data.
- Extracting data from species block
- Strsplit command is used to get the string splited.
- And assuming b as a length.
- Then extract the species name.
- After that extract the local temperature for low temperature, high temperature and mid temperature.
- Then converting the local temperature from srtring to array using str2num command. ( for low temp, hight temp, and mid temp).
- All the species names and temperature ranges are available in the header line.
- The coefficient values are obtained by using str2num command.
- Strfind E is used to find the exponents E lies in all given data lines.
- The process is repeated for all 14 coefficients.
- After that linspace command is used to obtain an array of local_high_mid temperature to the local maximum temperature.
- The corresponding equations to find Cp, S and H is put inside a loop along with if else statement according to the temperature grater or less than local temperature.
- The high temperature and low temperature coefficient are obtained, thus Cp, S and H can be found easily.
- After that save the file and create the folders cd command used for create a folder in the path where we have saved the code and thermo data.
- Using mkdir command is using for creating the folder.
- Again cd command is used for creating all folder for species into the folder.
- And thus the 3 plots for each 53 species are obtained and saved in the corresponding species folders.
- After that ploting and saving the graph and result respectively.
- Using figure (1) , figure (2) and figure (3) to create a separate graph for all plot.
- First plot temperature vs specific heat.
- Second plot temperature vs enthalpy.
- Third that plot temperature vs entropy.
- The corresponding x and y labels and title with specific species name after variation is given in each plot case.
- This all thing will take a part inside the previous loop and thus the curve will ploted for each 53 species and get all molecular weight result in command window.
PLOTS FOR ‘CH2CHO’ SPECIES.
GRAPH FOR ALL ( T vs Cp) , ( T vs H) , ( T vs S)
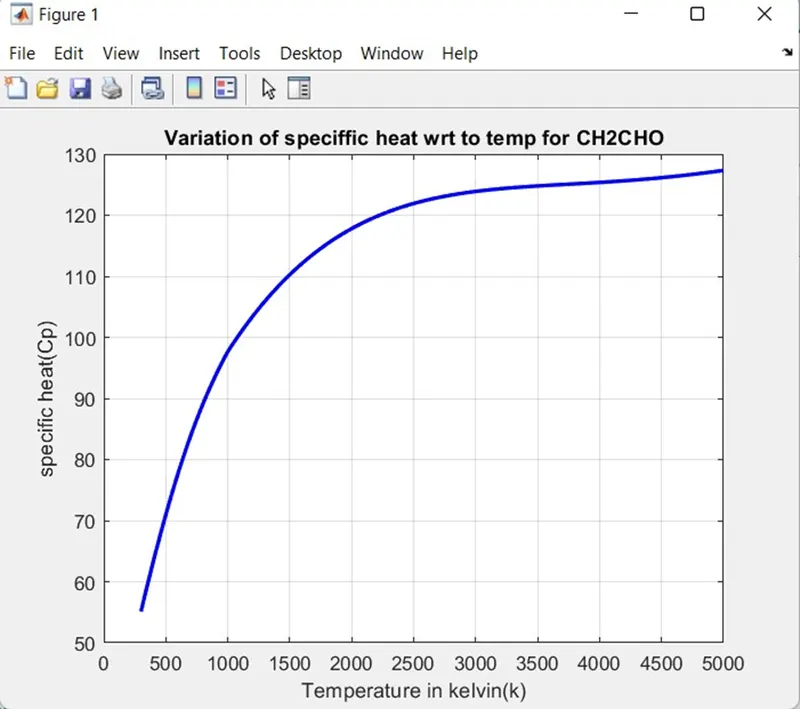
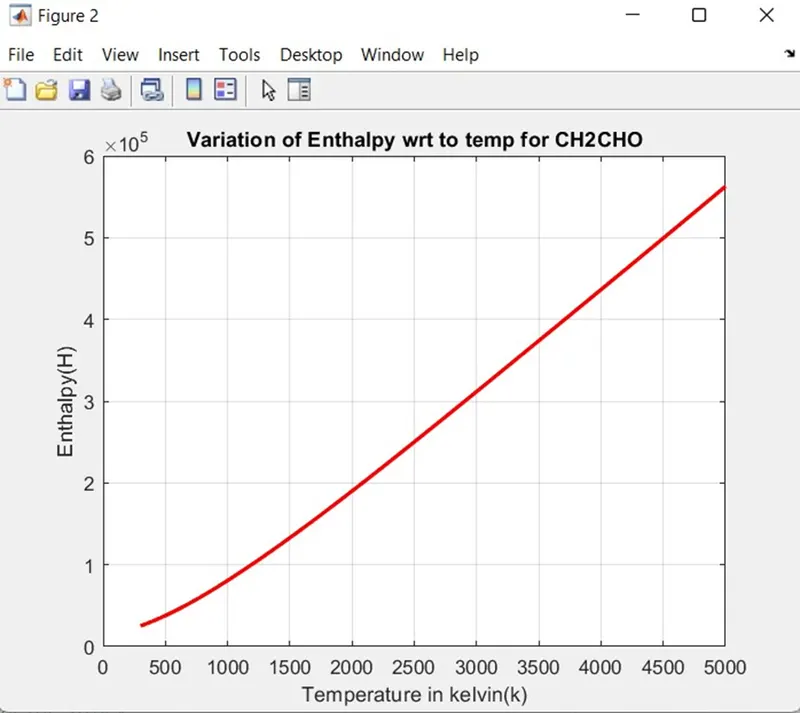
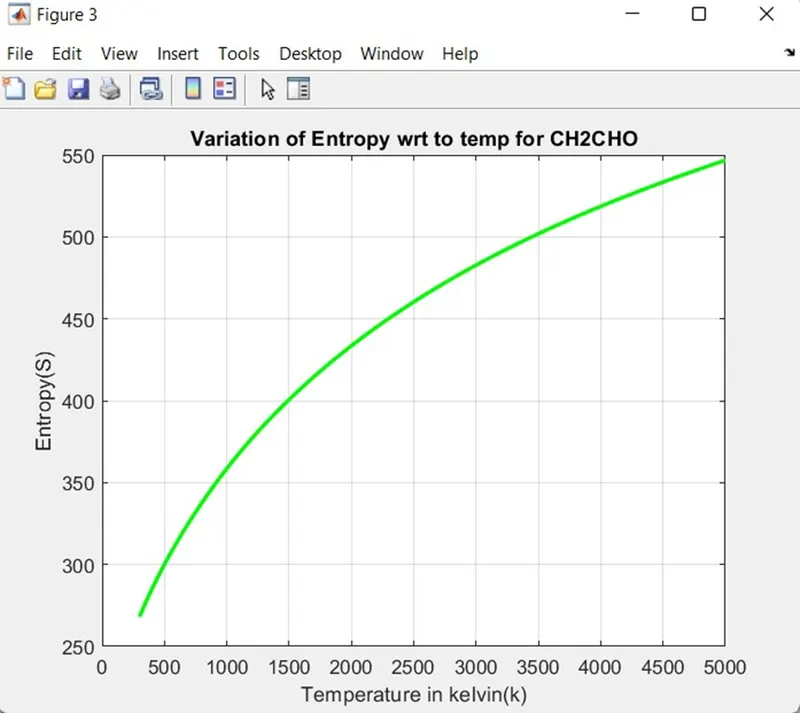
NOTE :- I put a graph of only one species CH2CHO and remaining graph of species saved in folder which I have given below…..

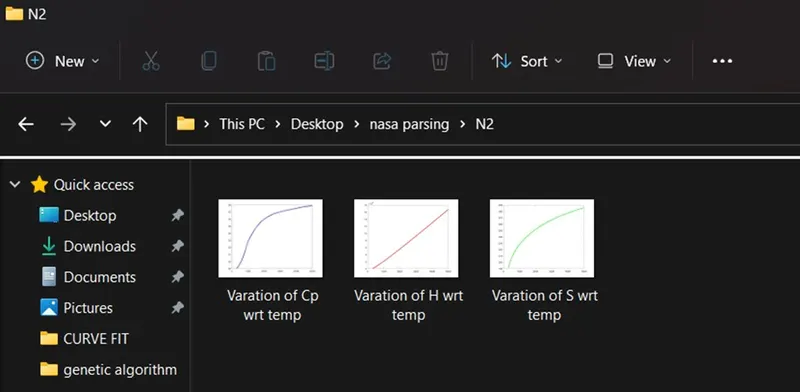
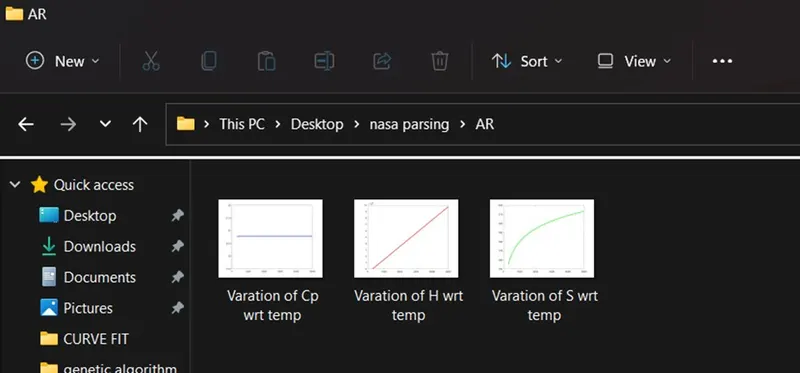
When you will open this folder one by one you will get the graph as example I have given below ( I have open CO2, O2, H, N2, AR ).
CALULATING MOLECULAR WEIGHT :-
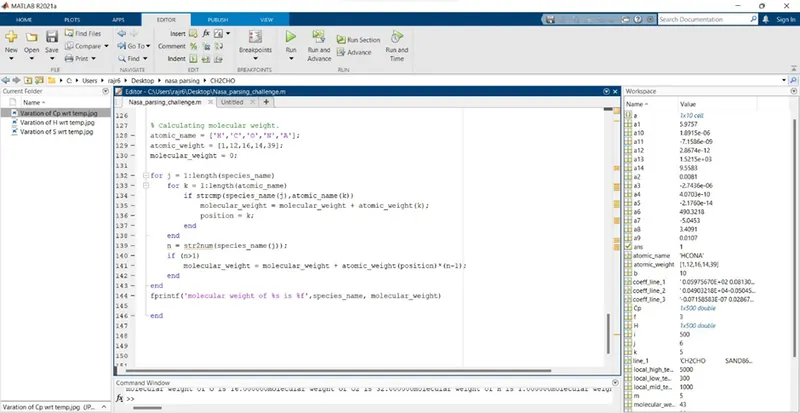
CODE AND EXPLANATION LINE BY LINE :-
% Calculating molecular weight.
atomic_name = ['H','C','O','N','A'];
atomic_weight = [1,12,16,14,39];
molecular_weight = 0;
for j = 1:length(species_name)
for k = 1:length(atomic_name)
if strcmp(species_name(j),atomic_name(k))
molecular_weight = molecular_weight + atomic_weight(k);
position = k;
end
end
n = str2num(species_name(j));
if (n>1)
molecular_weight = molecular_weight + atomic_weight(position)*(n-1);
end
end
fprintf('molecular weight of %s is %f',species_name, molecular_weight)
EXPLANATION :-
- To find the molecular mass for each and every element atomic weight is assigned now by using the ‘strcmp’ command each species elements are compared and molecular mass is stored using two for loop.
- One for loop to iterate the species elements.
- And second for loop to compare the elements.
- In some species name like CO2 the element atomic weight to be added twice or thrice like oxygen count here for two times. Hence the flag operator operator is used to get the position and that element atomic weight is added to the molecular weight by using the if condition.
- And will take all this code inside the first for loop and after using fprintf command to display the molecular weight result in command window.
- After that close the all open for loop and run the code, we will get plot and molecular weight for all species.
RESULT OF MOLECULAR WEIGH IN COMMAND WINDOW GIVEN BELOW :-
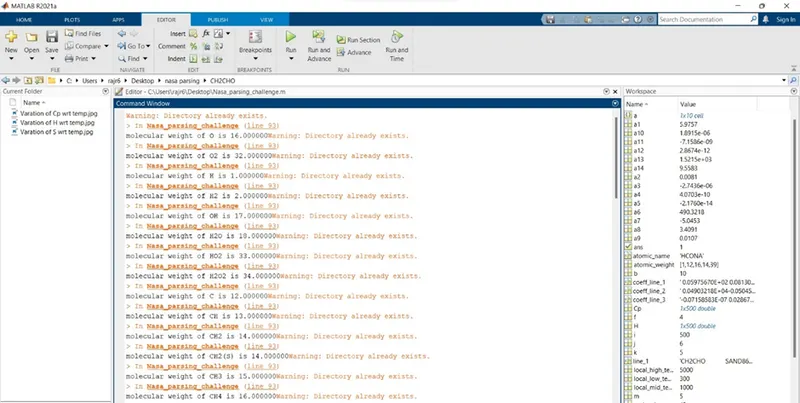
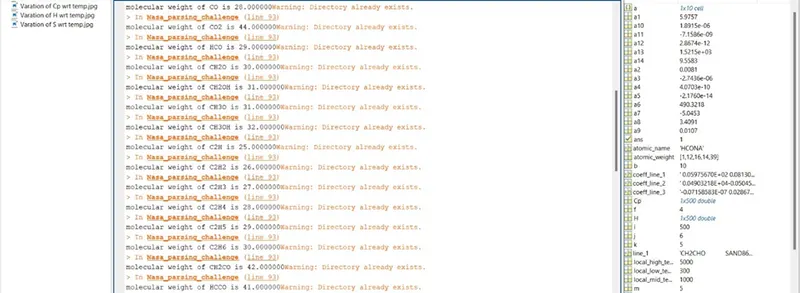
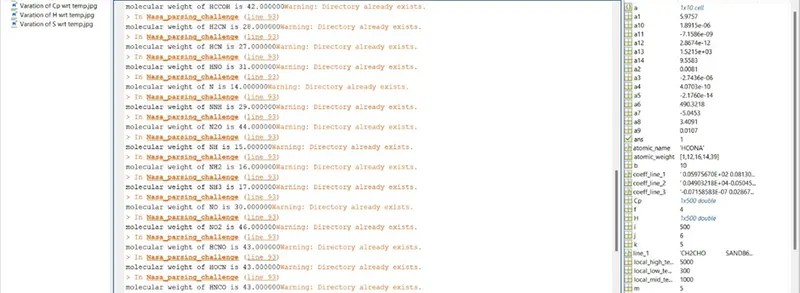
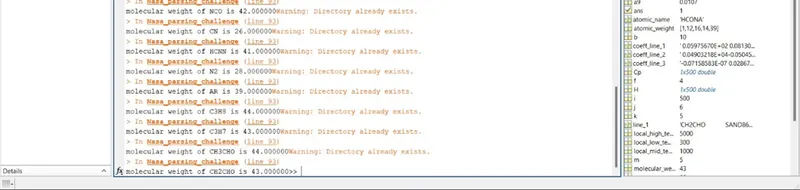
Note :- I got that warning because it had stored already and if I run the code again and again we will get same warning.
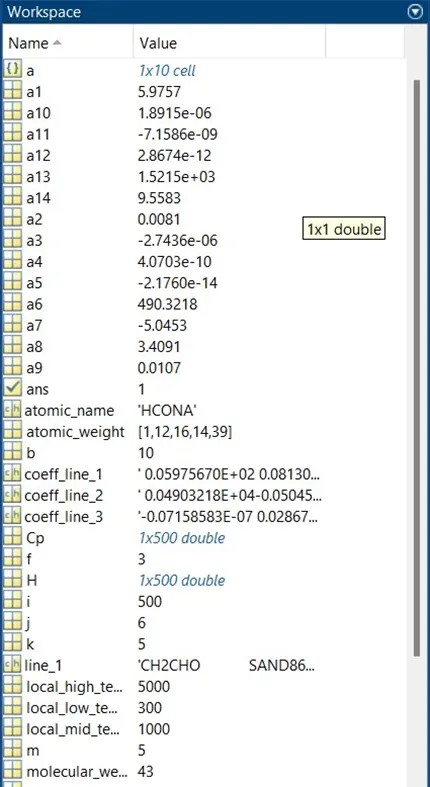
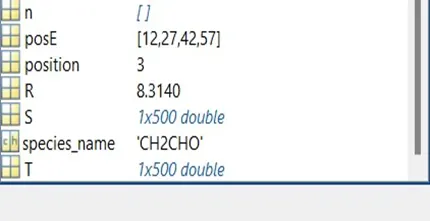
RESULT OF WORKSPACE :-
ERROR AND SOLUTION :-
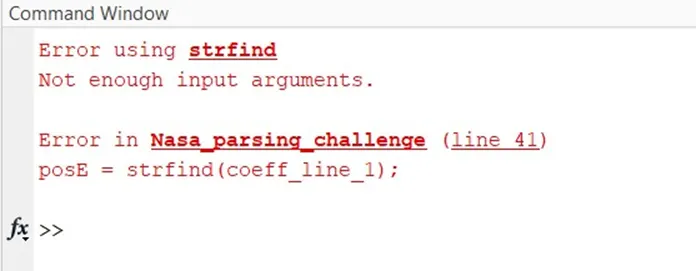
ERROR 1

SOLUTION 1

To fix that problem I written the position of E in single inverted commas.
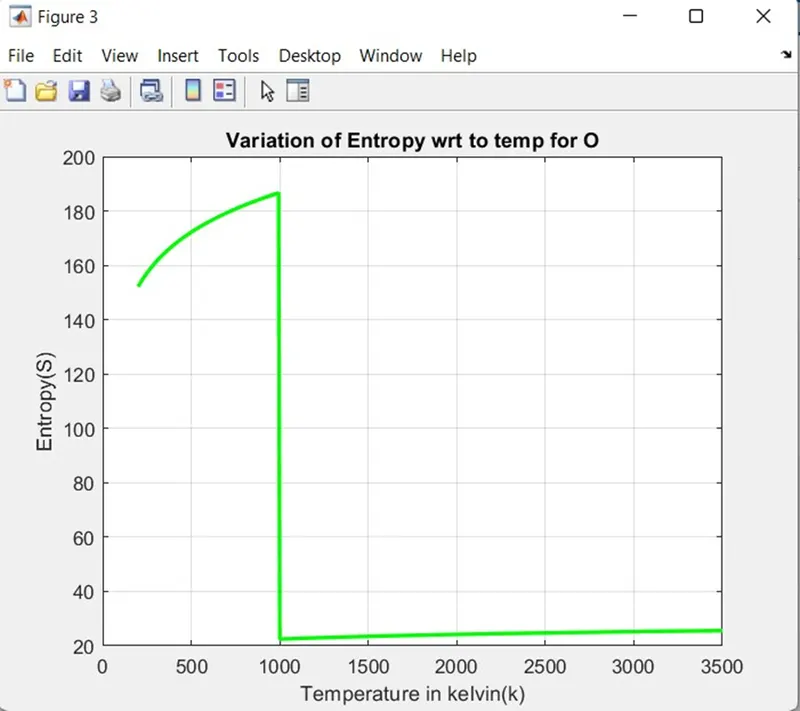
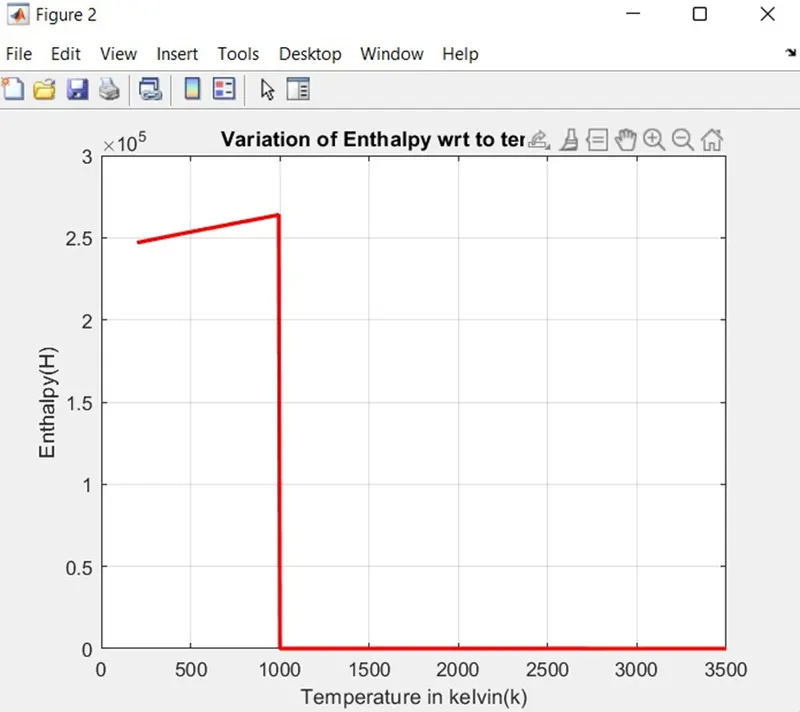
ERROR 2

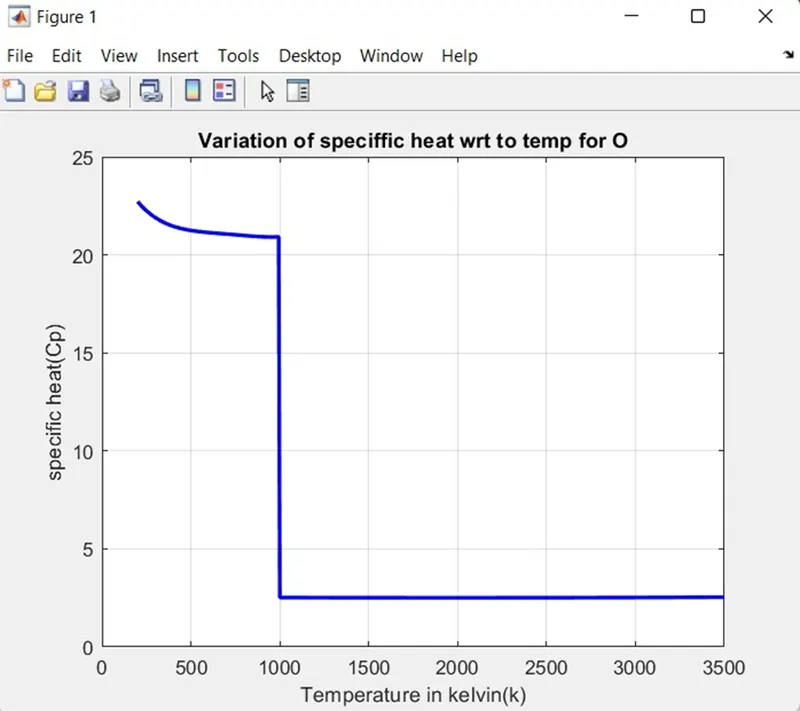
SOLUTION 2

In this problem I was getting wrong graph to fix this problem I had to multiply the governing equation with universal gas constant (R) and temperature (T).
ERROR 3
My third error was I was not able to save the plotted graph in the folder .
SOLUTION 3
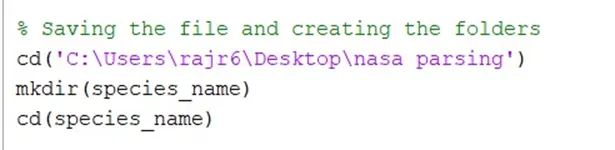
To fix that problem I have written that code which was given above.
ERROR 4

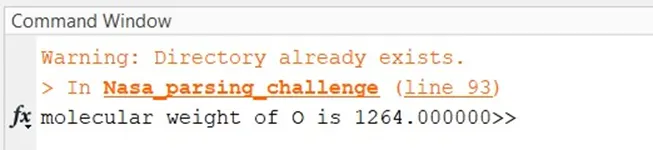
SOLUTION 4

In this problem I was getting wrong molecular weight so fix this problem I used the str2num command.
ERROR 5
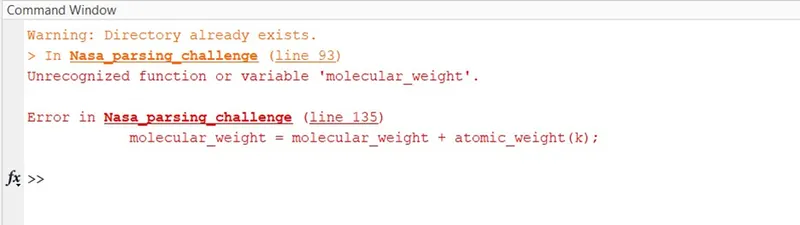
My fifth problem was, I was not assuming the molecular weight.
SOLUTION 5
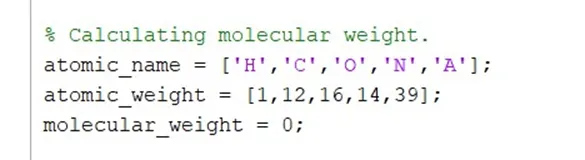
To fix this problem I have assumed molecular weight equal to zero.
ERROR 6

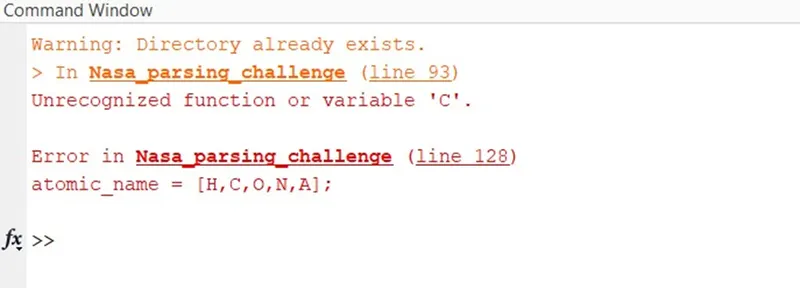
SOLUTION 6

To fix this problem I had to put each and every atomic name in single inverted commas.