Project 1 - Parsing NASA thermodynamic data
AIM:
to parse the nasa thermodynamic data and to calculate the molecular weight of the species and to plot the cp,enthalpy,entropy for the local temperature range for o2,n2,co2.
FILE PARSING:
file parsing refers to examining a file. Using file parsing, data can be extracted from the file which can be stored and be used to perform calculations. Here a thermodynamics file generated by NASA is parsed. From which the high temperature and low temperature of various species are extracted and are further stored to calculate the specific heat(c_p),enthalpy(h) and entropy(s).
SPECIFIC HEAT (C_P):
specific heat capacity is definied as the heat required to rise the temp of a given mass by a unit temp. it is denoted as 'Cp' its unit is "J/K".
ENTHALPY(H):
enthaply refers to the internal energy of a system which includes the temp and pressure. in an enclosed system, the change in heat is refered to as enthalpy of the system.it is denoted as 'H',its unit is "J/MOL".
ENTROPY(S):
entropy is a function of state of a system.it is an external property and is reversible.entropy plays an importantpart in thermodynamics.the second law of thermodynamics is based on entropy which says that entropy of an isolated system never decreases.it is denoted as 'S' its unit is "J/K".
FORMULAS AND MATHEMATICAL EQUATIONS:

EXPLANATION:
- the code starts with close all,clear all,clc.
- the file named "thermo.dat" is given the reading access using the "fopen" comand.
- next line is called using the "fgetl" command and the string is split using the "strsplit" command.
- the numbers in the string are converted using the "str2double" command.
- the global temperatures are extracted using indexing.
- similarly the process is repeated in each line of the first species and the remaining coefficients and the local temperatures are extracted.
- the for loop is used twice one is for skip the first three lines and another is to read the and calculate the coefficients using functions and prohject the plots and figures and results by number of iterations.
- a function is created containing the formulas to calculate the c_p,h and s and is called in the main program.
- a range of temperature is created using the "linspace" command.
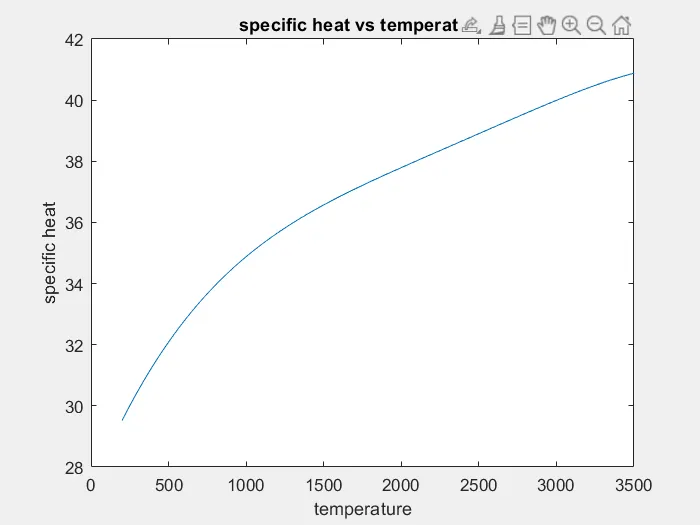
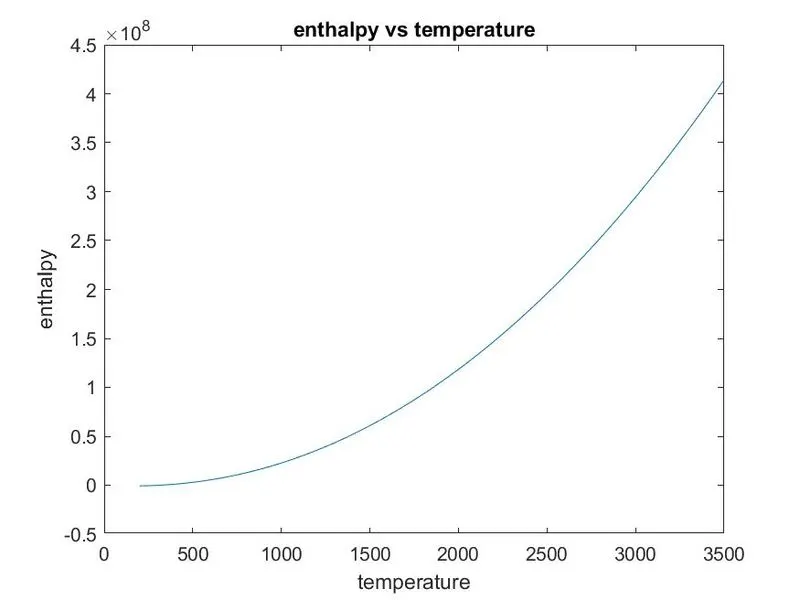
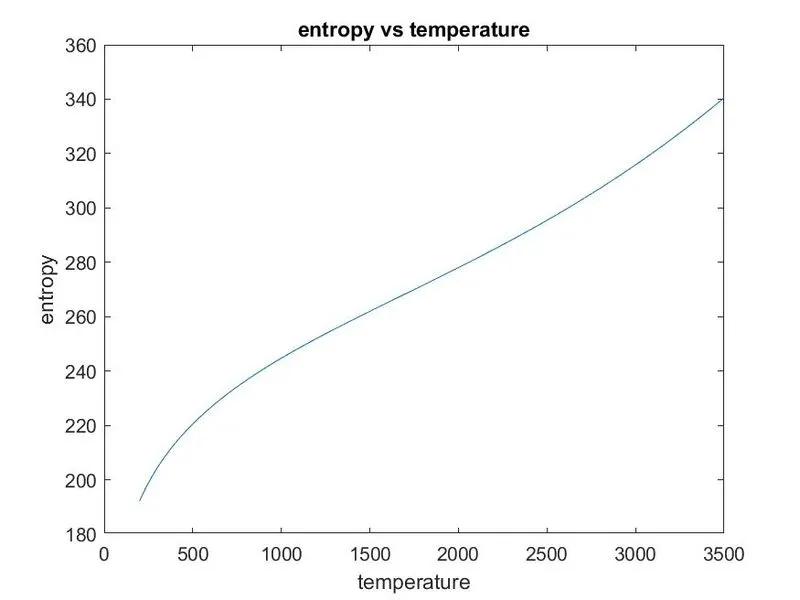
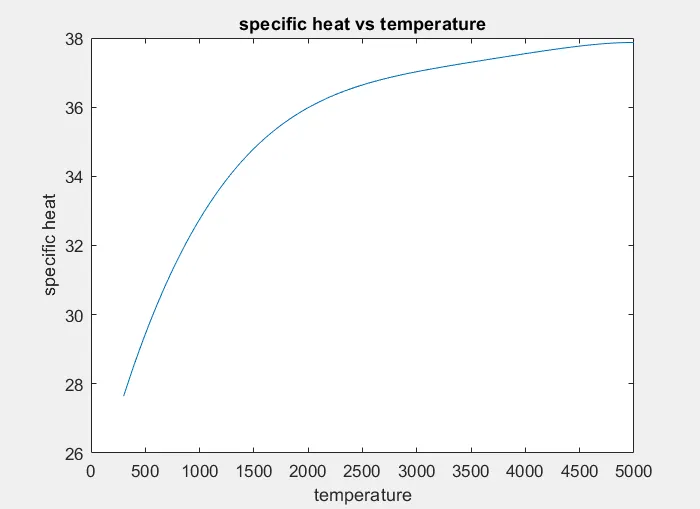
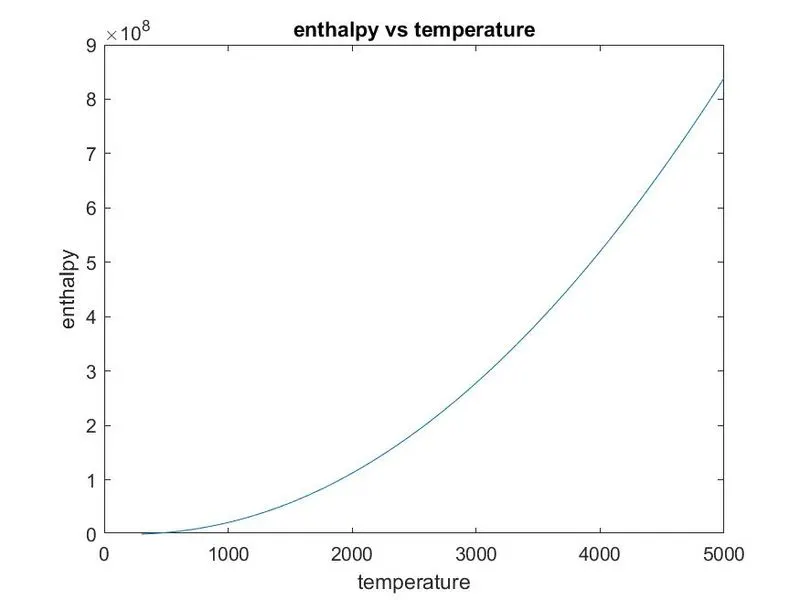
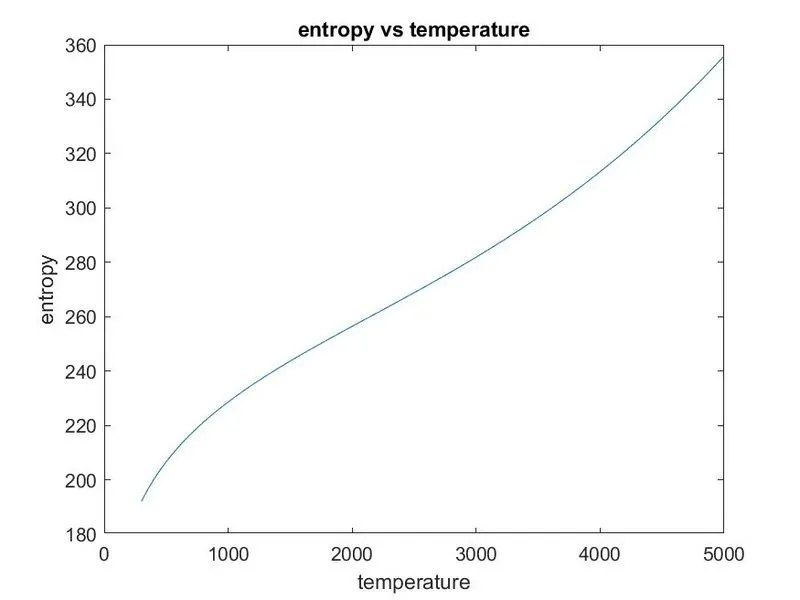
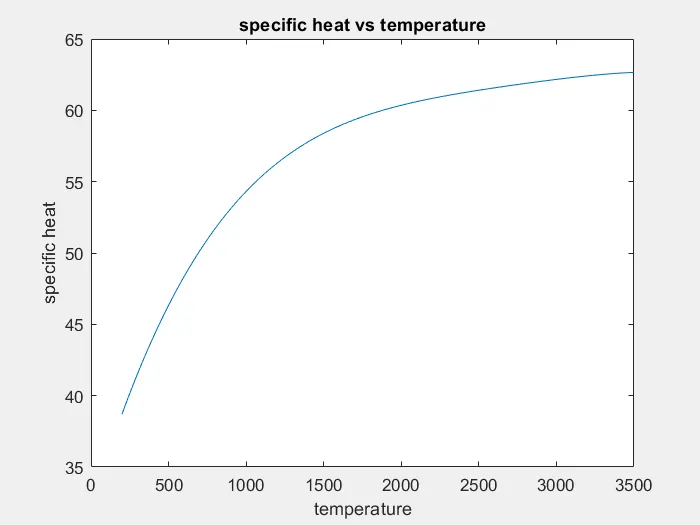
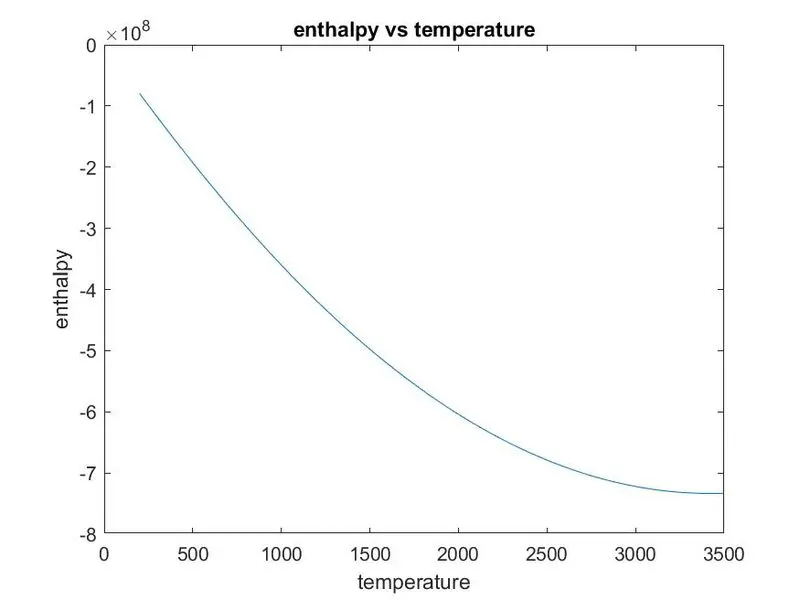
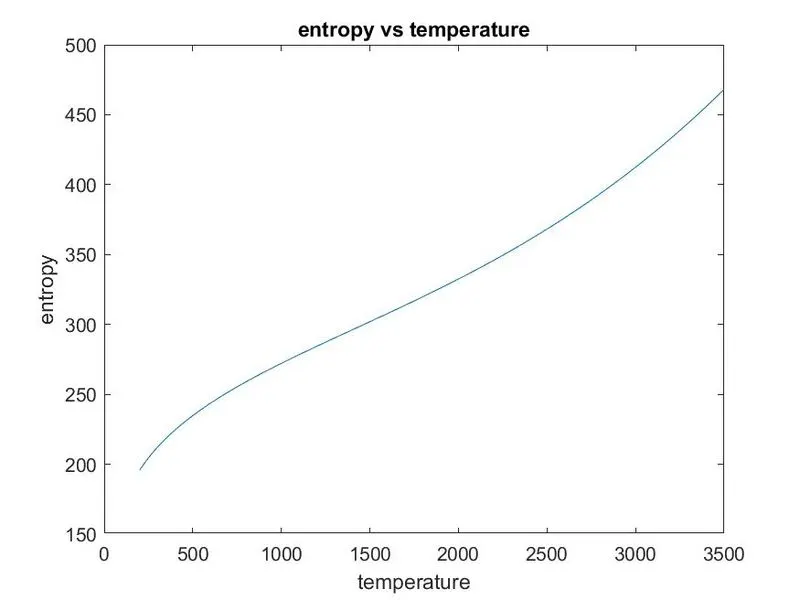
- the c_p,h and s is calculated for this range of temperature and the graphs are plotted.
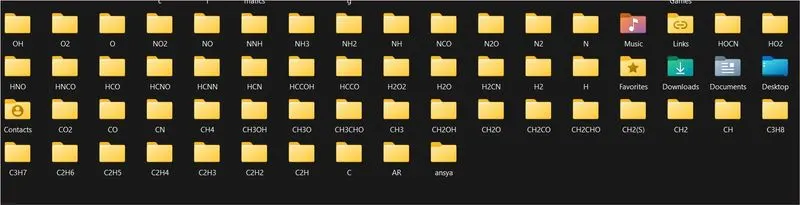
- a different directory is created using the "mkdir" command to make folders with the name of the species and the plots are saved in the particular species name.
- a function is created to calculate the molecular weight of the species and is called in the main program.
- the outputs and the inputs having the high tempererature coefficients and the low temperature coefficients and temperature is determined.
- an "if" conditional loop is used to give the condition to use low temperture coefficients or high temperature coefficients if the temperature is less than mid local temperature and high local temperature respectively.
- the common elements and their respective atomic weight are mentioned.
- a nested for loop is created where one checks the species name and other checks the positon of the element and saves it.
- an "if" conditional loop is used in case the molecules is more than one.
- the molecular weight is calculated accordingly.
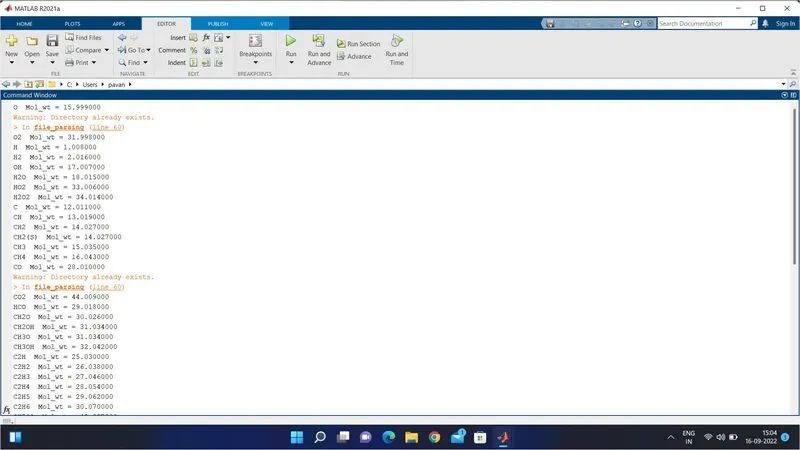
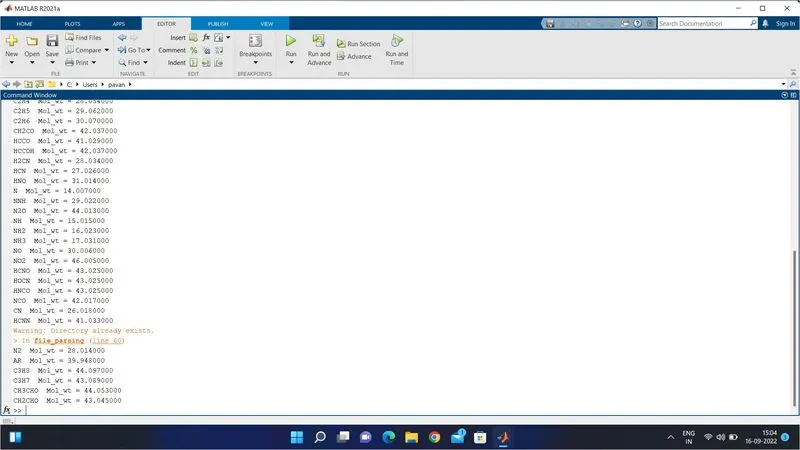
- the "sprintf" command is used to print the molecular weight.
MAIN CODE:
% file parsing using NASA thermodynamic data

close all
clear all
clc
% gas constant
R=8.314;
% opening and raeading a file
f1=fopen('THERMO.dat','r');
tline1 = fgetl(f1);
tline2 = fgetl(f1);
temp=strsplit(tline2,' ');
%extracting the global temp's

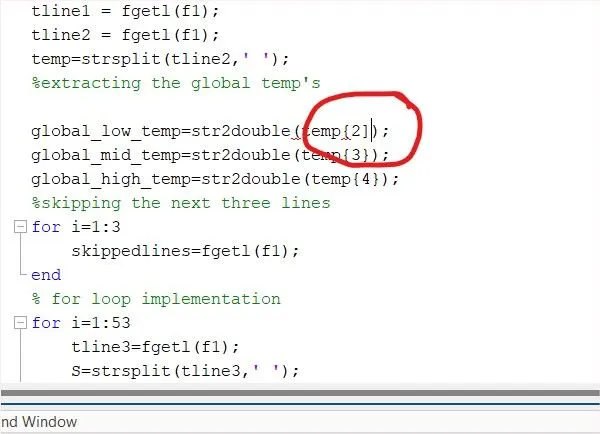
global_low_temp=str2double(temp{2});
global_mid_temp=str2double(temp{3});
global_high_temp=str2double(temp{4});
%skipping the next three lines
for i=1:3
    skippedlines=fgetl(f1);
end
% for loop implementation
for i=1:53
    tline3=fgetl(f1);
    S=strsplit(tline3,' ');
    species_name= S{1};
    temp=strfind(tline3,'G');
    temp_values=tline3(temp+4:length(tline3));
    B=strsplit(temp_values,' ');

    local_low_temp=str2double(B{1});
    local_mid_temp=str2double(B{3});
    local_high_temp=str2double(B{2});

    tline4=fgetl(f1);
    f=strfind(tline4,'E');
    a1=str2double(tline4(1:(f(1)+3)));
    a2=str2double(tline4(f(1)+4:(f(2)+3)));
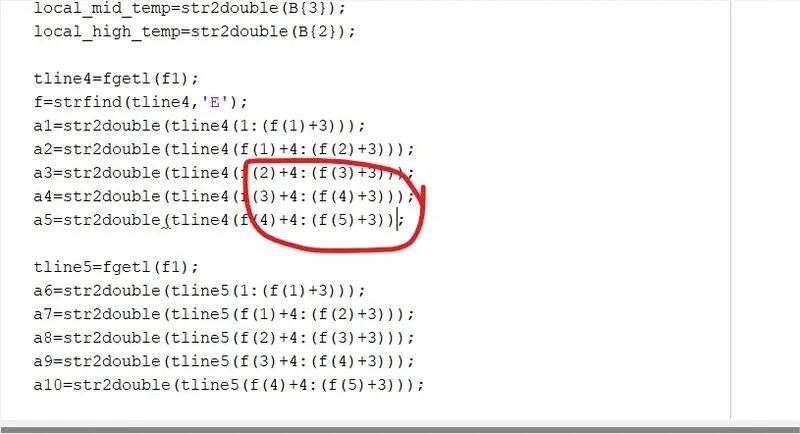
    a3=str2double(tline4(f(2)+4:(f(3)+3)));
    a4=str2double(tline4(f(3)+4:(f(4)+3)));
    a5=str2double(tline4(f(4)+4:(f(5)+3)));

    tline5=fgetl(f1);
    a6=str2double(tline5(1:(f(1)+3)));
    a7=str2double(tline5(f(1)+4:(f(2)+3)));
    a8=str2double(tline5(f(2)+4:(f(3)+3)));
    a9=str2double(tline5(f(3)+4:(f(4)+3)));
    a10=str2double(tline5(f(4)+4:(f(5)+3)));

    tline6=fgetl(f1);
    a11=str2double(tline6(1:(f(1)+3)));
    a12=str2double(tline6(f(1)+4:(f(2)+3)));
    a13=str2double(tline6(f(2)+4:(f(3)+3)));
    a14=str2double(tline6(f(3)+4:(f(4)+3)));

    % range of temperature for c_p,h,and s were calculated:
    T=linspace(local_low_temp,local_high_temp,100);
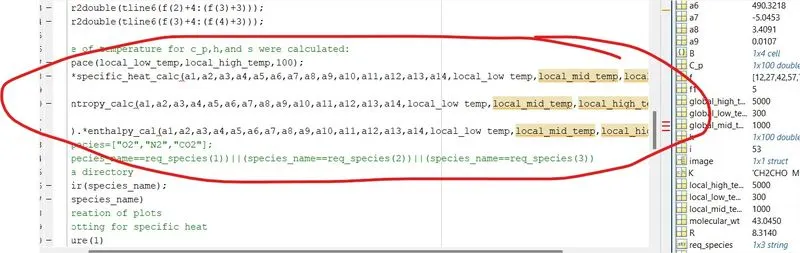
    C_p=R.*specific_heat_calc(a1,a2,a3,a4,a5,a8,a9,a10,a11,a12,local_mid_temp,T);

    s=R.*entropy_calc(a1,a2,a3,a4,a5,a7,a8,a9,a10,a11,a12,a14,local_mid_temp,T);

    h=(R*T).*enthalpy_cal(a1,a2,a3,a4,a5,a6,a8,a9,a10,a11,a12,a13,local_mid_temp,T);
 %   req_species=["O2","N2","CO2"];
 %    if(species_name==req_species(1))||(species_name==req_species(2))||(species_name==req_species(3))
 % making a directory
       mkdir(species_name);
       cd(species_name)
       % creation of plots
       %plotting for specific heat
       figure(1)
       plot(T,C_p)
       title('specific heat vs temperature')
       xlabel('temperature')
       ylabel('specific heat')
       image=getframe(gcf);
       imwrite(image.cdata,'cp vs T.png')
       saveas(1,'specific_heat','jpg')

       %plotting for enthalpy

       figure(2)
       plot(T,h)
       title('enthalpy vs temperature')
       xlabel('temperature')
       ylabel('enthalpy')
       image=getframe(gcf);
       imwrite(image.cdata,'h vs T.png')
       saveas(2,'enthalpy','jpg')

       %plotting for entropy

       figure(3)
       plot(T,s)
       title('entropy vs temperature')
       xlabel('temperature')
       ylabel('entropy')
       image=getframe(gcf);
       imwrite(image.cdata,'s vs T.png')
       saveas(3,'entropy','jpg')


           cd ..
 %    end
   %molecular weight calculation
    molecular_wt=molecular_weight(species_name);
    K=sprintf('%s  Mol_wt = %f',species_name,molecular_wt);
    disp(K)


end
FUNCTION FOR CALCULATE MOLECULAR WEIGHT:
%function code for molecular weight

function [M]= molecular_weight(species_name)

Atomic_mass=[15.999,1.008,12.011,14.007,39.948];
Elements=['O','H','C','N','A'];

Mol_wt=0;
for i=1:length(species_name)
    for j=1:length(Elements)
        if strcmpi(species_name(i),Elements(j))
            Mol_wt= Mol_wt+Atomic_mass(j);
            z=j;
        end
    end

    var=str2double(species_name(i));
    if (var>1)
        Mol_wt=Mol_wt+(Atomic_mass(z)*(var-1));
    end
end
M=Mol_wt;
end
FUNCTION FOR C_P:
%function code for specific heat
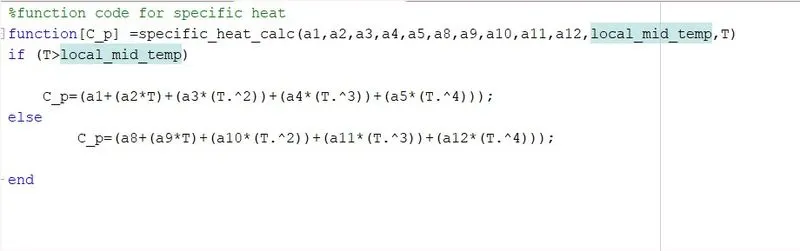
function[C_p] =specific_heat_calc(a1,a2,a3,a4,a5,a8,a9,a10,a11,a12,local_mid_temp,T)
if (T<=local_mid_temp)
    C_p=(a8+(a9*T)+(a10*(T.^2))+(a11*(T.^3))+(a12*(T.^4)));
else
    C_p=(a1+(a2*T)+(a3*(T.^2))+(a4*(T.^3))+(a5*(T.^4)));
end
end
FUNCTION FOR S:
%function code for entropy
function [s]= entropy_calc(a1,a2,a3,a4,a5,a7,a8,a9,a10,a11,a12,a14,local_mid_temp,T)

if (T<=local_mid_temp)
    s=(a8*log(T)+(a9*T)+(a10*(T.^2)/2)+(a11*(T.^3))+(a12*(T.^4)/4)+a14);
else

    s=(a1*log(T)+(a2*T)+(a3*(T.^2)/2)+(a4*(T.^3))+(a5*(T.^4)/4)+a7);
end
end
FUNCTION FOR H:
%function code for enthalpy
function [h]=enthalpy_cal(a1,a2,a3,a4,a5,a6,a8,a9,a10,a11,a12,a13,local_mid_temp,T)


if (T<=local_mid_temp)
   h=(a8*T+(a9*(T.^2)/2)+(a10*(T.^3)/3)+(a11*(T.^4)/4)+(a12*(T.^5)/5)+a13);
else

     h=(a1*T+(a2*(T.^2)/2)+(a3*(T.^3)/3)+(a4*(T.^4)/4)+(a5*(T.^5)/5)+a6);
end
end
OUT PUT:
C_P OF O2:
ENTHALPY OF O2:
ENTROPY OF O2:
C_P OF N2:
ENTHALPY OF N2:
ENTROPY OF N2:
C_P OF CO2:
ENTHALPY OF CO2:
ENTROPY OF CO2:
COMMAND WINDOW :
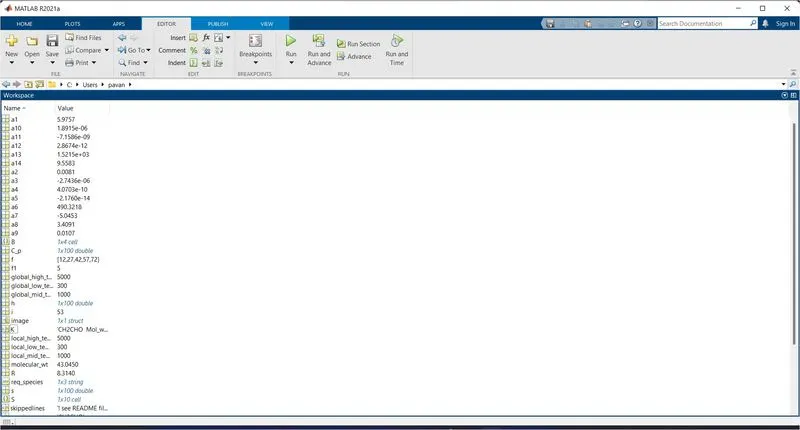
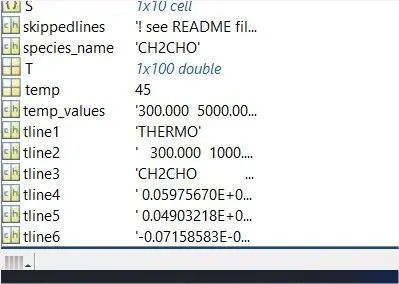
WORK SPACE:
INDIVIDUAL FOLDERS FOR PLOT RESULTS:
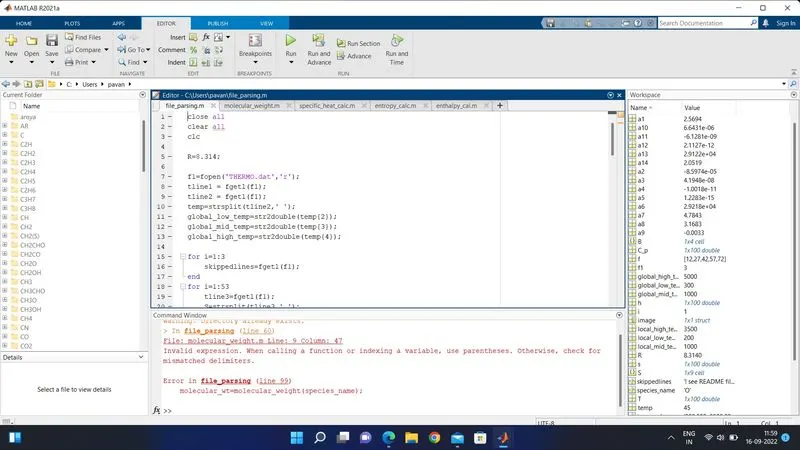
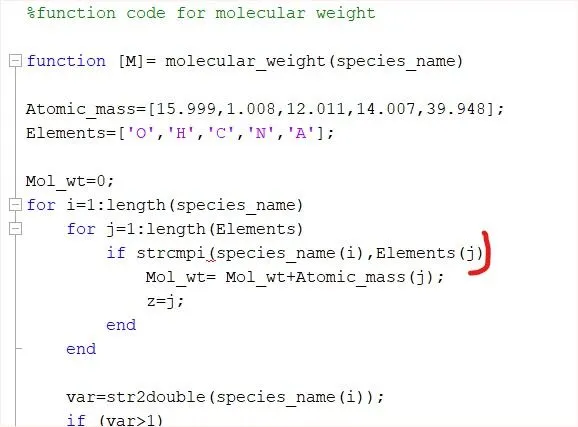
ERRORS:
most of the errors are held ,cause of improper paranthesis
conclusion:
- the coefficients were extracted from the file.
- the molecular weight were calculated for all the compound.
- the graphs were plotted and were saved in their respective compound folder.