Project 1 - Parsing NASA thermodynamic data
Sub Program:
1. Function to Calculate Specific Heat:
% specific heat function

function c_p = specific_heat(a1,a2,a3,a4,a5,a6,a7,b1,b2,b3,b4,b5,b6,b7,R,...
    temp,global_min,global_max,global_mid)

    if temp<=global_mid
       c_p = R*(a1 + a2.*temp + a3.*(temp.^2) + a4.*(temp.^3) + a5.*(temp.^4));
    else
        c_p = R*(b1 + b2.*temp+b3.*(temp.^2) + b4.*(temp.^3) + b5.*(temp.^4));

end
2. Function to Calculate Enthalpy:
% Enthalpy function

function H = enthalpy(a1,a2,a3,a4,a5,a6,a7,b1,b2,b3,b4,b5,b6,b7,R,temp,...
    global_min,global_max,global_mid)

    if temp <=global_mid
        H = R.*temp.*(a1 + a2.*(temp./2) + a3.*((temp.^2)./3) + a4.*((temp.^3)./4)...
            + a5.*((temp.^4)./5) + a6./temp);
    else
        H = R.*temp.*(b1 + b2.*(temp./2) + b3.*((temp.^2)./3) + b4.*((temp.^3)./4)...
            + b5.*((temp.^4)./5) + b6./temp);

end
3. Function to Calculate Entropy:
% Entropy function

function S = entropy(a1,a2,a3,a4,a5,a6,a7,b1,b2,b3,b4,b5,b6,b7,R,temp,global_min,global_max,global_mid)

    if temp<=global_mid
        S = R*(a1.*log(temp) + a2.*temp + a3.*(temp.^2)./2 + a4.*(temp.^3)./3 + a5.*(temp.^4)./4 + a7);
   else
        S = R*(b1.*log(temp) + b2.*temp + b3.*(temp.^2)./2 + b4.*(temp.^3)./3 + b5.*(temp.^4)./4 + b7);

end- These function uses the high-temperature coefficients, low-temperature coefficients, universal gas constant, and global minimum, global mid and global maximum temperature values as the input parameters.
Main Program:
clear all
close all
clc

%Inputs

R= 8.314;

% Reading the data file

f1 = fopen('THERMO.dat','r');

%Reading the first line of the file

L1 = fgetl(f1);

% Getting the global minimum, maximum and mid temperatures

L2 = fgetl(f1);
t = strsplit(L2);
global_min = str2double(t{2});
global_mid = str2double(t{3});
global_max = str2double(t{4});

% Defining the temperature range

temp = linspace (global_min,global_max,500);

% Ignoring the comments in the file

for i=1:3
fgetl(f1);
end

for i=1:53
    %Reading the first line which includes the information for species

    l=fgetl(f1);

    % Reading the name of the species

    element_name=strtok(l);

    % Reading the three lines which contains 7 high temp coefficients & 7 low temp
    % coefficients

    l1=fgetl(f1);
    l2=fgetl(f1);
    l3=fgetl(f1);

    % Finding the position of E so that we can extract the coefficients

    a=strfind(l1,'E');
    b=strfind(l2,'E');
    c=strfind(l3,'E');

    % Extracting high temp coefficient

    a1=str2double(l1(1:a(1)+3));
    a2=str2double(l1(a(1)+3:a(2)+3));
    a3=str2double(l1(a(2)+4:a(3)+3));
    a4=str2double(l1(a(3)+4:a(4)+3));
    a5=str2double(l1(a(4)+4:a(5)+3));
    a6=str2double(l2(1:b(1)+3));
    a7=str2double(l2(b(1)+4:b(2)+3));

    % Extracting low temp coefficient

    b1=str2double(l2(b(2)+4:b(3)+3));
    b2=str2double(l2(b(3)+4:b(4)+3));
    b3=str2double(l2(b(4)+4:b(5)+3));
    b4=str2double(l3(1:c(1)+3));
    b5=str2double(l3(c(1)+4:c(2)+3));
    b6=str2double(l3(c(2)+4:c(3)+3));
    b7=str2double(l3(c(3)+4:c(4)+3));

    % Calculating specific heat

    c_p = specific_heat(a1,a2,a3,a4,a5,a6,a7,b1,b2,b3,b4,b5,b6,b7,R,temp,...
        global_min,global_max,global_mid);

    % Calculalting enthalpy

    H = enthalpy(a1,a2,a3,a4,a5,a6,a7,b1,b2,b3,b4,b5,b6,b7,R,temp,global_min,...
        global_max,global_mid);

    % calculating entropy

    S = entropy(a1,a2,a3,a4,a5,a6,a7,b1,b2,b3,b4,b5,b6,b7,R,temp,global_min,...
        global_max,global_mid);

% plotting graphs for all elements
% plotting(c_p,H,S,temp,element_name)
cd(pwd);
dir_name=element_name;
mkdir(dir_name);

%Plotting temperature vs specific heat
figure(1)
plot(temp,c_p,'lineWidth',3,'color','r');
title(sprintf('Specific Heat vs Temperature for %s:',element_name));
xlabel('Temperature [K]');
ylabel('Specific Heat [J/(mol-K)]');

% Plotting temperature vs Enthalpy
figure(2)
plot(temp,H,'linewidth',3,'color','g');
title(sprintf('Enthalpy vs Temperature for %s:',element_name));
xlabel('Temperature [K]');
ylabel('Enthalpy [J/mol]');

% Plotting temperature vs Entropy
figure(3)
plot(temp,S,'linewidth',3,'color','b');
title(sprintf('Entropy vs Temperature for %s:',element_name));
xlabel('Temperature [K]');
ylabel('Entropy [J/(mol-K)]');
cd(dir_name);

saveas(1,'c_p_vs_temp.png');
saveas(2,'H_vs_temp.png');
saveas(3,'S_vs_temp.png');

cd .. ;

end
- The value of universal gas constant is considered as R = 8.314 for input.
- fopen command is used to open the file and 'r' represents read mode.
- fgetl command is used to read the file line by lilne.
- Then a ‘for’ loop is created to loop through the 53 species data given in the file and calculate the required values.
- The low temperatures co-efficients are stored in variables a1,a2,a2,a4,a5,a6 and a7 and the high temperature co-efficients are stored in variables b1,b2,b3,b4,b5,b6 and b7.
- The strings are coverted into numbers by using the command 'str2double' and stored in a specific variables.
- Using the ‘mkdir’ command a new folder is created in the current folder ‘pwd’ with the same name as the element name.
- Using the ‘saveas’ command the three figures are saved in the new folder which is created by the element name.
- Using the ‘cd’ command the folder is changed back to the original folder.
- The function runs for 53 times through the ‘for’ loop and it creates separate folders for each species and saves all the plots in the folders.
Screenshot of the window where all the folders are saved:

Plots for o2, N2 and Co2 species:
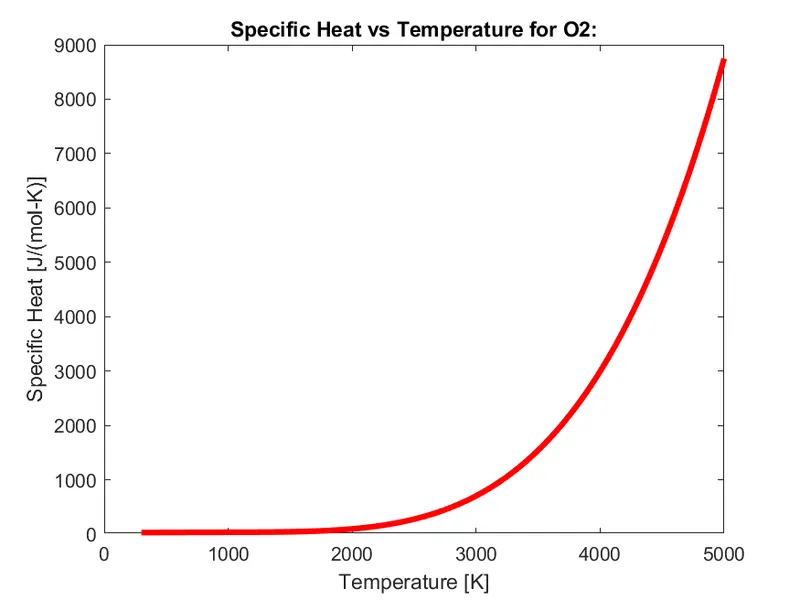
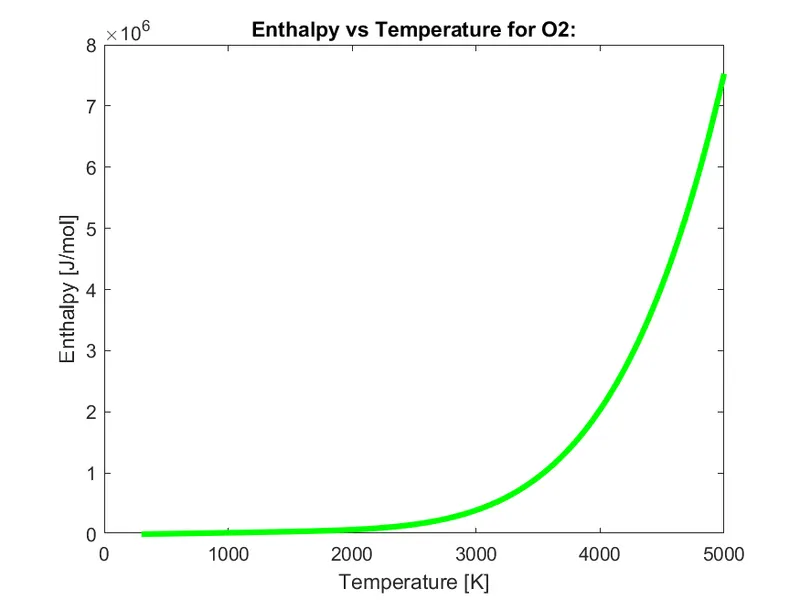
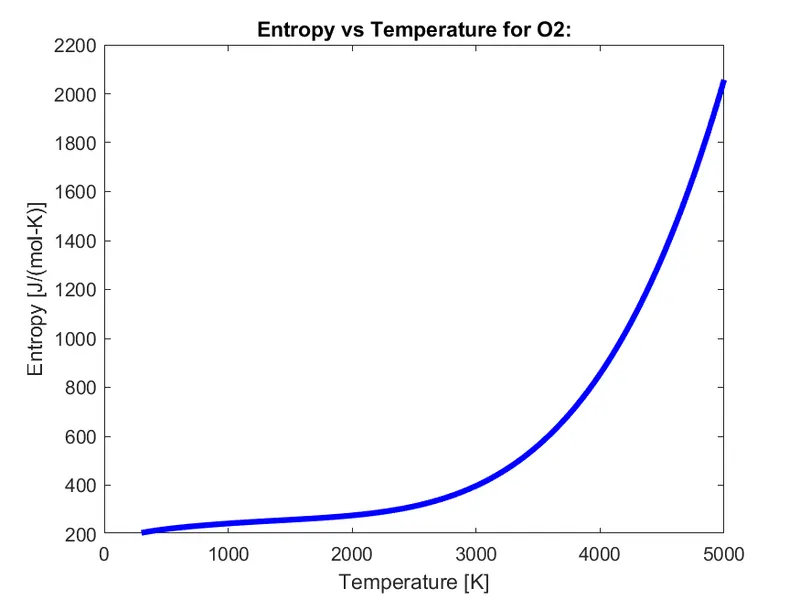
Plotting Specific heat, Enthalpy and Entropy vs Temperature for o2 species:
a. Temperature vs Specific heat (o2)
b. Temperatute vs Enthalpy (o2)
c. Temperature vs Entropy (o2)
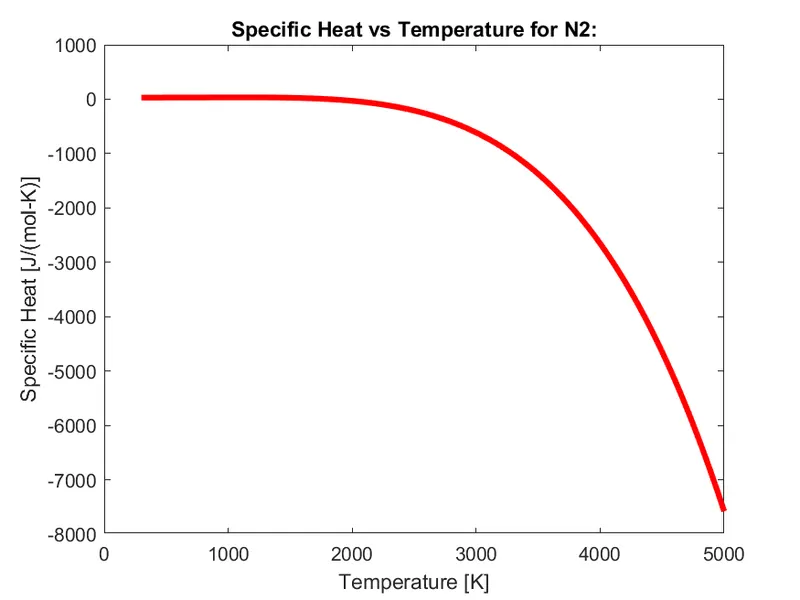
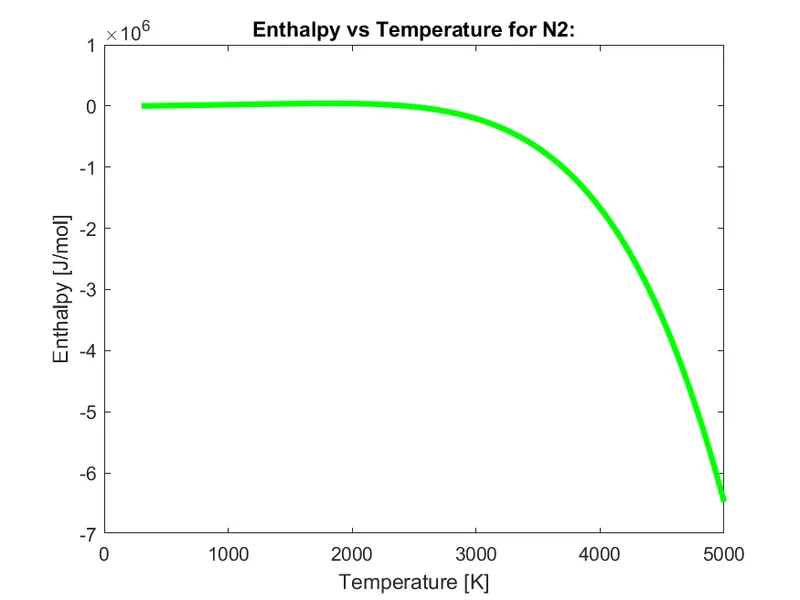
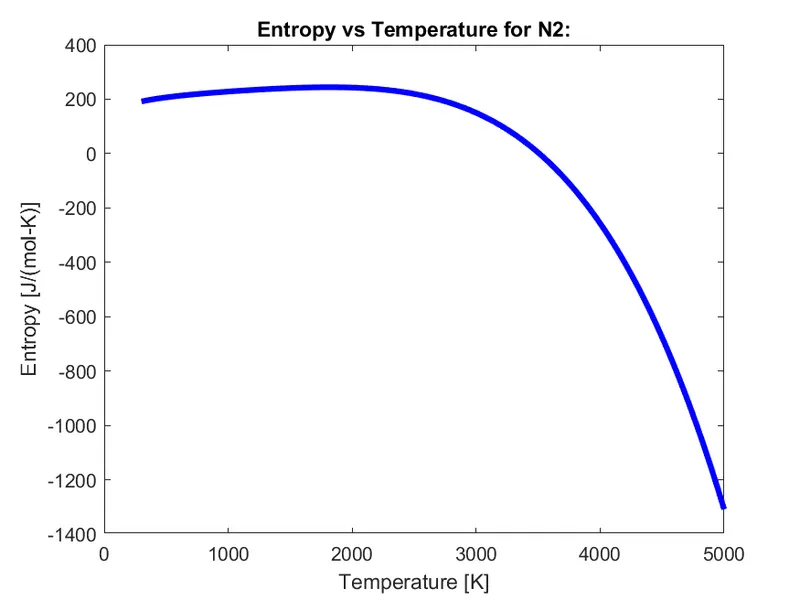
Plotting Specific heat, Enthalpy and Entropy vs Temperature for N2 species:
a. Temperature vs Specific heat (N2)
b. Temperature vs Enthalpy (N2)
c. Temperature vs Entropy (N2)
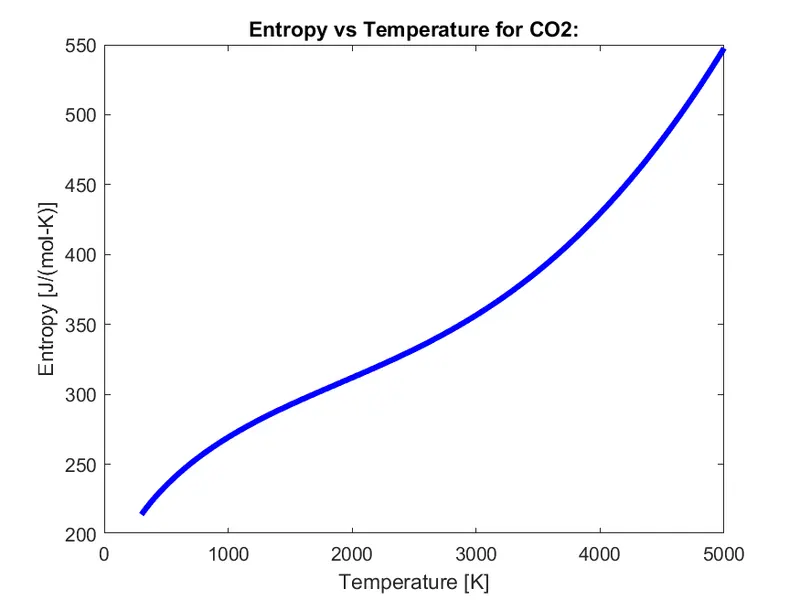
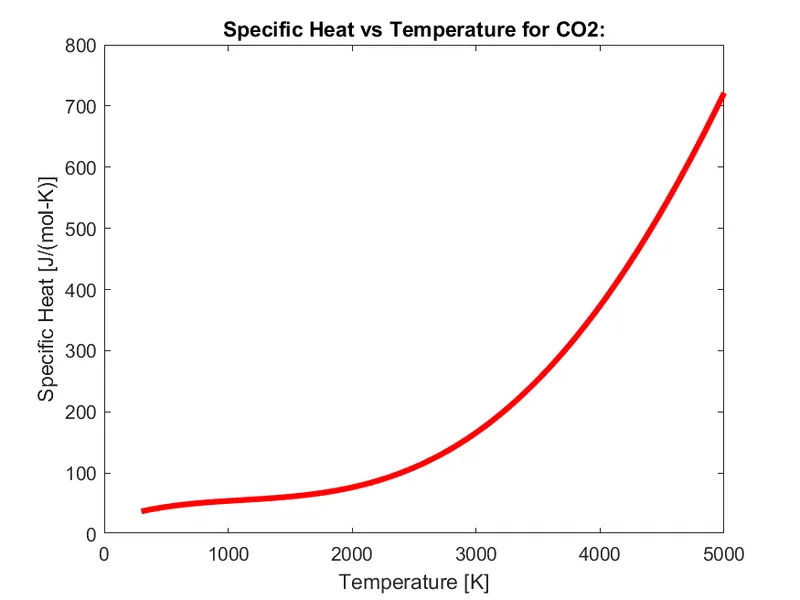
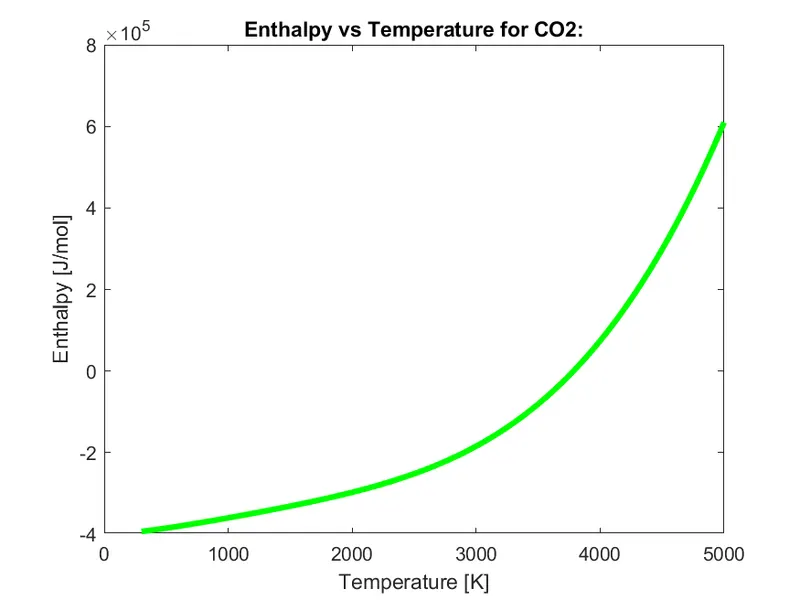
Plotting Specific heat, Enthalpy and Entropy vs Temperature for Co2 species:
a. Temperature vs Specific heat (Co2)
b. Temperature vs Enthalpy (Co2)
c. Temperature vs Entropy(Co2)