Project 1 - Parsing NASA thermodynamic data
AIM:
To write a program to parse the data from NASA's data file containing thermodynamic properties such as Cp, H and S. Then calculate the thermodynamic properties and molecular weight of the all species.
OBJECTIVE:
1. To write a function that extracts the 14 co-efficients and calculates the enthalpy, entropy and specific heats for all the species in the data file "NASA thermodynamic data". The formulae are shown below.
Here R is the universal gas constant, T is the temeprature
2. To calculate the molecular weight of each species and display it in the command window.
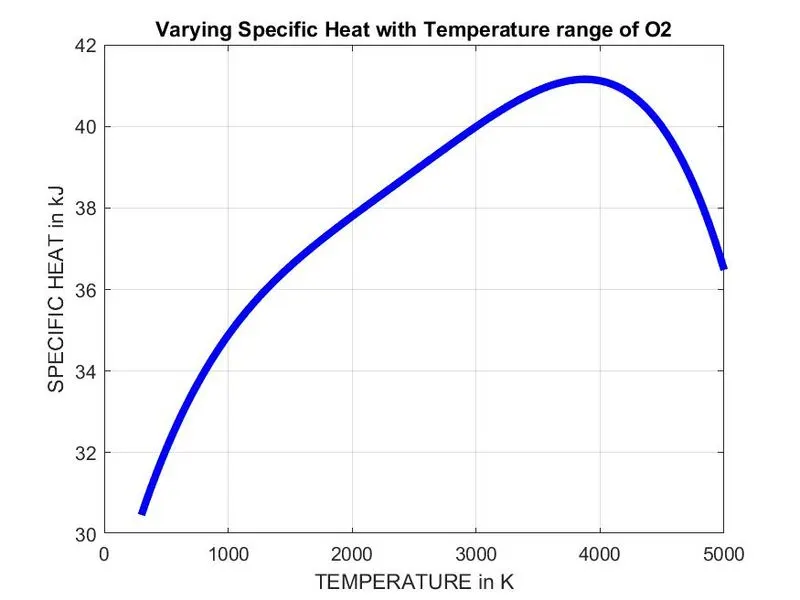
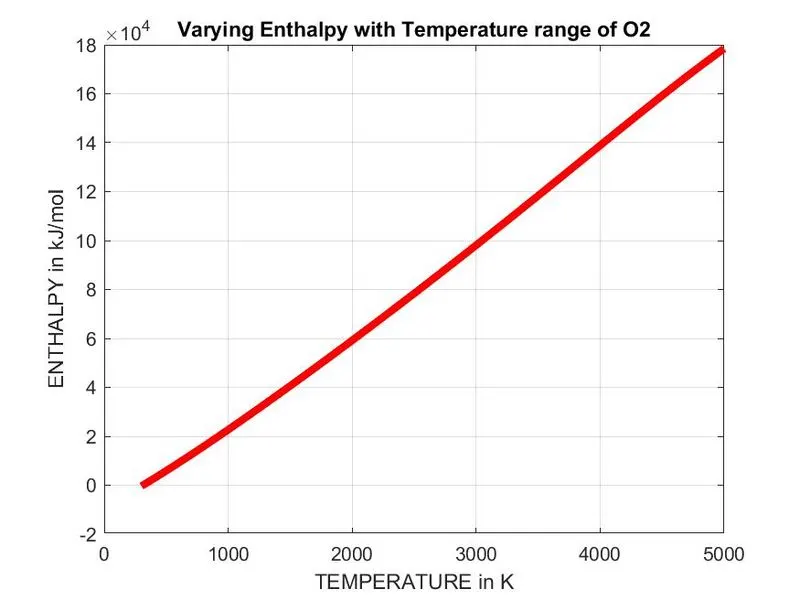
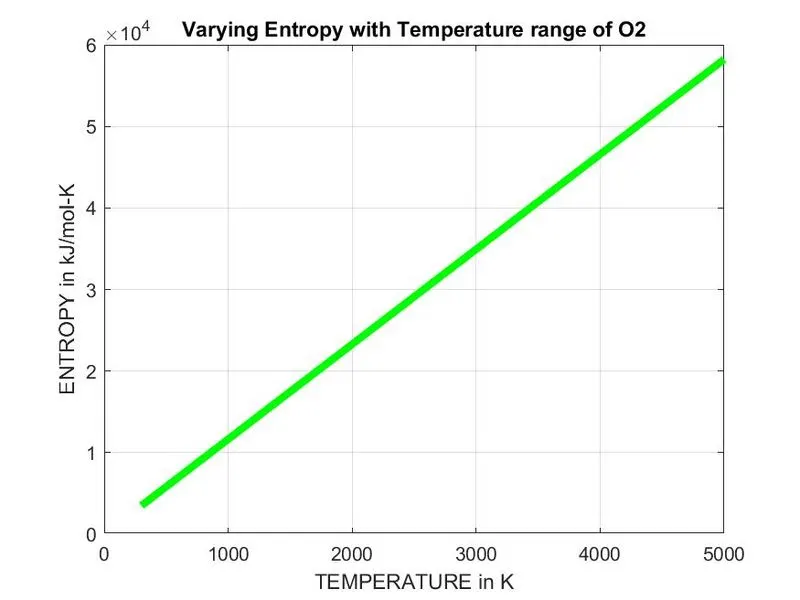
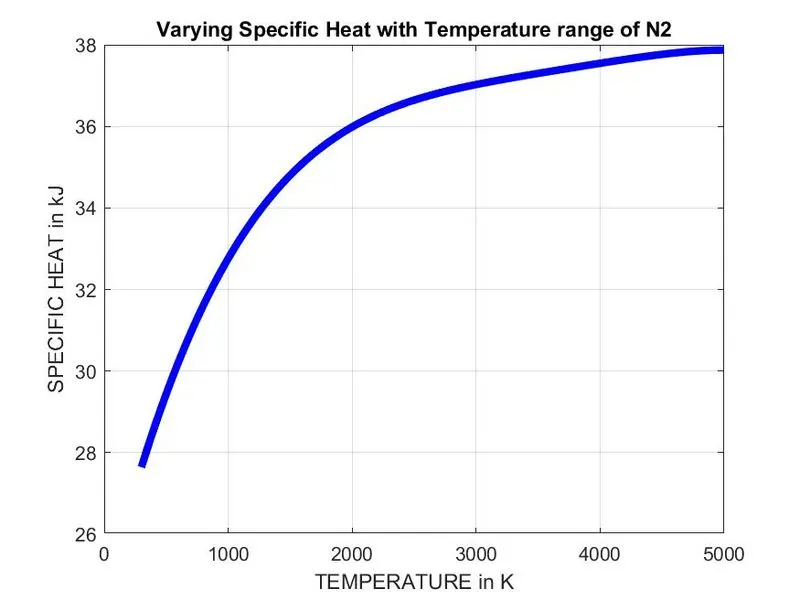
3. To plot the Cp, Enthalpy and Entropy for the local temperature range (low temperature : high temperature) specific for each species.
4. To save the plots as images with appropriate names and dump them in separate folders for each species with suitable name. All these should be generated automatically.
NASA Thermodynamic data:
The given THERMO.dat file is a data file containing 14 coefficients for 53 different elements given by NASA. These coefficients are utilized to calculate the specific heat, enthalpy & entropy for a particular element. Each element has its own range of local temperature.
File prasing
The File Parser process enables you to convert data from an external file into PeopleSoft data and place it into tables in your Campus Solutions database. The external file can be a delimited file or a flat file. It can be a simple file with one row type or a complex file with several row types. If your institution routinely receives an external file from which you need to move data into your database, consider using the File Parser process to expedite the entry of that data. Whether the file is a small one that your institution receives daily or a large one that is received annually, the one-time setup of the File Parser process for that file can save significant data entry time.
coding:
SPECIFIC HEAT:
specific heat is the quantity of heat required to raise the temperature of unit mass of a substance by one Celsius degree.
the formula for specific heat for the thermodynamic data is
Cp = R*(a1+a2(T)+a3(T^2)+a4(T^3)+a5(t^4))
function used for specific heat:
% specific heat calculation function

function cp = Specificheat(a1,a2,a3,a4,a5,a8,a9,a10,a11,a12,temp,R,global_medium_temp)
%comparing the global temperature
% if less then global temperature - minimum coefficient are are taken
if temp <= global_medium_temp
    cp = R*(a8+(a9*temp)+(a10*(temp).^2)+(a11*(temp).^3)+(a12*(temp).^4));
else
    cp = R*(a1+(a2*temp)+(a3*(temp).^2)+(a4*(temp).^3)+(a5*(temp).^4));
    %else maximum coefficient are taken
end
Enthalpy:
Enthalpy is the sum of the system's internal energy and the product of its pressure and volume.
the formula for enthalpy for the thermodynamic data is
H = R*T*(a1+a2(T/2)+a3(T^2/3)+a4(T^3/4)+a5(t^4/5)+(a6/T))
function used for enthalpy calculation
%Entalpy calculation function
function H = enthalpy(a1,a2,a3,a4,a5,a6,a8,a9,a10,a11,a12,a13,temp,R,global_medium_temp)
%comparing with global temperature

if temp <= global_medium_temp
    H=R*temp.*(a8+((a9*temp)/2)+((a10*(temp).^2)/3)+((a11*(temp).^3)/4)+((a12*(temp).^4)/5)+((a13./temp)));
else
    H=R*temp.*(a1+((a2*temp)/2)+((a3*(temp).^2)/3)+((a4*(temp).^3)/4)+((a5*(temp).^4)/5)+((a6./temp)));
end
Entropy:
Entropy is the measure of a system's thermal energy per unit temperature that is unavailable for doing useful work. Because work is obtained from ordered molecular motion, the amount of entropy is also a measure of the molecular disorder, or randomness, of a system
the formula for Entropy for the thermodynamic data is
S = R*(a1*(ln(T))+a2(T)+(a3(T^2)/2)+(a4(T^3)/3)+(a5(t^4)/4)+a6)
function used for entropty calculation
% Entropy calculation function
function S = entropy_calc(a1,a2,a3,a4,a5,a7,a8,a9,a10,a11,a12,a14,temp,R,global_medium_temp)
%compare with global temperature
%If less than global temperature- minimum coefficient are taken
if temp <= global_medium_temp
    S = R.*(a8.*log(temp)+(a9.*temp)+(a10*((temp).^2)/2)+(a11*((temp).^3)/3)+(a12*((temp).^4)/4)+a14);
else
    %else -maximum coefficent are taken
    S = R.*(a1.*log(temp)+(a2.*temp)+(a3*((temp).^2)/2)+(a4*((temp).^3)/3)+(a5*((temp).^4)/4)+a7);
end
Molecular weight:
molecular weight is the sum of the atomic masses of all atoms in a molecule. Different molecules of the same compound may have different molecular masses because they contain different isotopes of an element.

function used for calculating and printing molecular weight:
%molecular weight calculation function
function Molecularweight = Molecular_weight(species_sp)
%standard - atomic name
atomic_name= ['H','C','O','N','A'];
%Hydrogen, carbon, oxygen, nitrogen, argon
% standard atomic number
Atomic_Weight = [1.008 12.011 15.999 14.007 39.948];
Molecularweight = 0;      %initaial value of the molecular weight

%Adding atomic number to obtain particular value
for i = 1:length(species_sp)
    for j = 1:length(atomic_name)
        if strcmpi(species_sp(i),atomic_name(j))
            Molecularweight = Molecularweight+Atomic_Weight(j);
            position = j;
        end
    end
    n=str2num(species_sp(i));
    if n>0
        Molecularweight = Molecularweight+(Atomic_Weight(position)*(n-1));
    end
end
 fprintf('molecular weight of %s is %.4f \n',species_sp,Molecularweight);
 disp('  ');% for space b/w lines
end
function code explanation:
1. first the name of the atoms are enter in an array and stored in a variable atomic_name
2. The atomic weight of the element is mentioned in an array with respect to the elements in the array atomic_name and stored in a variable Atomic_weight.
3.Initially the value of the variable is set to zero.
4. The logic in finding the molecular weight is by adding atomic weight of each element in the molecules. this is done by adding each elements atomic weight one by one which is achieved through nested for loop commad.
5. In for loop the number for loop is found using length command of species_sp. Then using if command and strcmpi command (used to compare case sensitive strings) the value of variable Molecularwight is increased by adding the atomic weight one by one.
6. Inbetween the string numbers come the number are converted from string to numbers using str2num command. then it is compared with zero where if the number greater than zero the n-1 value is multiplied with the atomic weight and added to the molecular weight.
7. the process repeats till the length of the species completed.
8. then fprintf command us used to display the output in the command window. the disp command is used here to get space between lines.
main code:
clear all
close all
clc
% creating new folder in desktop
mkdir 'C:\Users\Admin\Desktop\nasa_file'
% reading data file -nasa thermodynamic
f1=fopen('THERMO.dat','r');% fopen for open a file & 'r' open the file for reading
gt=fgetl(f1);%Read line from file, removing newline characters

%obtaining temperatures - by reading the header information
global_temp =fgetl(f1);
%splitting string or character vector at specified delimiter
t=strsplit(global_temp);

%converting string cells to numbers using str2num,
global_low_temp =str2num(t{2});
global_medium_temp =str2num(t{3});
global_high_temp =str2num(t{4});

%temperature range & gas constant
%temperature range assumed
temp=linspace(global_low_temp,global_high_temp,500);
R=8.314;%universal gas constant J/(mol-k)
%skipping three commant line in the file
for i=1:3
    gt=fgetl(f1);
end

  for i=1:53  % looped for 53 time to get all 53 elements
    gt=fgetl(f1);
    A=strsplit(gt,'  ');
    species_sp =(A{1});

    line_1=fgetl(f1);
    a=strfind(line_1,'E');

    % extracting higher and lower temperature coefficients
    % extracting first 7 coefficient i.e high-temperature coefficients
    a1=line_1(1:a(1)+3);
    a1=str2num(a1);
    a2=line_1(a(1)+4:a(2)+3);
    a2=str2num(a2);
    a3=line_1(a(2)+4:a(3)+3);
    a3=str2num(a3);
    a4=line_1(a(3)+4:a(4)+3);
    a4=str2num(a4);
    a5=line_1(a(4)+4:a(5)+3);
    a5=str2num(a5);

    line_2=fgetl(f1);
    b=strfind(line_1,'E');
    a6=line_2(1:b(1)+3);
    a6=str2num(a6);
    a7=line_2(a(1)+4:b(2)+3);
    a7=str2num(a7);

    %Extracting second 7 coefficients -low-temperature coefficients
    a8=line_2(b(2)+4:b(3)+3);
    a8=str2num(a8);
    a9=line_2(b(3)+4:b(4)+3);
    a9=str2num(a9);
    a10=line_2(b(4)+4:b(5)+3);
    a10=str2num(a10);

    line_3=fgetl(f1);
    c=strfind(line_1,'E');

    a11=line_3(1:c(1)+3);
    a11=str2num(a11);
    a12=line_3(c(1)+4:c(2)+3);
    a12=str2num(a12);
    a13=line_3(c(2)+4:c(3)+3);
    a13=str2num(a13);
    a14=line_3(c(3)+4:c(4)+3);
    a14=str2num(a14);

    % specific heat calculation
    cp = Specificheat(a1,a2,a3,a4,a5,a8,a9,a10,a11,a12,temp,R,global_medium_temp);
    %enthalpy calculation
    H = enthalpy(a1,a2,a3,a4,a5,a6,a8,a9,a10,a11,a12,a13,temp,R,global_medium_temp);
    %entropy calculation
    S = entropy_calc(a1,a2,a3,a4,a5,a7,a8,a9,a10,a11,a12,a14,R,temp,global_medium_temp);
    %calculation molecular weight of species
    Molecularweight(i)= Molecular_weight(species_sp);

    %plotting(cp,H,S,temp,species_sp)and saving as a folder
    current_folder=pwd;
    cd 'C:\Users\Admin\Desktop\nasa_file'; %changing current folder to nasa_file
    mkdir(species_sp);
    cd(species_sp);

    %plot 1, specific heat (cp) vs temperature range(temp)
    figure(1)
    plot(temp,cp,'linewidth',4,'color','B');
    xlabel('TEMPERATURE in K');
    ylabel('SPECIFIC HEAT in kJ');
    title(sprintf('Varying Specific Heat with Temperature range of %s',species_sp));
    grid on
    saveas(figure(1),'Specific Heat','jpg');

    %plot 2, entalpy (H) vs temperature range(temp)
    figure(2)
    plot(temp,H,'linewidth',4,'color','r');
    xlabel('TEMPERATURE in K');
    ylabel('ENTHALPY in kJ/mol');
    title(sprintf('Varying Enthalpy with Temperature range of %s',species_sp));
    grid on
    saveas(figure(2),'Entalpy','jpg');

    %plot 3, entropy(s) vs temperature range(temp)
    figure(3)
    plot(temp,S,'linewidth',4,'color','G');
    xlabel('TEMPERATURE in K');
    ylabel('ENTROPY in kJ/mol-K');
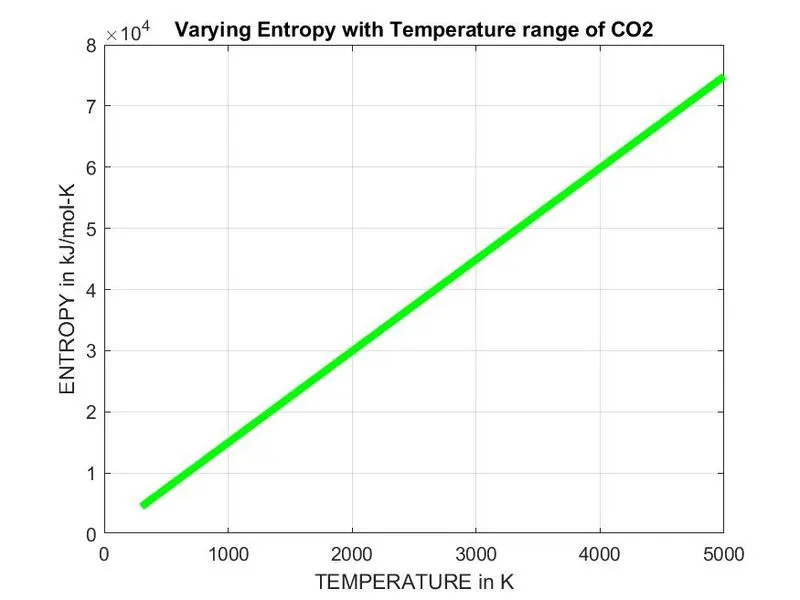
    title(sprintf('Varying Entropy with Temperature range of %s',species_sp));
    grid on
    saveas(figure(3),'Entropy','jpg');

    cd(current_folder);% returns to current folder
    end
code explanation:
1.Initially clear all contents like variables, vlaues and contents in the workspace and command window by using following command.
clear all: clear all the variables in the workspace
close all:deletes all figure including hose with hidden handles.
clc: clear command window
2. creating new folder in the desktop using mkdir command with syntex mkdir('location address\file name)
3. opening and reading the 'THERMO.dat' file using fopen, then store in the variable f1. The data from the file is read line by line using fgetl command which reads line from file, removing newline characters and stores in the variable gt.
4. optain the different temperature range by using the strsplit command which splits the charactor by differentiating the space and strings, then the low global temperature, medium global temperature and high global temperature are declared by 1st, 2nd and 3rd respectively and converting to numbers from string data using str2num command. The syntex t{2} represents the array name with position.
5. After declaring the low,medium and higher temp values the number of temperature range is declared by using linspace command by splitting equally in to 500 values.
6. Declaring universal gas constant R =8.314 J/(mol-K)
7. The first three lines of the data file given is not used so they are skipped using for loop by itterating three times.
8. Then use for loop to prase data is loop is iterated 53 time because 53 elements are given in the data file.
9. first the file is read by fget command and stored in gt variable then it is splitted in to string with strsplit command.
10. The element name is stored in species_sp which is the first string represented first element of matrix A .
11. Each coefficient values are found using the strfind command since all the values contain exponent value 0 and contain string 'E' in each values. So the finding the placement of the string E we can get the coefficient values.
12. the variable line_1 contain the first line value after the element name line. the variable a is used for the first 7 coeffecient, b for next 2 values and c for next 7 values.
13. then using the specific heat function, Entalpy function and Entropy function the values are given to the function where the calculation takes place with the below formulas
14. then the molecular weight is calculate and displayed using molecular_weight function.
15. the current folder path value is store in variable current_folder using pwd command. Then the current folder directory is changed to nasa_file using cd command.
16. then new folders inside the folder nasa_file is created with the element name using mkdir command and setting it as current folder by using cd command.
17. the figure(1), figure(2) and figure(3) is used to plot the specific heat, entalpy and entropy respectively using plot command. The xlabel and ylabel commands are used to name the axis. The title command and sprintf command is used to mention the tile in string format. The saveas command is used to save the plot as image in jpg format.
18.after plotting and saving the plots as images the cd command is used to return to the original folder. this loop continues 53 time where all the elements plots are saved.
OUTPUT:
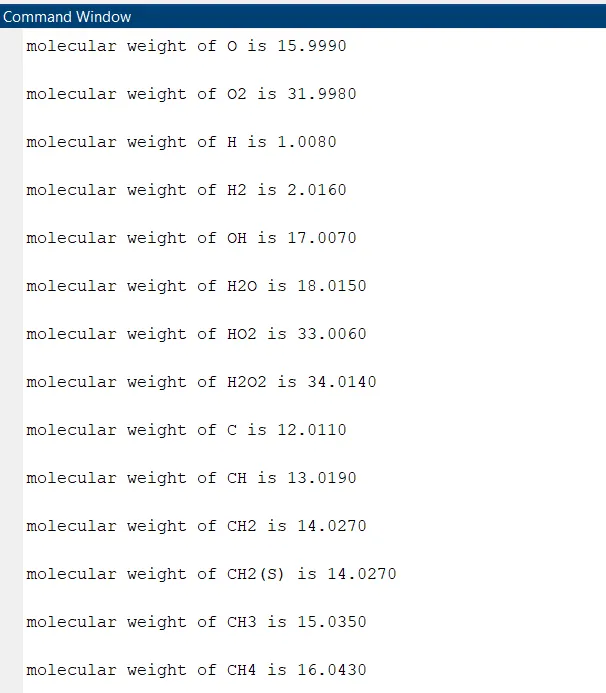
output in the command window:
molecular weight of O is 15.9990
molecular weight of O2 is 31.9980
molecular weight of H is 1.0080
molecular weight of H2 is 2.0160
molecular weight of OH is 17.0070
molecular weight of H2O is 18.0150
molecular weight of HO2 is 33.0060
molecular weight of H2O2 is 34.0140
molecular weight of C is 12.0110
molecular weight of CH is 13.0190
molecular weight of CH2 is 14.0270
molecular weight of CH2(S) is 14.0270
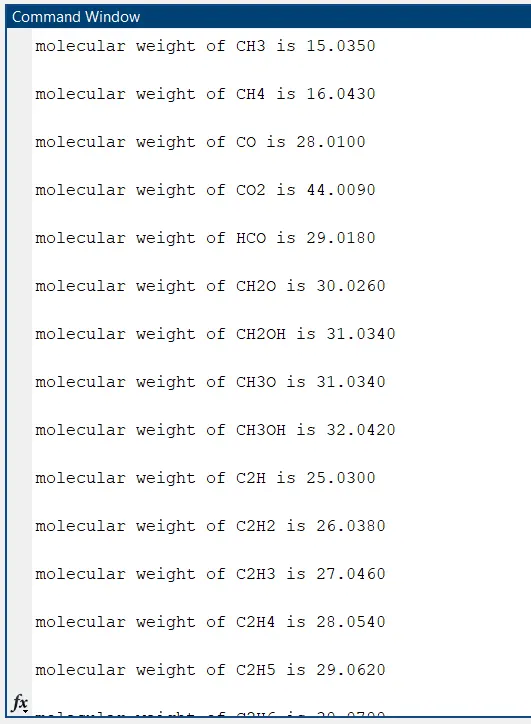
molecular weight of CH3 is 15.0350
molecular weight of CH4 is 16.0430
molecular weight of CO is 28.0100
molecular weight of CO2 is 44.0090
molecular weight of HCO is 29.0180
molecular weight of CH2O is 30.0260
molecular weight of CH2OH is 31.0340
molecular weight of CH3O is 31.0340
molecular weight of CH3OH is 32.0420
molecular weight of C2H is 25.0300
molecular weight of C2H2 is 26.0380
molecular weight of C2H3 is 27.0460
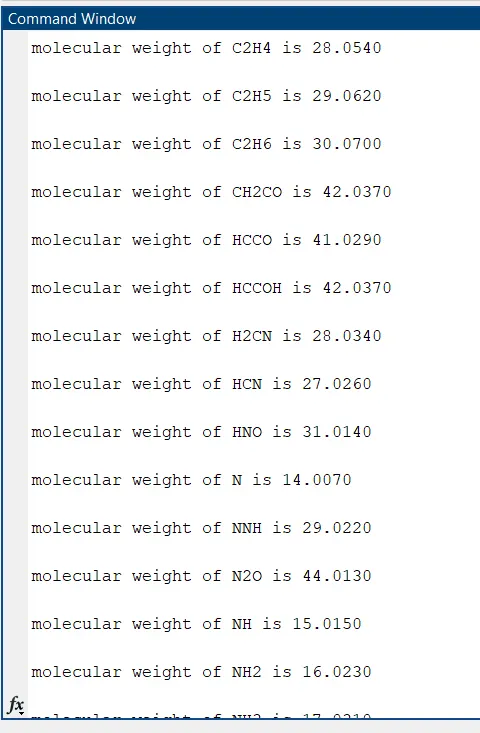
molecular weight of C2H4 is 28.0540
molecular weight of C2H5 is 29.0620
molecular weight of C2H6 is 30.0700
molecular weight of CH2CO is 42.0370
molecular weight of HCCO is 41.0290
molecular weight of HCCOH is 42.0370
molecular weight of H2CN is 28.0340
molecular weight of HCN is 27.0260
molecular weight of HNO is 31.0140
molecular weight of N is 14.0070
molecular weight of NNH is 29.0220
molecular weight of N2O is 44.0130
molecular weight of NH is 15.0150
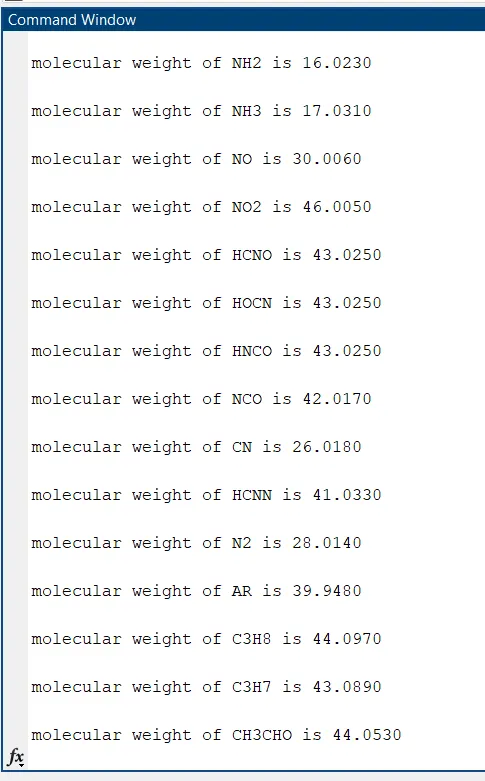
molecular weight of NH2 is 16.0230
molecular weight of NH3 is 17.0310
molecular weight of NO is 30.0060
molecular weight of NO2 is 46.0050
molecular weight of HCNO is 43.0250
molecular weight of HOCN is 43.0250
molecular weight of HNCO is 43.0250
molecular weight of NCO is 42.0170
molecular weight of CN is 26.0180
molecular weight of HCNN is 41.0330
molecular weight of N2 is 28.0140
molecular weight of AR is 39.9480
molecular weight of C3H8 is 44.0970
molecular weight of C3H7 is 43.0890
molecular weight of CH3CHO is 44.0530
molecular weight of CH2CHO is 43.0450

plots for O2 species:
plots for N2 species:
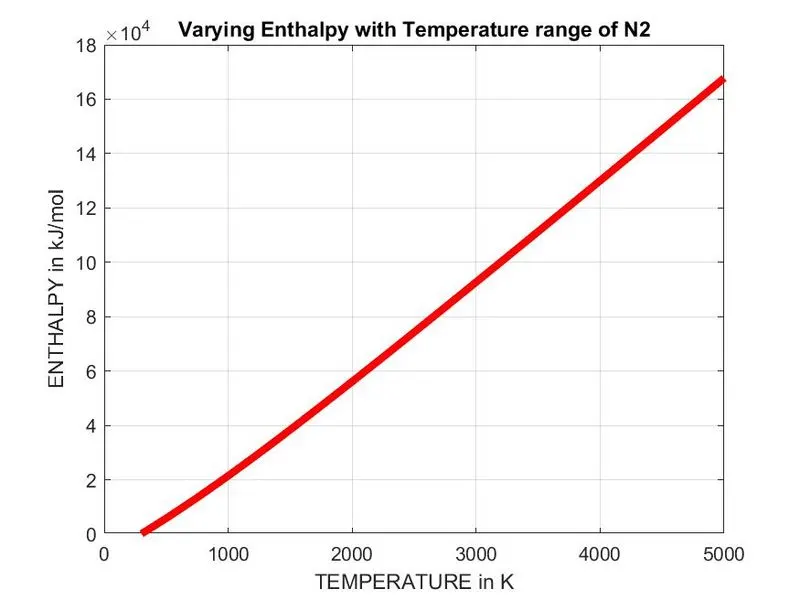
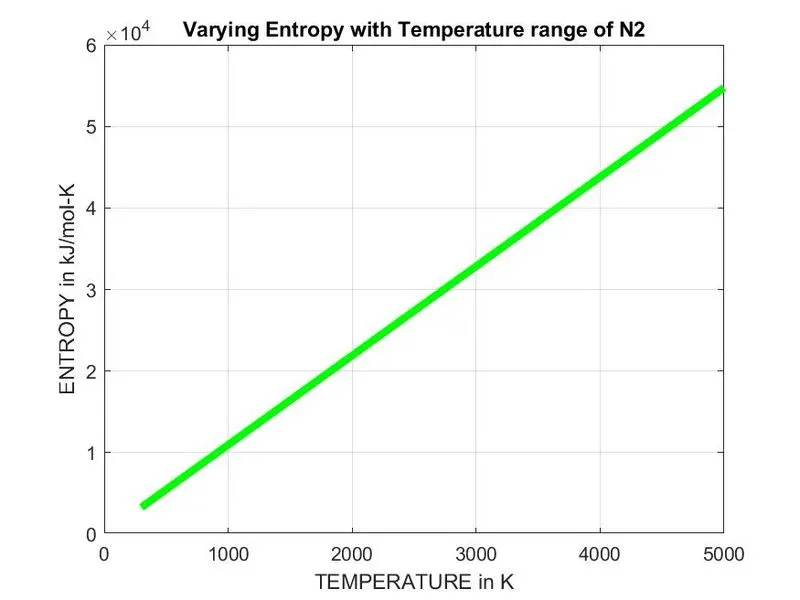
plots for CO2 species:
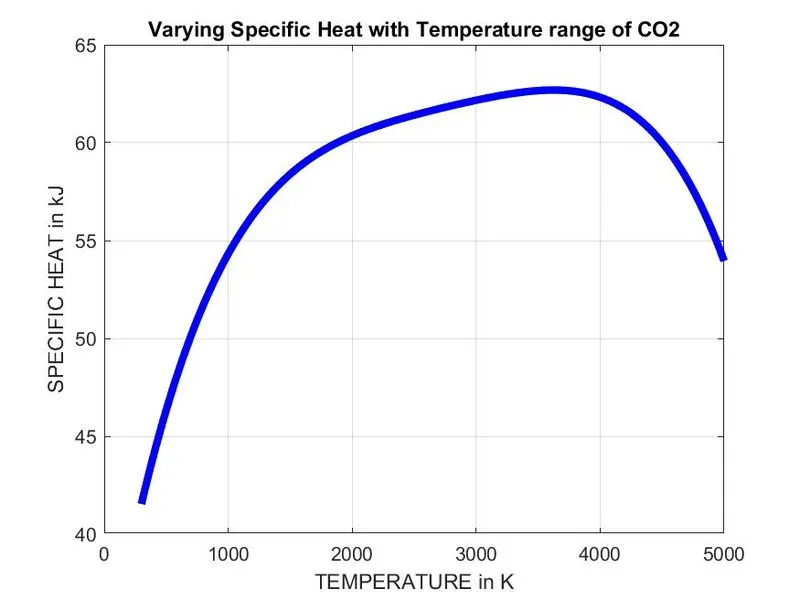
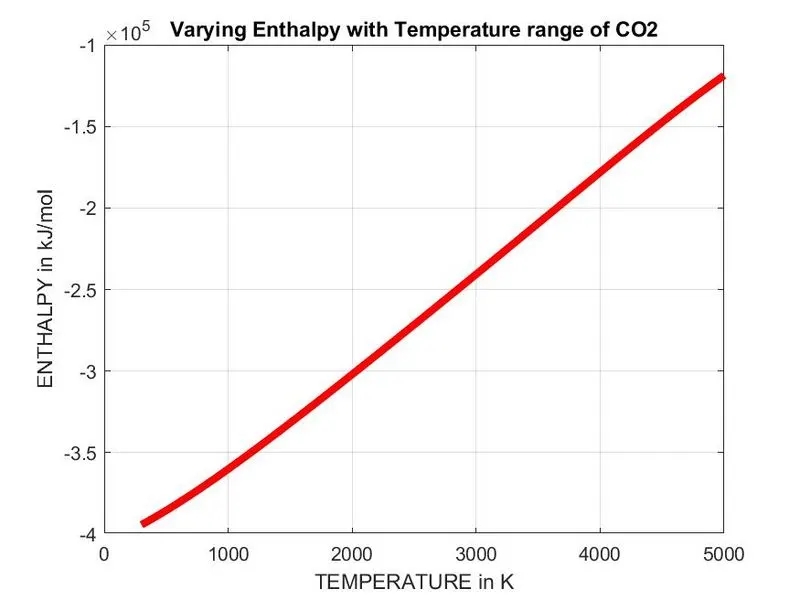
Errors faced while programming:
Errors 1: After plotting and saving the images the current folder is set to nasa_file folder.
this error is reduced by redirecting it current folder using cd command which is at the end of the for loop.
LINK TO VIEW THE FOLDER
https://drive.google.com/drive/folders/1XljSQAlFYTM8jD4t28IooQmqvrfsPVrZ?usp=sharing
Reference links:
1.https://byjus.com/atomic-mass-formula/
2. matlab help search
3.https://scilearn.sydney.edu.au/fychemistry/iChem/molar_mass.shtml