Project 1 - Parsing NASA thermodynamic data
OBJECTIVE
1. To Write a function that extracts the 14 co-efficients and calculates the enthalpy, entropy and specific heats for all the species in the data file.
2. To Calculate the molecular weight of each species.
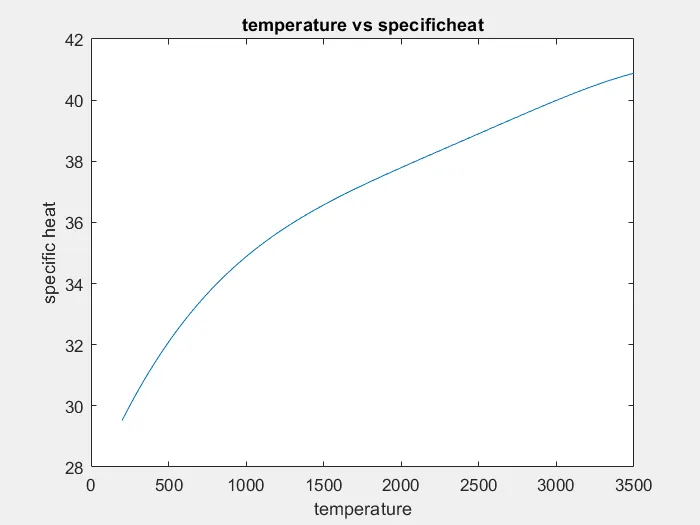
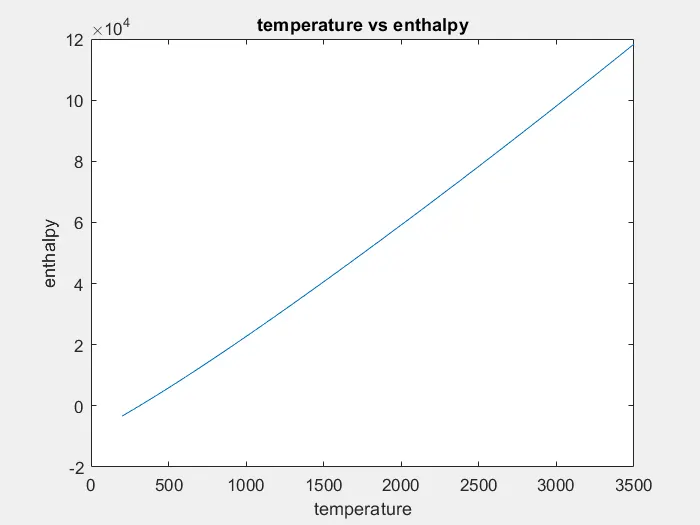
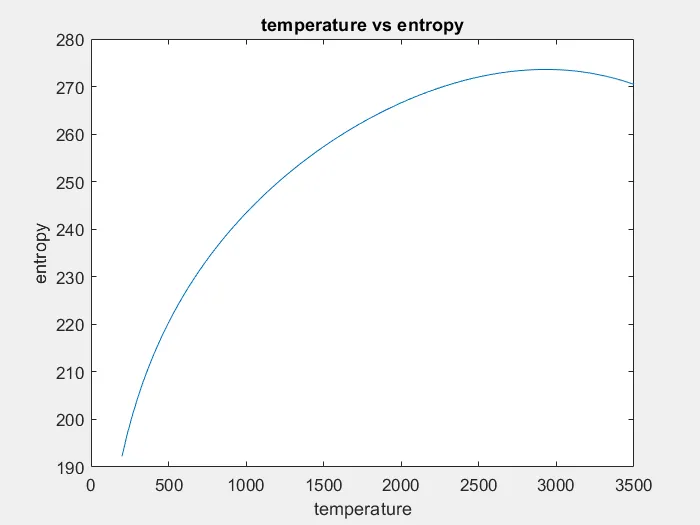
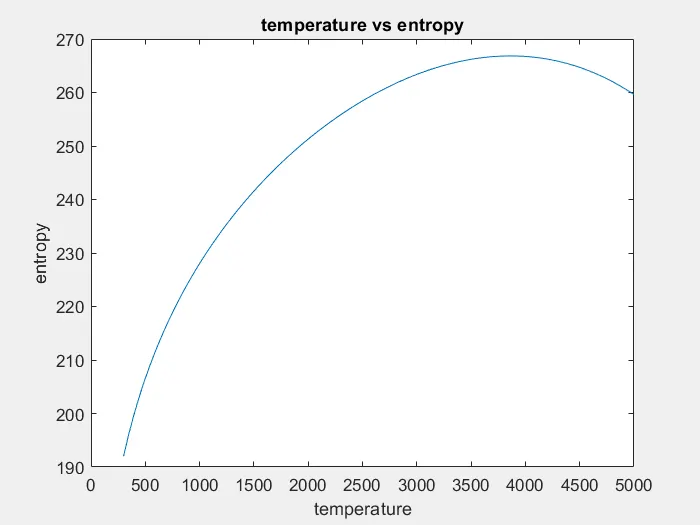
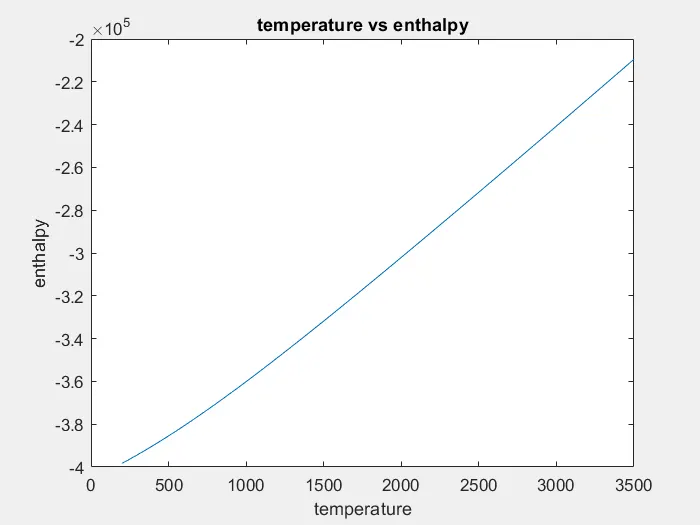
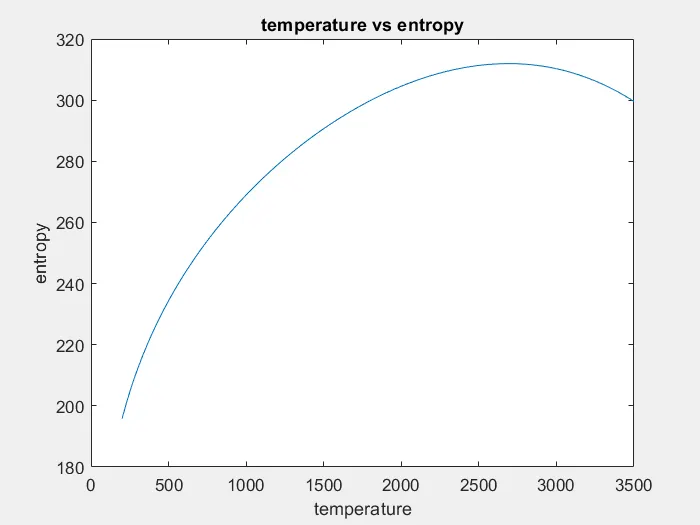
3. To Plot the Cp, Enthalpy and Entropy for the local temperature range (low temperature : high temperature) specific for each species.
FILE PARSING
File parsing is done to read a set of informations and store in a memory file so that whenever when the data is is need to modulate or perform certain operations for the program we can refer it by recognizing the data memory where it has been stored.
File parsing
FORMULAS FOR THE THERMODYNAMIC STUDY OF CHEMICAL SPECIES
GIVEN:
SPECIFIC HEAT;
PROGRAM;
clear all
close all
clc

% opening the file and reading
f1 = fopen("thermo.txt.dat",'r');

% reading header information
fgetl(f1);

% global temperature line
temp_line= fgetl(f1);
a = strsplit(temp_line,' ');

global_low_temp = str2double(a{2});
global_mid_temp = str2double(a{3});
global_high_temp = str2double(a{4});

% avoid first 3 lines
fgetl(f1);
fgetl(f1);
fgetl(f1);

% reading species coefficents
for i =1:53
    temp_line2= fgetl(f1);
    s = strsplit(temp_line2,' ');
    species_name=s{1};
    D = findstr(temp_line2,'G');
    temp_values = temp_line2 (D+4:length(temp_line2));
    B = strsplit(temp_values,' ');

    local_low_temp = str2double(B{1});
    local_mid_temp = str2double(B{3});
    local_high_temp = str2double(B{2});

    %line 1
    t_line = fgetl(f1);
    b = findstr(t_line,'E');
    % 1 coefficient
    b1 = t_line(1:b(1)+3);
    b1 = str2double(b1);
    % coefficient 2
    b2 = t_line(b(1)+4:b(2)+3);
    b2 =str2double(b2);
    % coefficient 3
    b3 = t_line(b(2)+4:b(3)+3);
    b3 =str2double(b3);
    % coefficient 4
    b4 = t_line(b(3)+4:b(4)+3);
    b4 =str2double(b4);
    % coefficient 5
    b5 = t_line(b(4)+4:b(5)+3);
    b5 =str2double(b5);

    %line 2
    line_2=fgetl(f1);

    %  coefficient 6
    b6 = line_2(1:b(1)+3);
    b6 = str2double(b6);
    % coefficient 7
    b7 = line_2(b(1)+4:b(2)+3);
    b7 =str2double(b7);
    % coefficient 8
    b8 = t_line(b(2)+4:b(3)+3);
    b8 =str2double(b8);
    % coefficient 9
    b9 = line_2(b(3)+4:b(4)+3);
    b9 =str2double(b9);
    % coefficient 5
    b10 = line_2(b(4)+4:b(5)+3);
    b10 =str2double(b10);

    %line 3
    line_3=fgetl(f1);

    %  coefficient 11
    b11 = line_3(1:b(1)+3);
    b11 = str2double(b11);
    % coefficient 12
    b12 = line_3(b(1)+4:b(2)+3);
    b12 =str2double(b12);
    % coefficient 13
    b13 = line_3(b(2)+4:b(3)+3);
    b13 =str2double(b13);
    % coefficient 13
    b14 = line_3(b(3)+4:b(4)+3);
    b14 =str2double(b14);

    %universal gas constant
    R = 8.314;

    t =linspace(local_low_temp,local_high_temp,100);

    % specific heat
    [c_p] =specific_heat(b1,b2,b3,b4,b5,b6,b7,b8,b9,b10,b11,b12,b13,b14,local_low_temp,local_mid_temp,local_high_temp,R,t);

    %senthalpy
    [H] = enthalpy(b1,b2,b3,b4,b5,b6,b7,b8,b9,b10,b11,b12,b13,b14,local_low_temp,local_mid_temp,local_high_temp,R,t);

    %entropy
    [S] = entropy(b1,b2,b3,b4,b5,b6,b7,b8,b9,b10,b11,b12,b13,b14,local_low_temp,local_mid_temp,local_high_temp,R,t);

 cd('E:\species')
    %creating a folder
        mkdir(species_name);
        cd(species_name);


    %plotting
    %temp vs c_p

    figure(1)
    plot(t,c_p)
    xlabel('temperature')
    ylabel('specific heat')
    title('temperature vs specificheat')
    image = getframe(gcf);
    imwrite(image.cdata,'t vs cp.png')
    saveas(1,'specific_heat','jpg')

    %temp  vs H
    figure(2)
    plot(t,H)
    xlabel('temperature')
    ylabel('enthalpy')
    title('temperature vs enthalpy')
    image = getframe(gcf);
    imwrite(image.cdata,'t vs H.png')
    saveas(2,'enthalpy','jpg')

    %temp vs S
    figure(3)
    plot(t,S)
    xlabel('temperature')
    ylabel('entropy')
    title('temperature vs entropy')
    image = getframe(gcf);
    imwrite(image.cdata,'t vs S.png')
    saveas(3,'entropy','jpg')

    cd('D:\PGHEV\SOFTWARES\R2022a')


    %molecular weight
    [mol_wt]=molecular_wt(species_name);
    N=sprintf('%s mol_wt =%f',species_name,mol_wt);
    disp(N)
end
FUNCTIONS
MOLECULAR WEIGHT;
% molecular weight function
function [mol_wt]= molecular_wt(species_name)

atomic_weight = [15.999,1.008,12.011,14.007,39.948];
compounds=['O','H','C','N','A'];

mol_wt=0;
for i = 1:length(species_name)
    for j =1:length(compounds)
        if strcmp(species_name(i),compounds(j))
            mol_wt=mol_wt+atomic_weight(j);
            k=j;
        end
    end

    % if the compounds of the species are poly attached
    d= str2double(species_name);
    if (d>1)
        mol_wt = mol_wt + atomic_weight(k)*(d-1);
    end
end
SPECIFIC HEAT;
% function for specific heat
function [c_p] = specific_heat(b1,b2,b3,b4,b5,b6,b7,b8,b9,b10,b11,b12,b13,b14,local_low_temp,local_mid_temp,local_high_temp,R,t)
if (t<= local_mid_temp)
    [c_p] = (b8+(b9.*t)+(b10.*(t.^2))+(b11.*(t.^3))+(b12.*(t.^4)))*R;

else
    [c_p] =  (b1+(b2.*t)+(b3.*(t.^2))+(b4.*(t.^3))+(b5.*(t.^4)))*R;
end
ENTHALPY;
% function enthalpy
function [H] = enthalpy(b1,b2,b3,b4,b5,b6,b7,b8,b9,b10,b11,b12,b13,b14,local_low_temp,local_mid_temp,local_high_temp,R,t)
if (t<= local_mid_temp)
    [H] = (b8+((b9.*t)/2)+((b10.*(t.^2))/3)+((b11.*(t.^3))/4)+((b12.*(t.^4))/5)+(b13./t)).*t*R;
else
    [H] = (b1+((b2.*t)/2)+((b3.*(t.^2))/3)+((b4.*(t.^3))/4)+((b5.*(t.^4))/5)+(b6./t)).*t*R;
end
ENTROPY;
% function for entropy
function [S] = entropy(b1,b2,b3,b4,b5,b6,b7,b8,b9,b10,b11,b12,b13,b14,local_low_temp,local_mid_temp,local_high_temp,R,t)
if (t<= local_mid_temp)
    [S] = ((b8.*log(t))+(b9.*t)+((b10.*(t.^2))/2)+((b11.*(t.^3))/3)+(b12.*(t.^4))+b14)*R;
else
   [S] = ((b1.*log(t))+(b2.*t)+((b3.*(t.^2))/2)+((b4.*(t.^3))/3)+(b5.*(t.^4))+b7)*R;
end
EXPLANATION;
First the data given by the NASA thermodynamic data files have read and directed to open it and the global temperature ranges has been identified
Here the file has been directed to point it has f1
After reading the header informations local temperatures have identified
The low temperature coefficients and high temperatures coefficients are identified with variable b numbering to the correspondant coefficients. First 7 are high temperature coefficients and the next 7 is low tempertaure are low temperature coeffients.
- Plotting is done between temperatures and the thermodynamic entities for all the species
- Molecular weight of the species have been found by using the formula from function
The thermodynamic entities are pogrammed in function form and given inside the FOR loop of the program so that the program can allot the function and call it for the corresponding species.
COMMANDS
fgetl - To derive(get) the line from the file data
strfind - finds the string position when specified
str2double - converts the string to number scalar form
strsplit - splits the string at specified position of the line
mkdir - creates a folder at given name
cd - it changes the folder to a new given folder name
PLOTS
- O2
- N2
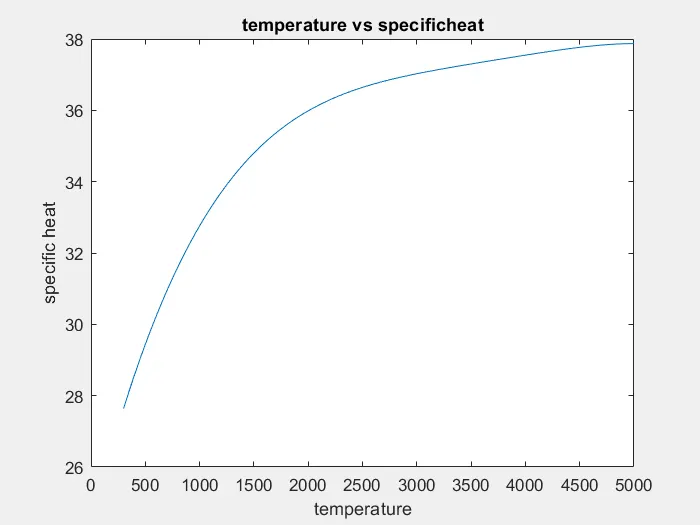
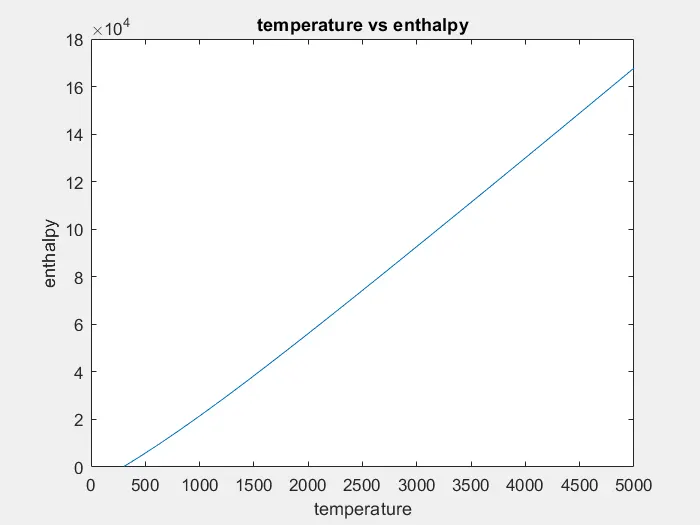
- CO2
SCREENSHOTS;
WORKSPACE
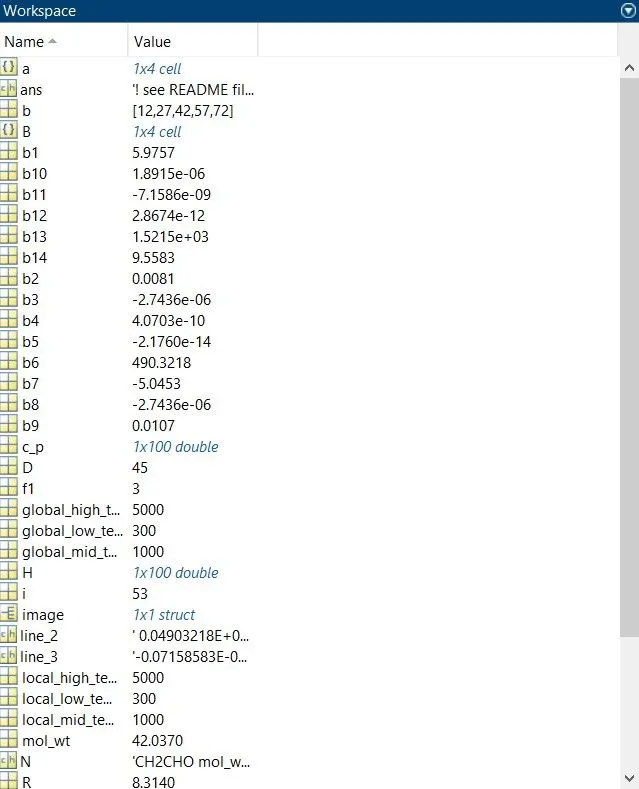
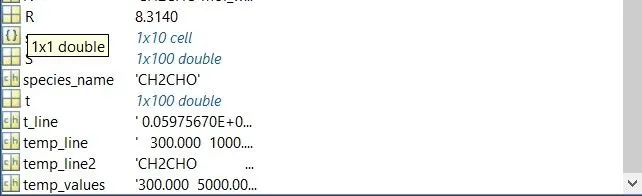
COMMAND WINDOW
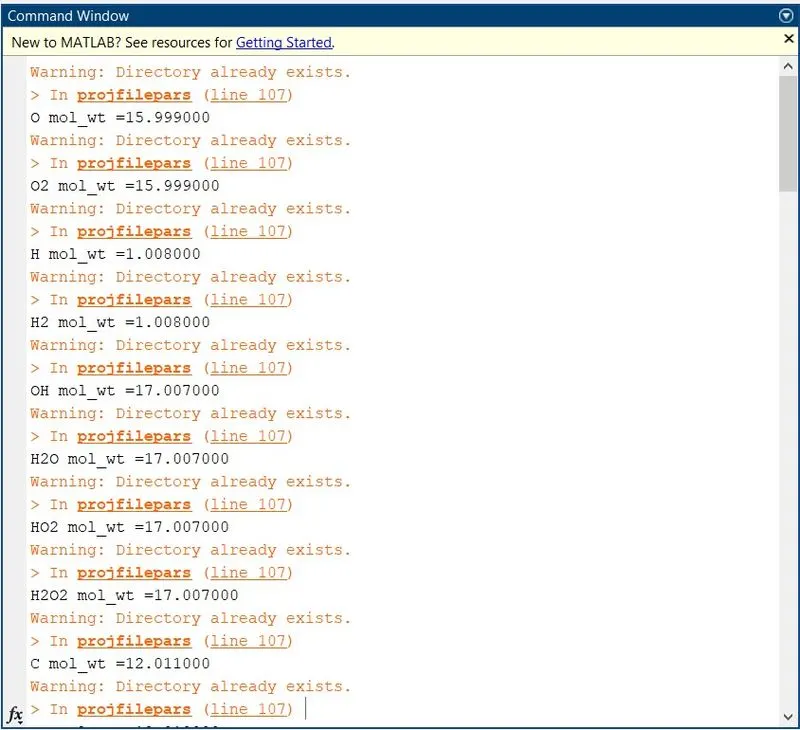
SPECIES

RESULT
- File parsing is done and the thermodynamic study between temperature and specific heat, enthalpy, entropy is plotted
- Graph of O2,N2,CO2 have shown
- molecular weight of the species have found
- screen shots have shown .