Project 1 - Parsing NASA thermodynamic data
AIM
- To write a function that extracts the 14 co-efficients and calculates the enthalpy, entropy and specific heats for all the species in the data file.
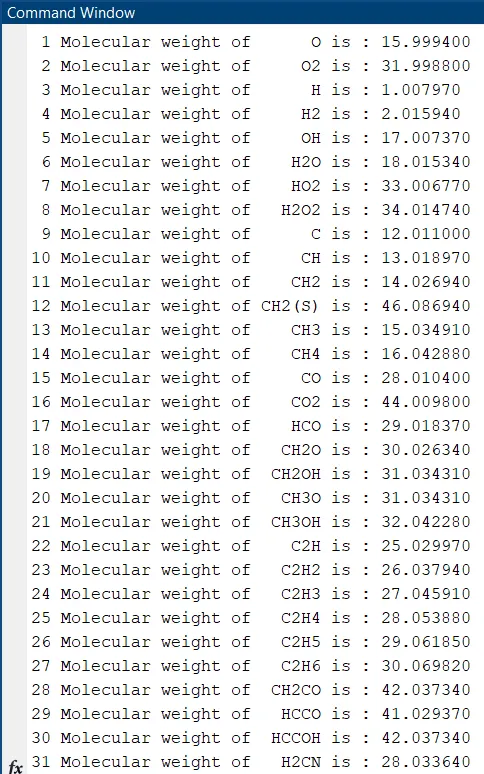
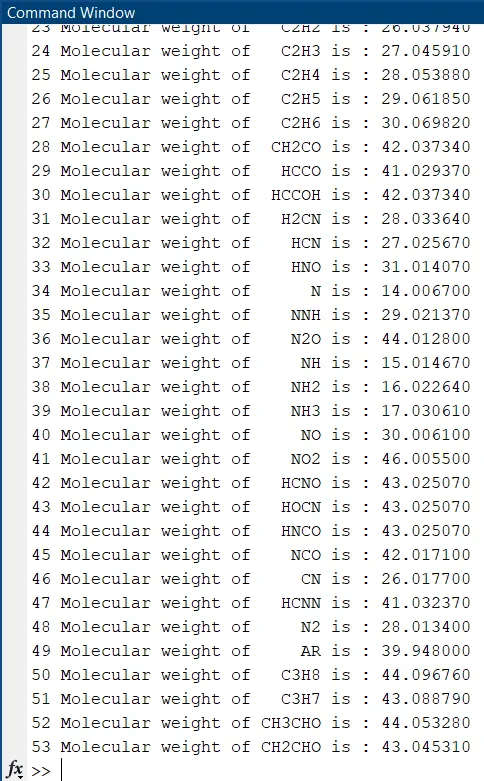
- Calculate the molecular weight of each species and display it in the command window.
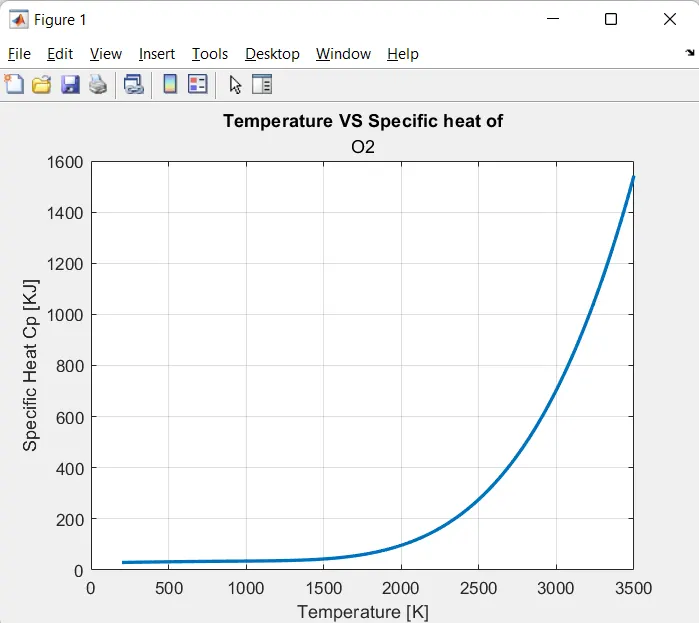
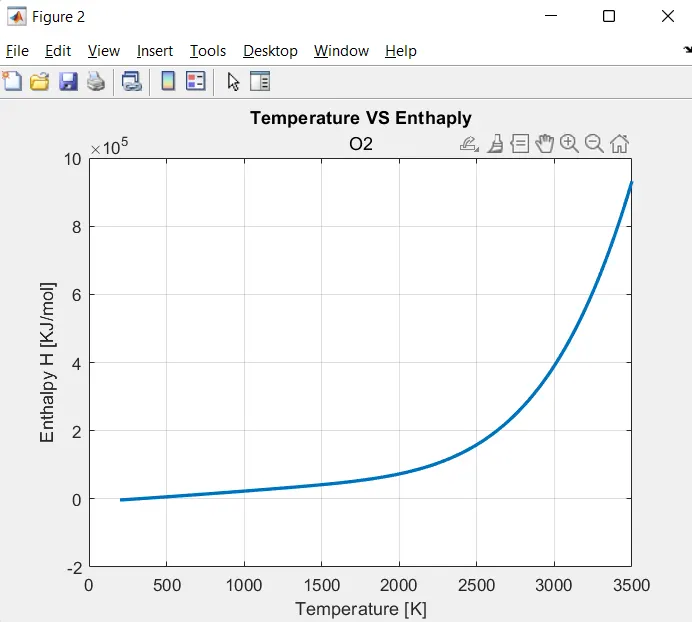
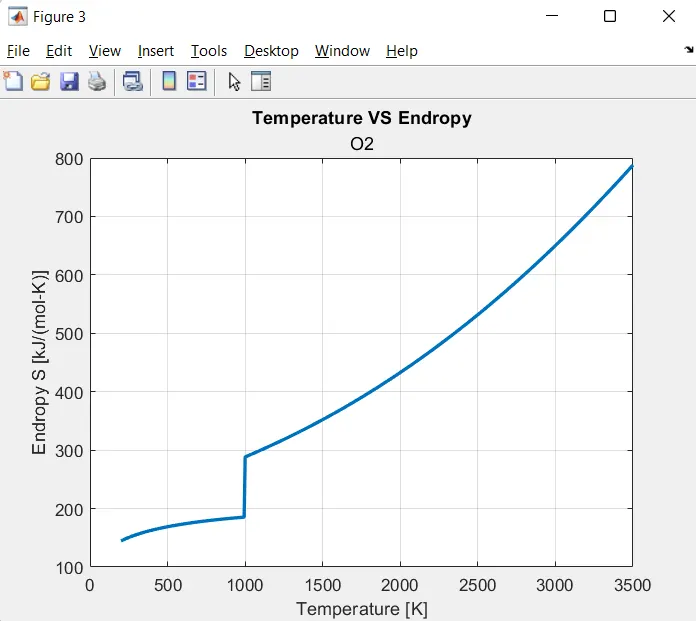
- Plot the Cp, Enthalpy and Entropy for the local temperature range for each species.
- Automatically save the plots as images with appropriate names and dump them in separate folders for each species with suitable name.
Theory
1) Parsing
Parsing a file means reading in a data stream of some sort and building an in memory model of the semantic content of that data. In otherwords, file parsing refers to how information can be read from a particular text file or any type of file and how that information can be used to in a computer program.
2) Specific Heat Capacity,Cp(kJ/kg-K)
The specific heat capacity is defined as the quantity of heat (J) absorbed per unit mass (kg) of the material when its temperature increases 1 K (or 1 °C), and its units are J/(kg K) or J/(kg °C).

where, Cp - Specific heat capacity [kJ/kg-K]
R - Univerasl gas constant 8.314
T - Temperature [K]
a1,a2,a3,a4,a5 - Temperature cofficients
3) Enthalpy,H(kJ)
Enthalpy is the measurement of energy in a thermodynamic system. The quantity of enthalpy equals to the total content of heat of a system, equivalent to the system's internal energy plus the product of volume and pressure.

Where, H -Enthaply [KJ]
R - Univerasl gas constant 8.314
T - Temperature [K]
a1,a2,a3,a4,a5,a6 - Temperature cofficients
5) Entropy,S(KJ/K)
Entropy is the measure of a systems thermal energy per unit temperature that is unavailable for doing useful work. Because work is obtained from ordered molecular motion, the amount of entropy is also a measure of the molecular disorder, or randomness, of a system.

Where, S - Entropy
R - Univerasl gas constant 8.314
T - Temperature [K]
a1,a2,a3,a4,a5,a7- Temperature cofficients
Program code
%parsing_NASA_data
close all
clear all
clc

f1 = fopen('THERMO.dat');
R = 8.314;
% finding total number of species in data file
i=1;
tline = fgetl(f1);
while strcmp(tline,'END')==0
    tline = fgetl(f1);
    i=i+1;
end
total_species = (i-6)/4;
frewind(f1);

Heading = fgetl(f1);

% Extractng Global temperature value
Globaltemp = fgetl(f1);
temp_vary = strsplit(Globaltemp,' ');
Global_low_temp = str2double(temp_vary{2});
Global_mid_temp = str2double(temp_vary{3});
Global_hi_temp = str2double(temp_vary{4});


for i=1:3             % skipping lines
    tline = fgetl(f1);
end

% Extracting data of each species
for i = 1:total_species
    tline = fgetl(f1);
    firstline = strsplit(tline,' ');
    element = firstline{1};                   % extracting element name
    name{i}= element;                         % storing the element name
    local_lo_temp = str2double(firstline{end-3}); % extracting local low temp
    local_mid_temp = str2double(firstline{end-1}); % extracting local mid temp
    local_hi_temp  = str2double(firstline{end-2}); % extracting local high temp

    LTR = linspace(local_lo_temp,local_hi_temp,500);

    % extracting coefficiemts from second line
    tline = fgetl(f1);
    pos = findstr(tline,'E');
    a1 = str2double(tline(1:pos(1)+3));
    a2 = str2double(tline(pos(1)+4:pos(2)+3));
    a3 = str2double(tline(pos(2)+4:pos(3)+3));
    a4 = str2double(tline(pos(3)+4:pos(4)+3));
    a5 = str2double(tline(pos(4)+4:pos(5)+3));

    % extracting coefficient from third line
    tline = fgetl(f1);
    pos = findstr(tline,'E');
    a6 = str2double(tline(1:pos(1)+3));
    a7 = str2double(tline(pos(1)+4:pos(2)+3));
    b1 = str2double(tline(pos(2)+4:pos(3)+3));
    b2 = str2double(tline(pos(3)+4:pos(4)+3));
    b3 = str2double(tline(pos(4)+4:pos(5)+3));

    % extracting coefficients from forth line
    tline = fgetl(f1);
    pos = findstr(tline,'E');
    b4 = str2double(tline(1:pos(1)+3));
    b5 = str2double(tline(pos(1)+4:pos(2)+3));
    b6 = str2double(tline(pos(2)+4:pos(3)+3));
    b7 = str2double(tline(pos(3)+4:pos(4)+3));

    coff = [a1 a2 a3 a4 a5 a6 a7 b1 b2 b3 b4 b5 b6 b7];

    % Specific heat calculation
    cp = specific_heat(coff,local_mid_temp,LTR,R);

    % Enthalpy calculation
    H = enthalpy(coff,local_mid_temp,LTR,R);

    % Endropy calculation
    S = endropy(coff,local_mid_temp,LTR,R);

    % Molecular weight calculation
    [mw(i)] = mol_wt(element);

    fprintf('%2.0f Molecular weight of %6s is : %f\n',i,element,mw(i)) % displaying Molecular Weight in command window


    % Plotting and saving graph for Cp,H,S VS Temperature

    % Specific heat
    figure(1);
    plot(LTR,cp,'LineWidth',2);
    xlabel('Temperature [K]');
    ylabel('Specific Heat Cp [KJ]');
    title('Temperature VS Specific heat of',element);
    grid on;

    % Enthalpy
    figure(2);
    plot(LTR,H,'LineWidth',2);
    xlabel('Temperature [K]');
    ylabel('Enthalpy H [KJ/mol]');
    title('Temperature VS Enthaply',element);
    grid on;

    % Endropy
    figure(3);
    plot(LTR,S,'LineWidth',2);
    xlabel('Temperature [K]');
    ylabel('Endropy S [kJ/(mol-K)]');
    title('Temperature VS Endropy',element);
    grid on;

    % opening and saving data of each element

    current1 = pwd;         % to get current directory
    mkdir(element,'plot');  % opening new folder with species name and sub folder 'plot'
    cd(element);
    co = fopen('cofficients.txt','w'); % opening a text file 'cofficients.txt' to save the values of 14 cofficient for each species
    fprintf(co,'The cofficients of %s :',element);
    a=1;
    for k = 1:length(coff)
          fprintf(co,'\n%d  %d',a,coff(k));
          a=a+1;
    end

    fclose(co);

    data=fopen('Datafile.txt','w');  % opening a text file 'Data.txt' to save Molecular weight,specific heat,enthalpy and endropy list of each species
    fprintf(data,'Element name : %5s\n',element);
    fprintf(data,'Molecular Weight : %5.5f\n',mw(i));
    fprintf(data,'Temperature \tSpecific Heat \t Enthalpy  \t\tEndropy\n');
    for i=1:length(LTR)
        fprintf(data,'\n%9.3f \t %15.3f \t %14.3f\t %12.3f\n',LTR(i),cp(i),H(i),S(i));
        i=i+1;
    end
    fclose(data);

    cd('plot');  % opening the folder by changing the location for saving plots
    savefig(1,'Specific heat.fig');
    savefig(2,'Enthalpy.fig');
    savefig(3,'Endropy.fig');
    close all
    cd(current1);

end

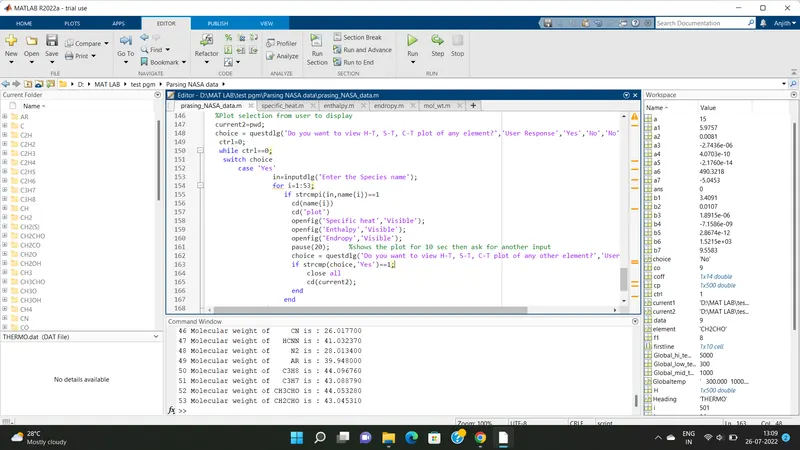
%Plot selection from user to display
current2=pwd;
choice = questdlg('Do you want to view H-T, S-T, C-T plot of any element?','User Response','Yes','No','No');
 ctrl=0;
 while ctrl==0;
  switch choice
      case 'Yes'
               in=inputdlg('Enter the Species name');
               for i=1:53;
                  if strcmpi(in,name{i})==1
                    cd(name{i})
                    cd('plot')
                    openfig('Specific heat','Visible');
                    openfig('Enthalpy','Visible');
                    openfig('Endropy','Visible');
                    pause(20);     %shows the plot for 20 sec then ask for another input
                    choice = questdlg('Do you want to view H-T, S-T, C-T plot of any other element?','User Response','Yes','No','No');
                    if strcmp(choice,'Yes')==1;
                        close all
                        cd(current2);
                    end
                  end
           end
      case 'No'
          ctrl=1;
  end
 end
cd(current2)
Program code explaination
The program begins by clearing and closing the memory using close all clear all clc functions.
The thermodynamics data file 'THERMO.dat' is opend using fopen() function.
The value of universal gas constant R is defined.
Total number of species present in the data is counted using the whie loop.The fgetl() funtion reads the line and is then assigned to variable tline. The while loop check the condition and excuite the below given code.To find the end of the data strcmp() function is used, which will compare the string tline with 'END' and gives output 1 when it matches.Then the while loop will stop excuting and the variable 'i' now contains total no of lines in the data file.
The function fgetl() will read next line when ever it is callled. so to set the line position to first line frewind() function is used.
Using fgetl() the heading and the global temperature values were extracted as string.
Each words were splited using the strsplit() command.After splitting the high, medium and low temperatures were converted to number using function str2double() .
fgetl() is again used to skip the next three lines with help of for loop.
Then using for loop the program is set to run as many time as the total number of species present in the 'THERMO.dat' file.
The high temperature cofficients and low temperature cofficients were extracted and stored into 14 variables.The cofficients were seperated by finding the position of 'E' in the string using findstr() function and then calculating the positions of cofficients.
After obtaining the cofficients all are stored into a variable coff for further use.
The the calculations of Specific heat, Enthalpy and Endropy were calculated using user derfined functions.
The user defined function specific_heat(coff,local_mid_temp,LTR,R) is called by passing the cofficients,local medium temperature,local temperature with 500 values and the univeral gas constant. The function after calculation returns the specific heat value for 500 temperature values.
Similarly the enthalpy and entropy were calculated bu calling the following functions respectively enthalpy(coff,local_mid_temp,LTR,R) & endropy(coff,local_mid_temp,LTR,R).
The file is opened in write mode using fopen() function then fprintf() is used to write the values in to the text file with the help of for loop.After writting fclose() will close the file.
Specific heat Calculation function code
%cp_function
function [cp] = specific_heat(coff,local_mid_temp,LTR,R);
 for i = 1:length(LTR)
     if LTR(i) <= local_mid_temp
        cp(i) = (coff(1)+coff(2)*LTR(i)+coff(3)*LTR(i).^2+coff(4)*LTR(i).^3+coff(5)*LTR(i).^4)*R;
     else
        cp(i) = (coff(8)+coff(9)*LTR(i)+coff(10)*LTR(i).^2+coff(11)*LTR(i).^3+coff(12)*LTR(i).^4)*R;

     end
 end
end
Program code explaination
- The function specific_heat() takes in cofficinets, local medium temperature,500 values local temperature range and the universal gas constant R value.
- Using the for loop the code is made to run for 500 times.
- For finding the low temperatre and high temperature so as to use low temperature cofficients to low temperature and high temperature cofficients to high temperature cofficients the condition statment if is used.
- When the value of temperature is less then the local medium temperature then the low temperature cofficients will be used for calculation else the high temperature cofficients will be used.
- Each value after calculation is returned to cp().
Enthalpy Calculation function code
%enthalpy
function [H] = enthalpy(coff,local_mid_temp,LTR,R);
 for i = 1:length(LTR)
     if LTR(i) <= local_mid_temp
        H(i) = (coff(1)+((coff(2)*LTR(i))/2)+((coff(3)*LTR(i).^2)/3)+((coff(4)*LTR(i).^3)/4)+((coff(5)*LTR(i).^4)/5)+(coff(6)/LTR(i)))*R*LTR(i);
     else
         H(i) = (coff(8)+((coff(9)*LTR(i))/2)+((coff(10)*LTR(i).^2)/3)+((coff(11)*LTR(i).^3)/4)+((coff(12)*LTR(i).^4)/5)+(coff(13)/LTR(i)))*R*LTR(i);

     end
 end
end
Program code explaination
- The function enthalpy() takes in cofficinets, local medium temperature,500 values local temperature range and the universal gas constant R value.
- Using the for loop the code is made to run for 500 times.
- For finding the low temperatre and high temperature so as to use low temperature cofficients to low temperature and high temperature cofficients to high temperature cofficients the condition statment if is used.
- When the value of temperature is less then the local medium temperature then the low temperature cofficients will be used for calculation else the high temperature cofficients will be used.
- Each value after calculation is returned to H().
Endropy Calculation function code
%endropy
function [S] = endropy(coff,local_mid_temp,LTR,R)
 for i = 1:length(LTR)
     if LTR(i) <= local_mid_temp
        S(i) = ((coff(1)*log(LTR(i)))+(coff(2)*log(LTR(i)))+((coff(3)*(LTR(i)).^2)/2)+((coff(4)*(LTR(i)).^2)/3)+((coff(5)*(LTR(i)).^2)/4)+coff(5))*R;
     else
        S(i) = ((coff(8)*log(LTR(i)))+(coff(9)*log(LTR(i)))+((coff(10)*(LTR(i)).^2)/2)+((coff(11)*(LTR(i)).^2)/3)+((coff(12)*(LTR(i)).^2)/4)+coff(14))*R;
     end
 end
end
Program code explaination
- The function endropy() takes in cofficinets, local medium temperature,500 values local temperature range and the universal gas constant R value.
- Using the for loop the code is made to run for 500 times.
- For finding the low temperatre and high temperature so as to use low temperature cofficients to low temperature and high temperature cofficients to high temperature cofficients the condition statment if is used.
- When the value of temperature is less then the local medium temperature then the low temperature cofficients will be used for calculation else the high temperature cofficients will be used.
- Each value after calculation is returned to S().
Molecular Weight Calculation function code
%molecular weight calculation
function [mw] = mol_wt(element);

  ele={'H','O','C','A','N','S'};
  Atm_wt=[1.00797 15.9994 12.011 39.948 14.0067 32.06];
  mw = 0;
  a=0;
  for i = 1:length(element) ;
      for j = 1:length(ele);
          if strcmp(element(i),ele(j))==1;
              mw = mw+Atm_wt(j);
              a=j;
          end

       end

       b=str2double(element(i));
       if b>1
           mw=mw+Atm_wt(a)*(b-1);
       end
  end
end
Program code explaination
- The functin mol_wt() takes the species name as input.
- In the function an arry of string ele{} is defined which contins the each elements with which the species are made of.
- Corresponding atomic withe is also defined with the name Atm_wt.
- Using nested for loop and if condition each element in the species is extracted along with the help of strcmp().
- When the first element of the species is matched with the first element defined inthe ele {}, then molecular weight from the array Atm_wt() is added. if it dos'nt match then the inner for loop iterates and check for next string in the ele{} array.
- When a number comes then the functions comes out of inner for loop and then the string will be converted to number using str2double() function and stored into variable b.
- After that the number is checked wheather is greater then 1 only then the number (b-1) is multiplied with atomic weight and added to variable mw.
- Hence the output will be in mw.
OUTPUT
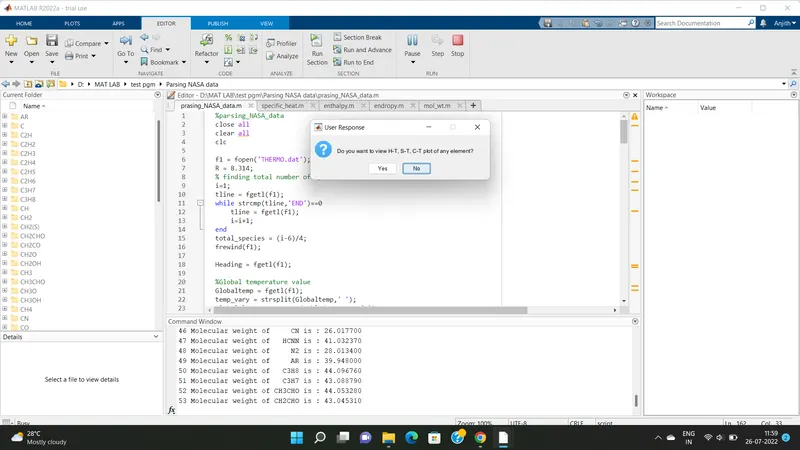
After running the code Program asks for user input
a) fig - 1 : Giving input 'Yes' for visualising the plot
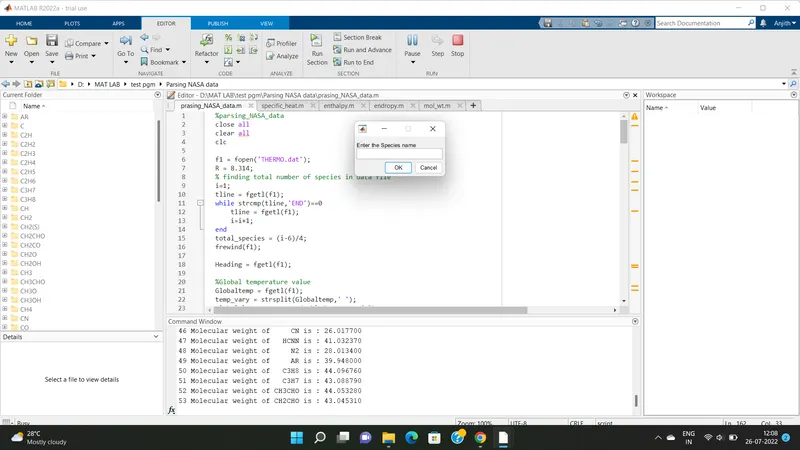
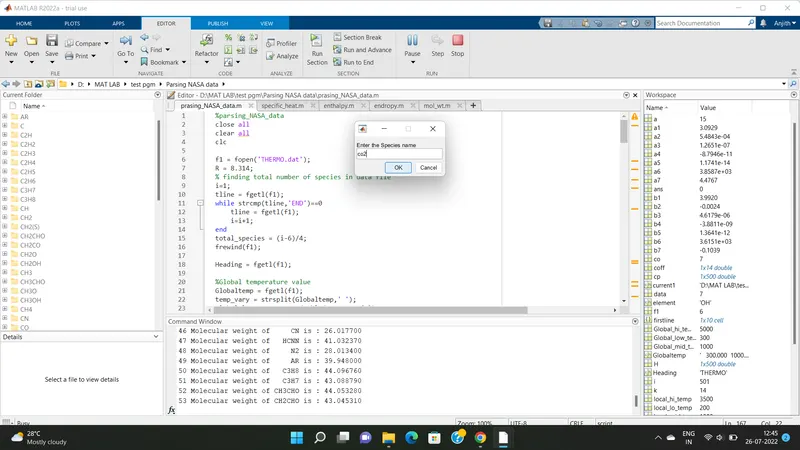
a) fig - 2 : Asking User to enter the species name for getting plots
a) fig - 3 : Plot of 'O2' as per requested by user and asking wheather user want to see another plot
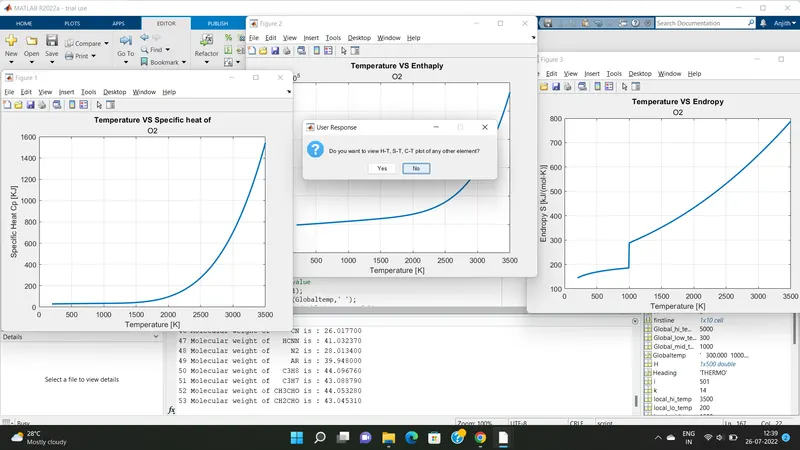
- Asking user input for displaying another species plot
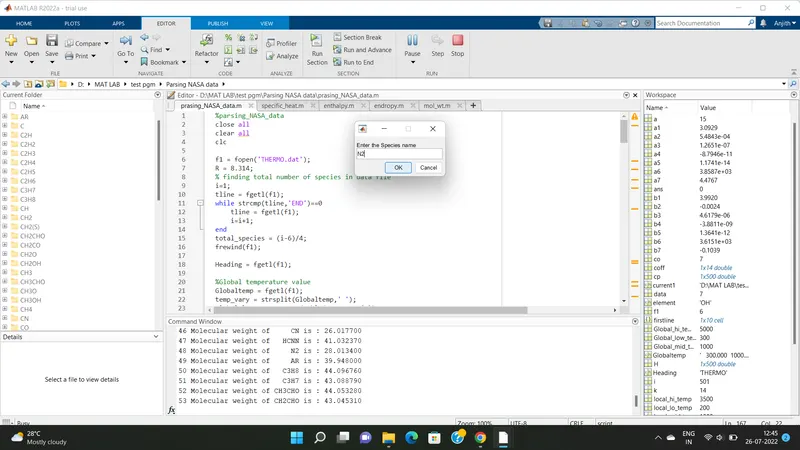
a) fig - 4 : Plot of 'N2' as per requested by user and asking wheather user want to see another plot
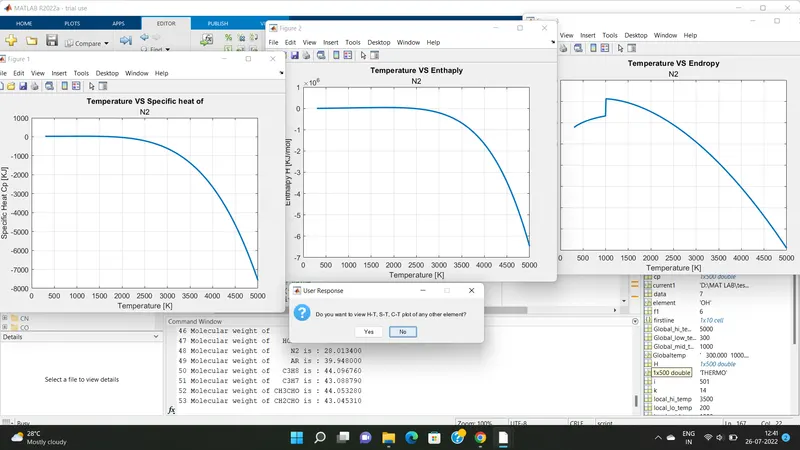
- Asking user input for displaying another species plot
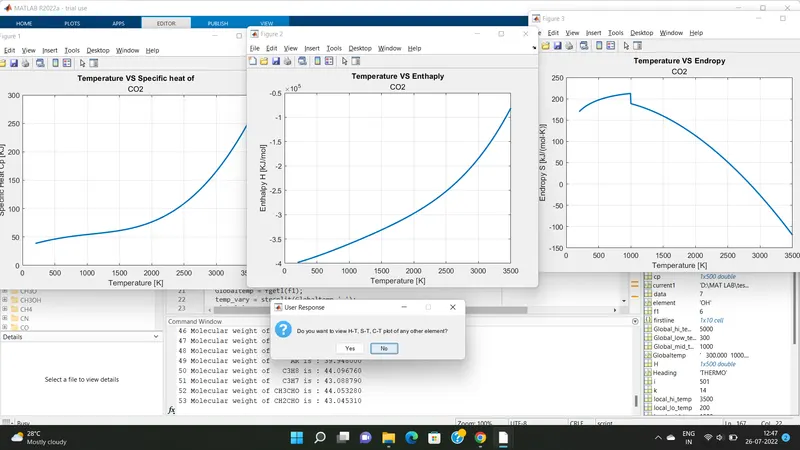
a) fig - 5 : Plot of 'Co2' as per requested by user and asking wheather user want to see another plot
a) fig - 6 : User inputs 'No' and plots redy for study
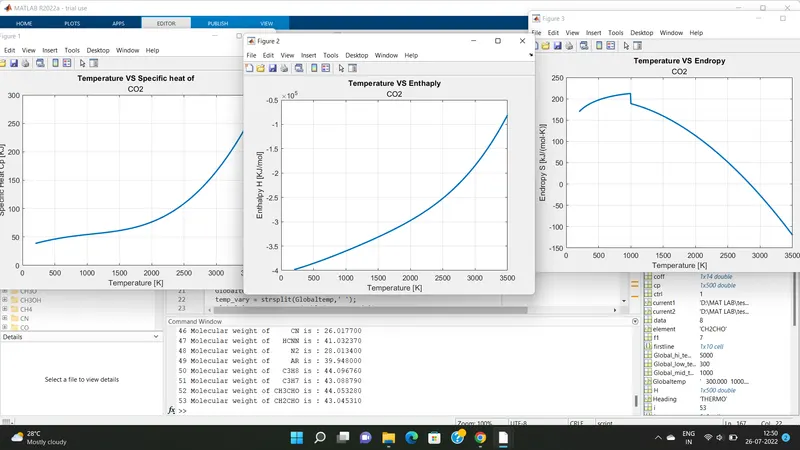
b . fig - 6 : User inputs 'No' program ends
Plots of species
- Specific heat, Enthalpy & Endropy plots of O2
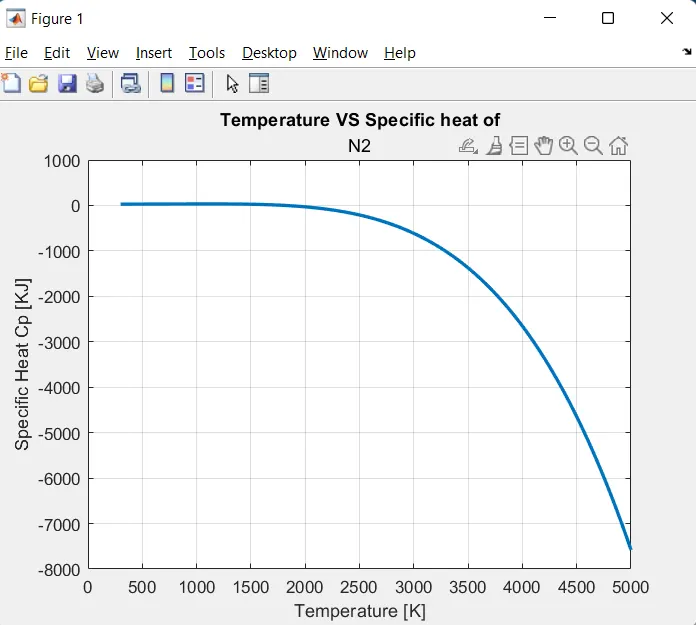
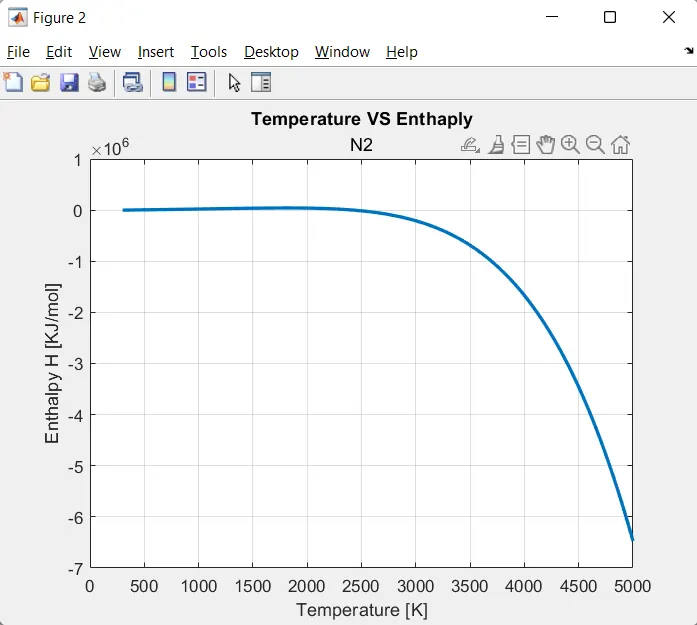
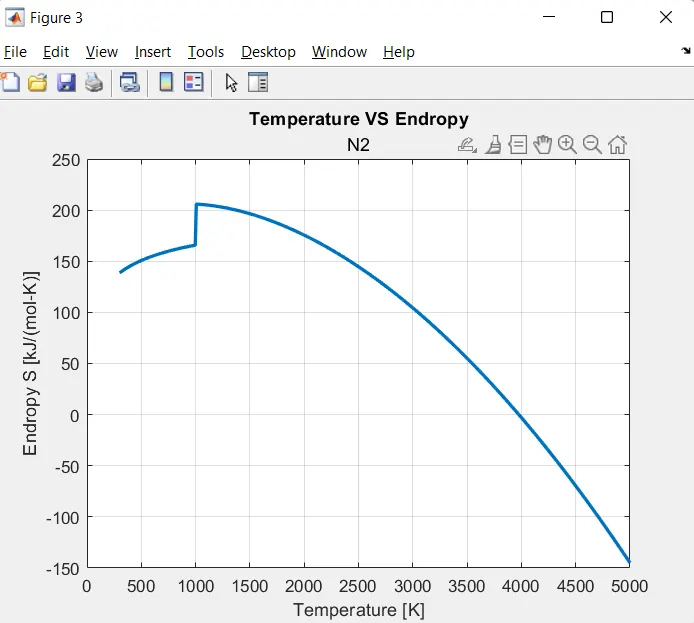
- Specific heat,Entalpy and Endropy plots of N2
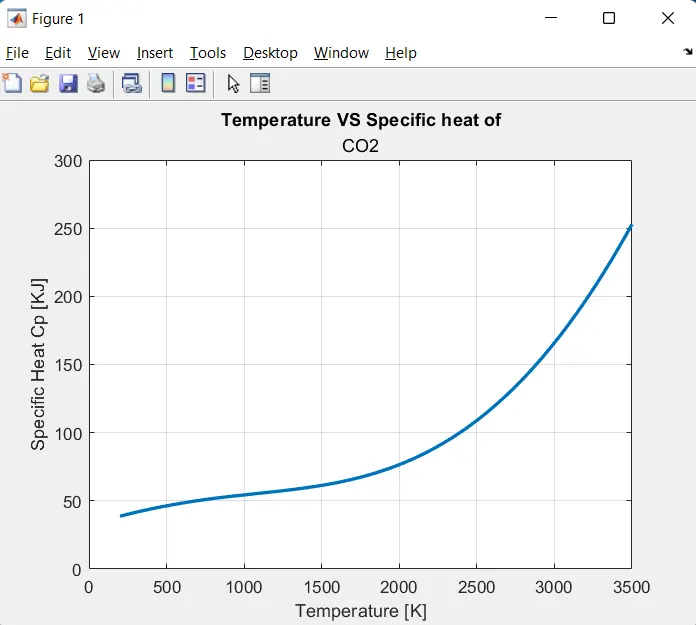
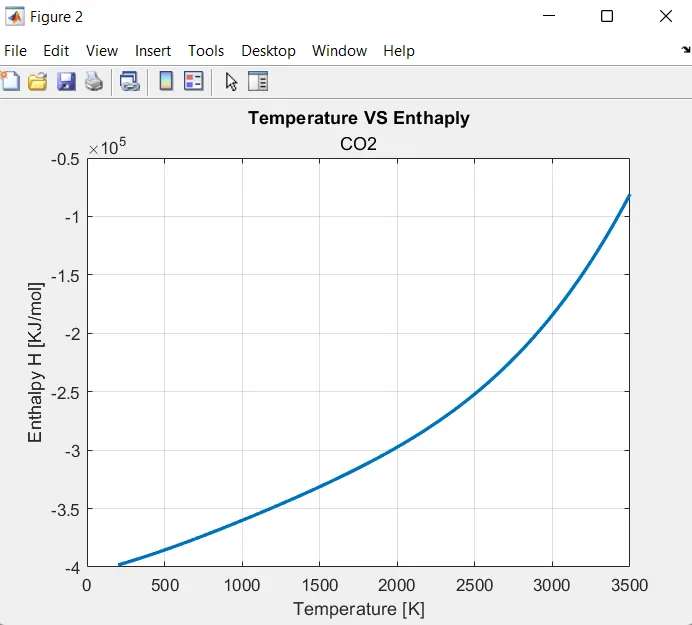
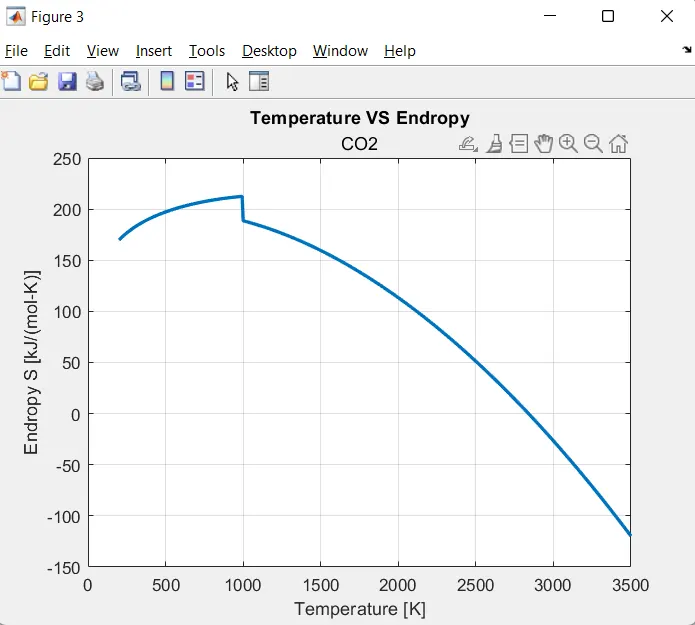
- Specific heat ,Enthalpy and Endropy plots of CO2
Command Window (displaying molecular weight of species)
Workspace
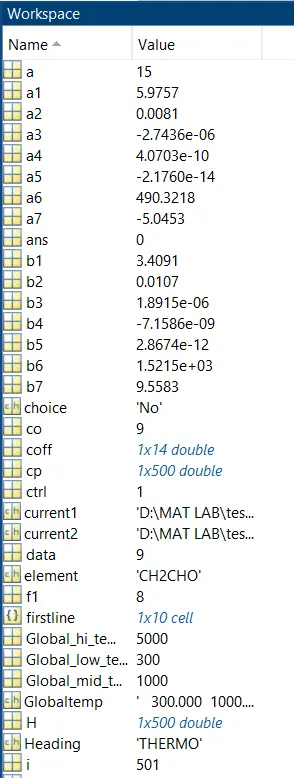
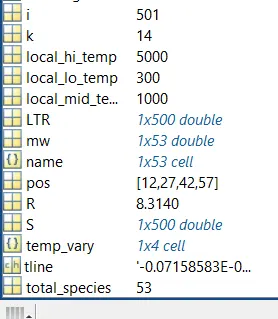
1.Folder where datas and files are saved
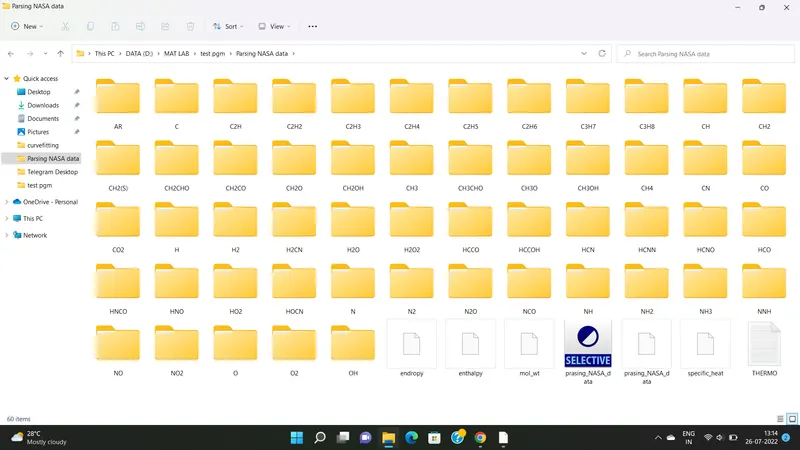
1.1 : Files inside folder
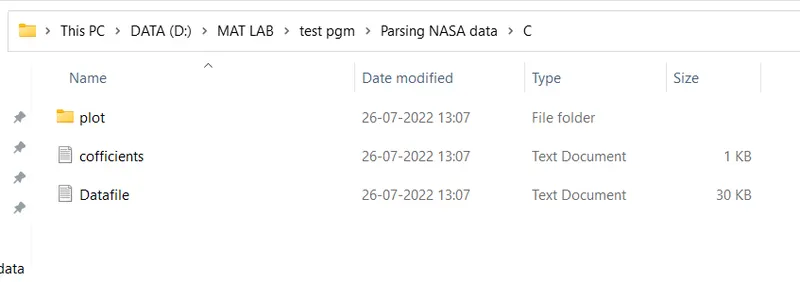
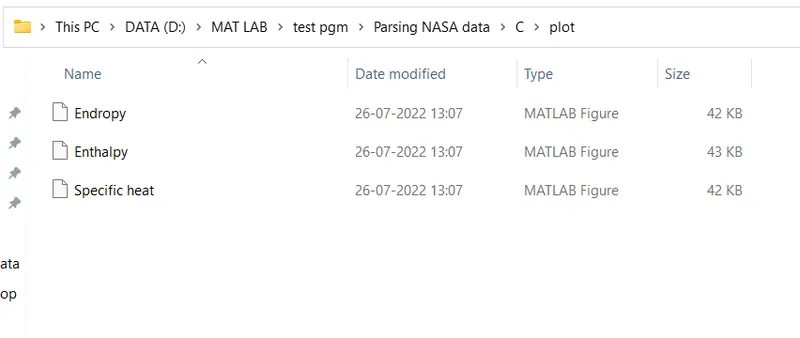
1.2 plot - File store plots of Specific heat VS Temperature,Enthalpy VS Temperature & Endropy VS Temperature of each element
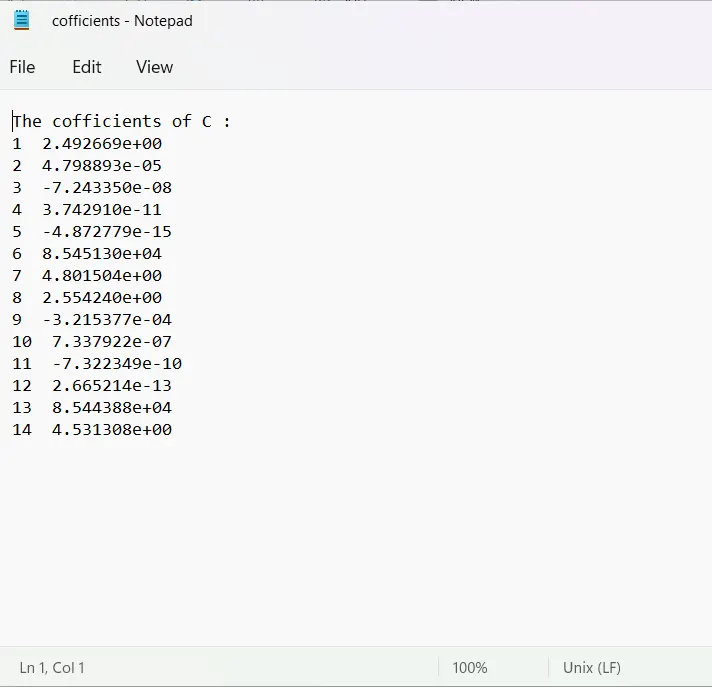
1.3 cofficients - File store 14 cofficients of each element
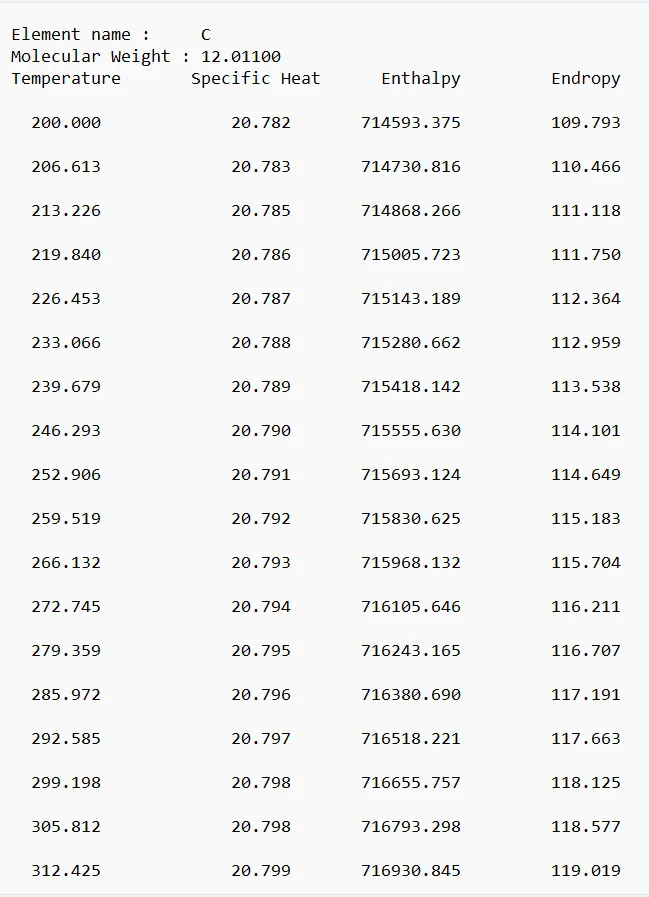
1.4 Data file - File that stores data of each element
Error
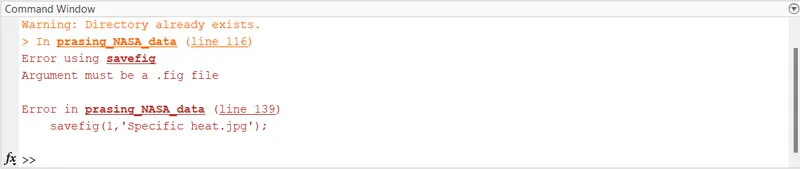
1. File not getting saved
Corretion
Changed the file format to '.fig' and cleared the error
2. The moleculat weight of Ar is getting '0'
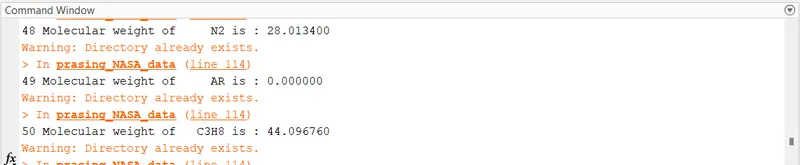
Correction
While difining the element changed the 'AR' to 'A' & solved the issue
REFERENCES
- https://in.mathworks.com/help/matlab/matlab_env/manage-files-and-folders.html
- https://in.mathworks.com/help/matlab/ref/mkdir.html#:~:text=status%20%3D%20mkdir(___)%20creates,combinations%20in%20the%20previous%20syntaxes
- https://in.mathworks.com/help/matlab/referencelist.html?type=function&category=printing-and-exporting
- https://in.mathworks.com/support/search.html?q=strcmpi&page=1
- https://in.mathworks.com/help/matlab/ref/inputdlg.html
- https://in.mathworks.com/support/search.html?q=switch&page=1