Project 1 - Parsing NASA thermodynamic data
%file parsing nasa's thermodynamic data
clear all
close all
clc

%accessing data
therm = fopen('THERMO.dat','r');
fgetl(therm);
temp = fgetl(therm);
tline = strsplit(temp,' ');
lgt = str2num(tline{2});
mgt = str2num(tline{3});
hgt = str2num(tline{4});

%skip the next 3 lines
for i = 1:3
    fgetl(therm);
end

%getting data for 14 species
for i = 1:53
    hd = fgetl(therm);
    sphd = strsplit(hd,' ');
    sp = sphd{1};
    llt = str2double(sphd{6});
    hlt = str2double(sphd{7});
    mlt = str2double(sphd{8});

    %getting coefficients
    %line 1
    l1 = fgetl(therm);
    e = strfind(l1,'E');
    x1 = str2double(l1(1:e(1)+3));
    x2 = str2double(l1(e(1)+4:e(2)+3));
    x3 = str2double(l1(e(2)+4:e(3)+3));
    x4 = str2double(l1(e(3)+4:e(4)+3));
    x5 = str2double(l1(e(4)+4:e(5)+3));

    %line 2
    l2 = fgetl(therm);
    e1 = strfind(l2,'E');
    x6 = str2double(l2(1:e1(1)+3));
    x7 = str2double(l2(e1(1)+4:e1(2)+3));
    x8 = str2double(l2(e1(2)+4:e1(3)+3));
    x9 = str2double(l2(e1(3)+4:e1(4)+3));
    x10 = str2double(l2(e1(4)+4:e1(5)+3));

    %line 3
    l3 = fgetl(therm);
    e2 = strfind(l3,'E');
    x11 = str2double(l3(1:e2(1)+3));
    x12 = str2double(l3(e2(1)+4:e2(2)+3));
    x13 = str2double(l3(e2(2)+4:e2(3)+3));
    x14 = str2double(l3(e2(3)+4:e2(4)+3));

    %calculating enthalpy, entropy, specific heat
    r = 8.314;
    t = linspace(llt,hlt,2000);
    for d = 1:length(t)

cp = spht(x1,x2,x3,x4,x5,x8,x9,x10,x11,x12,mlt,t,r);
h = enthalpy(x1,x2,x3,x4,x5,x6,x8,x9,x10,x11,x12,x13,mlt,t,r);
s = entropy(x1,x2,x3,x4,x5,x7,x8,x9,x10,x11,x12,x14,mlt,t,r);
    end

    %making folder
    mkdir(['D:\\matlab\\File parsing\\\',sp]);

    %plotting the results
    figure(1)
    plot(t,cp,'linewidth',5,'color','r');
    title(sp);
    xlabel('Temperature');
    ylabel('Specific heat');

    figure(2)
    plot(t,h,'linewidth',5,'color','g');
    title(sp);
    xlabel('Temperature');
    ylabel('Enthalpy');

    figure(3)
    plot(t,s,'linewidth',5,'color','b');
    title(sp);
    xlabel('Temperature');
    ylabel('Entropy');

    %saving images
    img = (['D:\\matlab\\File parsing\\\',sp]);
    cd(img);
    saveas(figure(1),'cp','jpg');
    saveas(figure(2),'h','jpg');
    saveas(figure(3),'s','jpg');

    %molecular mass
    mol = molmass(sp);
    fprintf('Molecular Weight for %s is %f ', sp,mol);
end
fclose(therm);


%function for specific heat
function cpv = spht(x1,x2,x3,x4,x5,x8,x9,x10,x11,x12,mlt,t,r)

if t>mlt
        cpv = (x1 + x2.*t + x3.*t.^2 + x4.*t.^3 + x5.*t.^4)*r;
else
     cpv = (x8 + x9.*t + x10.*t.^2 + x11.*t.^3 + x12.*t.^4)*r;
end


%function for enthalpy
function hv = enthalpy(x1,x2,x3,x4,x5,x6,x8,x9,x10,x11,x12,x13,mlt,t,r)

if t>mlt
        hv = (x1+((x2.*t)/2) + ((x3.*t.^2)/3) + ((x4.*t.^3)/4) + ((x5.*t.^4)/5) +  (x6./6)).*r.*t;
else
     hv = (x8+((x9.*t)/2) + ((x10.*t.^2)/3) + ((x11.*t.^3)/4) + ((x12.*t.^4)/5) +  (x13./6)).*r.*t;
end
end


%function for entropy
function sv = entropy(x1,x2,x3,x4,x5,x7,x8,x9,x10,x11,x12,x14,mlt,t,r)

if t>mlt
        sv = (x1.*log(t) + x2.*t + (x3.*t.^2)/2 + (x4.*t.^3)/3 + (x5.*t.^4)/4 + x7)*r;
else
     sv = (x8.*log(t) + x9.*t + (x10.*t.^2)/2 + (x11.*t.^3)/3 + (x12.*t.^4)/4 + x14)*r;
end
end


 %function for molecular mass calculation
 function molwt = molmass(sp)
    el = ['H','C','N','O','A'];
    atwt = [1,12,14,16,40];
    mol = 0;
    for i = 1:length(sp)
        for j = 1:length(el)
            if strcmpi(sp(i),el(j))
                mol = mol + atwt(j);
                p = j;
            end
        end

    q = str2double(sp(i));
    if q>1
        mol = mol + (atwt(p)*(q-1));
    end
    end
    molwt = mol;
 end



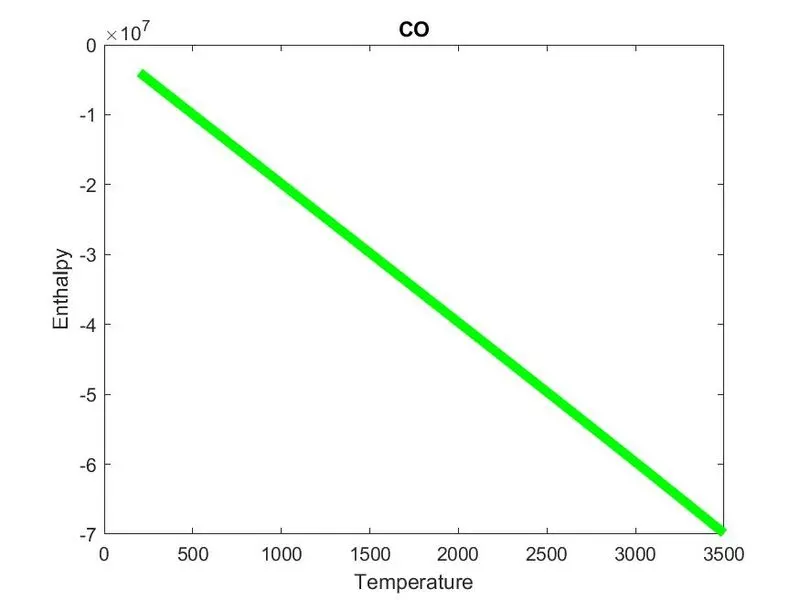
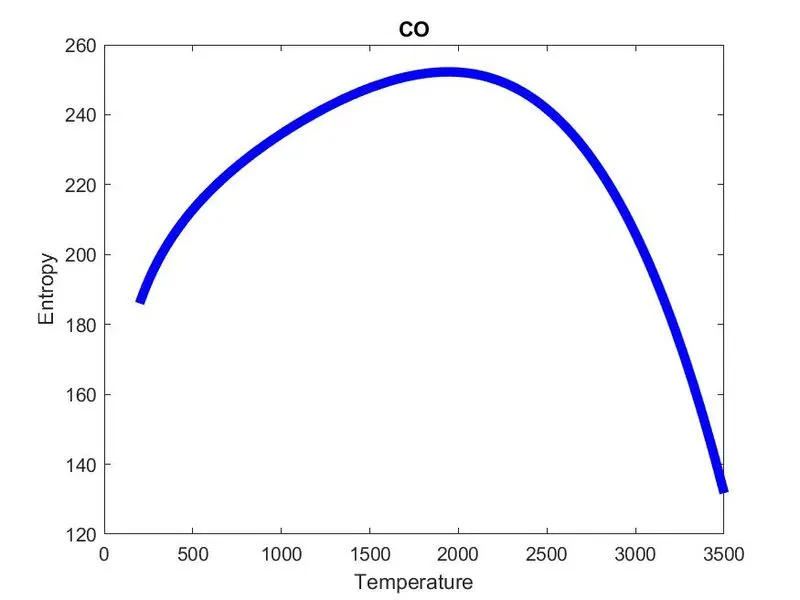
The objective here is to write a program to extract the data from a given file, and calculate some parameters according to the given data for some of the elements present in the file.
Here, the data given is the thermodynamic data from NASA to evaluate factors such as specific heat, enthalpy and entropy for some of the elements.We evaluate all the factors as well as find the molecular mass of the first 14 elements present in the data set and obtain outputs in the form of plots and values.
First, we write the functions to calculate the specific heat (cp), enthalpy(h), entropy(s), and molecular mass for the given elements. The formulae to calculate cp, h, and s are given as:

We write the functions with respect to the local temperature range for the elements given such that condition 1 is executed only if the temperature range mentioned by us is less than the medium local temperature given and if the condition is not satisfied, alternate code is executed. SImilarly, for all the factors, the functions are written and saved. To calculate the molecular mass for the elements, the elements are mentioned within an array, the atomic weights for the elements are provided, and the initial value for the molecular mass is set to 0. Now, each iterations of i is set from 1 to length of the array species names, and iterations j is set as 1 to length of the array elements, and if the comparison of strings between the species name for iteration i and elements for iteration j is satisfied, molecular mass is set as molecular mass + atomic weight of the element for jth iteration. Then, the value for j is stored in a variable p. A variable q is assigned to stroe the converted value to number using string2num or string2double command for the species name of (i)th iteration. If q is > 1, then the molecular mass is set to store the value as molecular mass + atomic mass of (p)th iteration times q-1.
Now, we start writing the code by opening the given file and reading it by fopen command and 'r' commands. fgetl command is used to get the line by line data in the file, and stored in a separate variable named temp. To get the global temperature ranges from the file, first we use strsplit command with ' ' so that all the values are individually stored in a cell array. Then, we can use the str2num command to convert the valus to numbers and store them in respective array variables.
A for loop is used to skip the next three lines and the fgetl command is used to get the values of the data file after skipping the lines. Again, a for loop is used to get the header information for 14 species from the data set, and condition is set for i, use fgetl command to get the data and store them in a separate variable, use string split command to split the values with respect to the spaces provided, and store the values as species name. Then, the values for the low, mid and high local temperature range is obtained by converting the values using str2double command with respect to their posiitons.
Now, we have to get the individual coefficients from each lines, with respect to the rows and columns. we have 3 rows and 5 columns for all the elements. We use the strfind command to get the position of E in the given coefficients, convert the values to numbers using str2double command for each lines, store them in individual variables. The coefficients are found by calculating the last position of E, and incrementing it with a particular value to get the staring position for the next coefficient. This is repeated for all the lines.
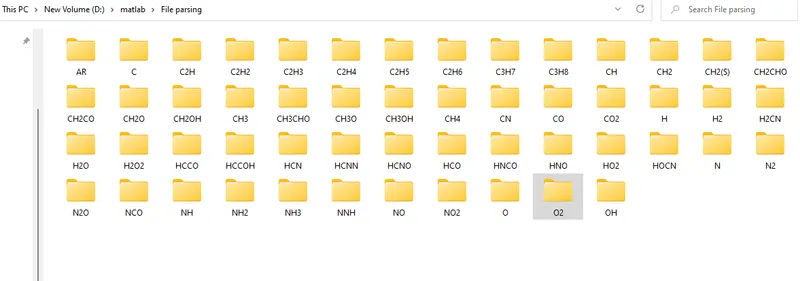
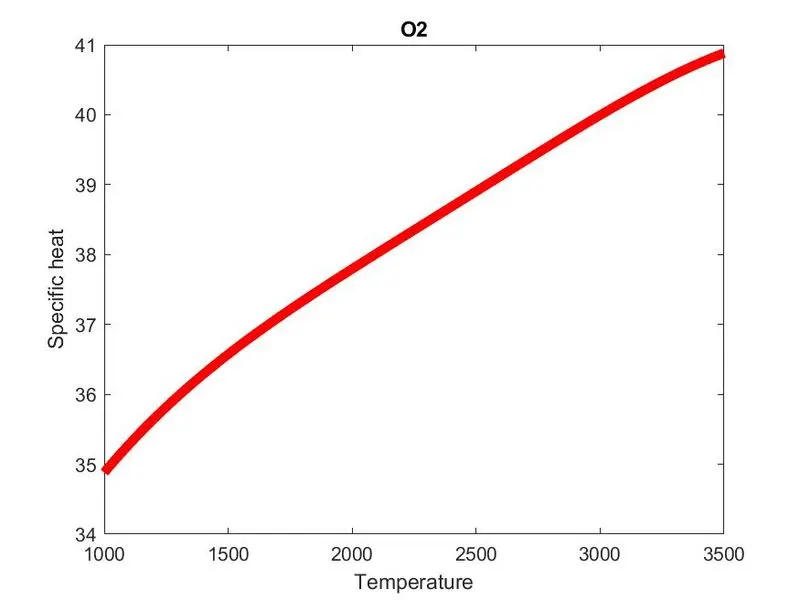
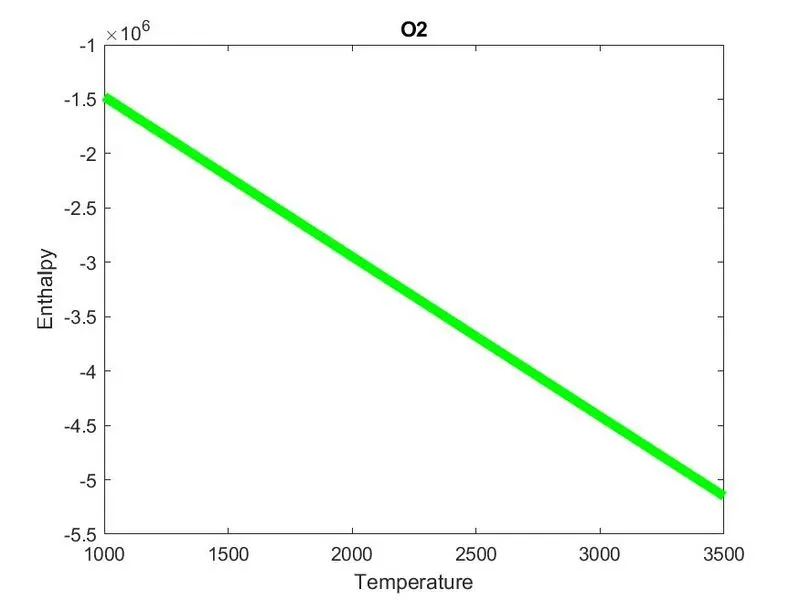
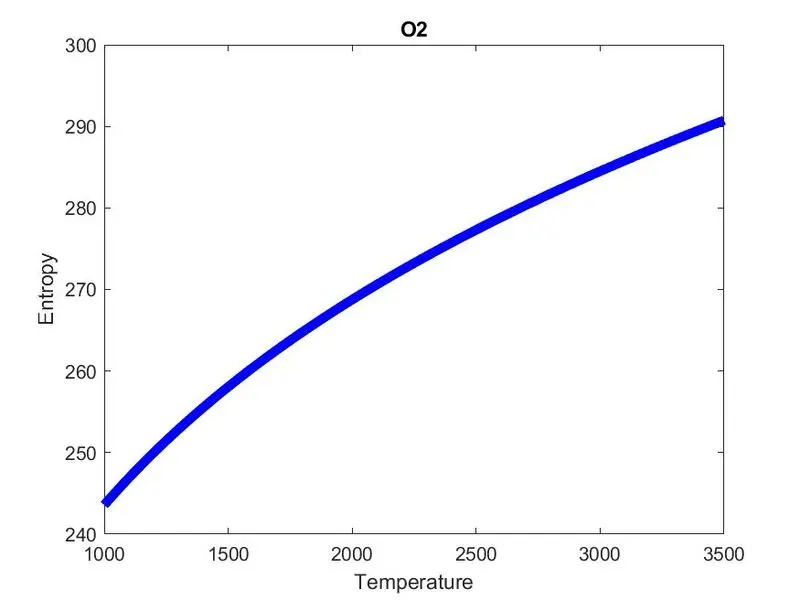
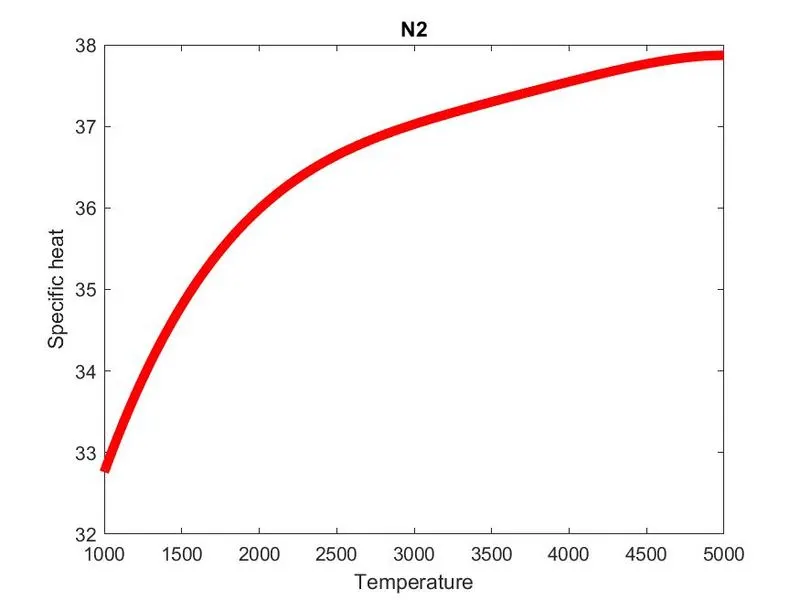
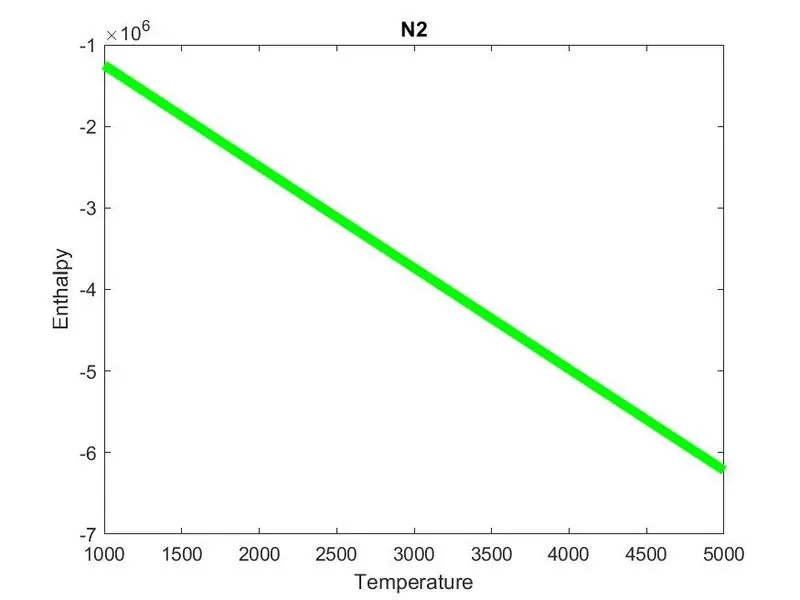
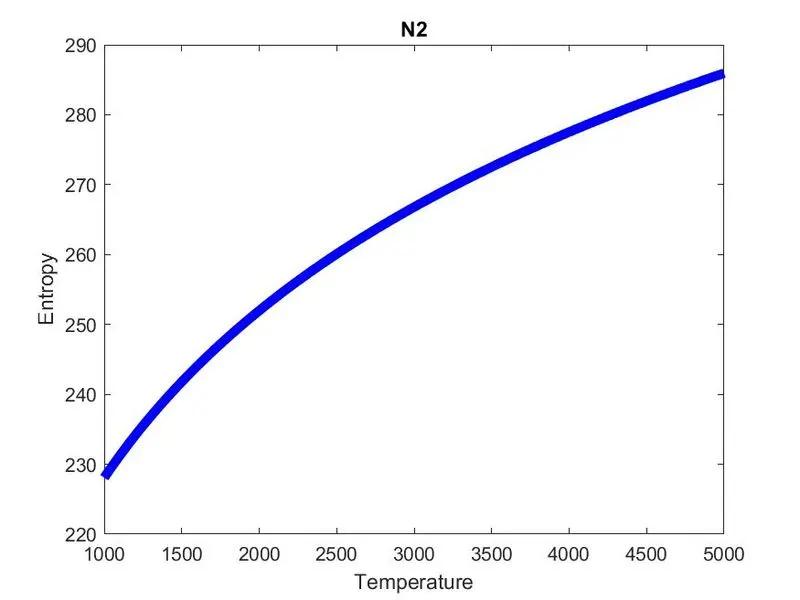
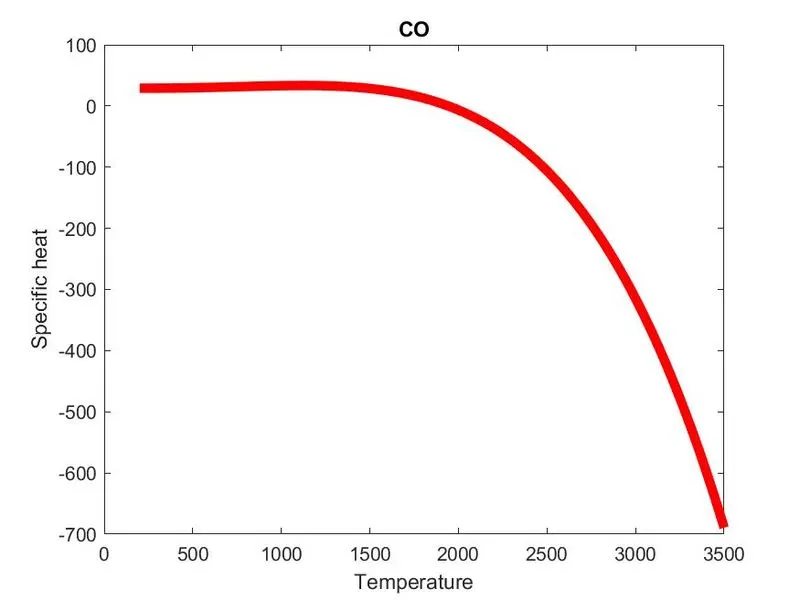
Now, we assign the value for universal gas consatant (r), use linspace command to get 2000 equal values for temperature between the low and high local temperatures, and use a for loop with condition set for the iteration as for each value of i ranging from 1 to length of the array t, cp, h, s are calculated by calling the respective functions which we earlier wrote. We use mkdir command to make the directory for storing all the plots for individual species with the species name, plot individually using plot command for temperature vs cp, h, s, provide a title and labels, and save the directory in a variable named img. Now, we use cd() command to make the img as our current directory, use saveas command to save all the plots individually with their respective titles and plots in jpg format.
Now, we can call the molecular mass function to calculate the molecular mass for the respective element, and use fprintf command to display the molecular mass for the corresponding element in the command window. Finally, we use fclose command to close the open files and all the results are obtained.