Project 1 - Parsing NASA thermodynamic data
Aim
Make a code to find enthalpy,entropy specific heats and molecular weight for all the given molecules in the data.
Plot Cp, Enthalpy and Entropy
Save the plot in folders named by corresponding folders,creating folders
Theory
Parsing is analysing (a string or text) into logical syntactic
components.Within computational linguistics the term is used to refer to the formal analysis by a computer of a sentence or other string of words into its constituents, resulting in a parse tree showing their syntactic relation to each other, which may also contain semantic and other information. Some parsing algorithms may generate a parse forest or list of parse trees for a syntactically ambiguous input.
A set of thermodynamic data of molecules is given.We have to do file parsing and find the Cp, Enthalpy and Entropy using the folumlas
Governing equations
`C_p/R =a_1 + a_2 * T+ a_3 * T^2 + a_4 * T^3 + a_5*T^4`
`H/(RT) = a_1+a_2*T/2 +a_3* T^2/3 +a_4 *T^3/4+a_5*T^4/5+a_6/T`
`S/R = a_1* ln T +a_2*T+a_3*T^2/2+a_4*T^3/3+a_5*T^4/4+a_7`
Function to find molecular weight
function [w]=molecular_weight(speciesname)

    atoms=['H','C','O','N','S','Ar'];
    atomic_weights=[1.00784, 12.0107, 15.999, 14.0067, 32.065, 39.948];
    w=0;

    for p=1:length(speciesname)
        for o=1:length(atoms)

            if speciesname(p)==atoms(o)
                w=w+atomic_weights(o);
                pos=o;
            end
        end

        n=str2num(speciesname(p));

        if n>=1
            w=w+atomic_weights(pos)*(n-1);
        end

    end

        fprintf('Molecular weight of %s = %f',speciesname,w)
        fprintf('\n')
end
Main Code
clear all
close all
clc

f1=fopen('THERMO.dat','r');

class(f1)

for i=1:5
   fgetl(f1);
end


for j=1:53

        pos=fgetl(f1);

        b=strsplit(pos,' ');

        speciesname=b{1};

        class(speciesname);
 %Localtemprature

        T=strfind(pos,'G');

        low_temp=str2double(pos(T+3:T+7));
        high_temp=str2double(pos(T+12:T+20));
        mid_temp=str2double(pos(T+22:T+30));

        T=linspace(low_temp,high_temp,100);

        line_1=fgetl(f1);
        a1=str2double(line_1(1:15));
        a2=str2double(line_1(16:30));
        a3=str2double(line_1(31:45));
        a4=str2double(line_1(46:60));
        a5=str2double(line_1(61:75));

        line_2=fgetl(f1);
        a6=str2double(line_2(1:15));
        a7=str2double(line_2(16:30));
        a8=str2double(line_2(31:45));
        a9=str2double(line_2(46:60));
        a10=str2double(line_2(61:75));

        line_3=fgetl(f1);
        a11=str2double(line_3(1:15));
        a12=str2double(line_3(16:30));
        a13=str2double(line_3(31:45));
        a14=str2double(line_3(46:60));

         %Calculation of Cp,H,S
        R=8.314;

        for z=1:length(T)
            if T(z)>mid_temp
                Cp(z)=R.*(a1+a2.*T(z)+a3.*T(z).^2+a4.*T(z).^3+a5.*T(z).^4);
                H(z)=R.*T(z)*(a1+a2.*(T(z))./2+a3.*(T(z))./3+a4.*(T(z))./4+a5.*(T(z))./5+a6./T(z));
                S(z)=R*(a1.*log(T(z))+a2.*T(z)+a3.*(T(z)^2)./2+a4.*(T(z)^3)./3+a5.*(T(z).^4)./4+a7);

            else
                Cp(z)=R.*(a8+a9.*T(z)+a10.*T(z).^2+a11.*T(z).^3+a12.*T(z).^4);
                H(z)=R.*T(z).*(a8+a9.*(T(z))./2+a10.*(T(z))./3+a11.*(T(z))./4+a12.*(T(z))./5+a13./T(z));
                S(z)=R.*(a8*log(T(z))+a9.*T(z)+a10.*(T(z).^2)/2+a11.*(T(z).^3)/3+a12.*(T(z).^4)./4+a14);
            end
        end


        %folder creation
        mkdir(['C:\Users\USER\Desktop\Final project\',speciesname]);


                 %Specific heat vs Temperature
                figure(1)
                plot(T,Cp,'Color','r','LineWidth',2)
                xlabel('Temperature')
                ylabel('Specific heat')
                title('Specific heat vs Temperature of',speciesname)
                saveas(figure(1),'Specific heat vs Temperature.jpg')


                %Enthalpy vs Temperature
                figure(2)
                plot(T,H,'Color','g','LineWidth',2)
                xlabel('Temperature')
                ylabel('Enthalpy')
                title('Enthalpy vs Temperature of',speciesname)
                saveas(figure(2),'Enthalpy vs Temperature.jpg')

                %Entropy  vs Temperature
                figure(3)
                plot(T,S,'Color','b','LineWidth',2)
                xlabel('Temperature')
                ylabel('Entropy')
                title('Entropy  vs Temperature of',speciesname)
                saveas(figure(3),'Entropy  vs Temperature.jpg')

                cd(['C:\Users\USER\Desktop\Final project\',speciesname])

 % molecular weight function
               [w]=molecular_weight(speciesname);


end
Outputs
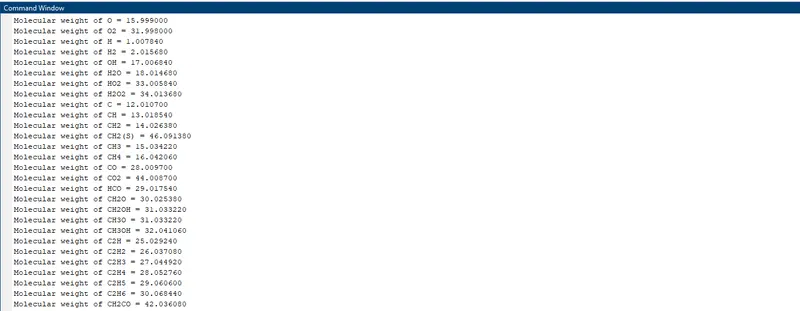
Molecular weights in command window
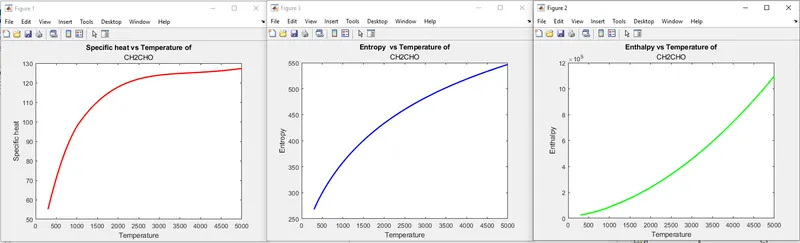
Plots for o2, N2 and Co2
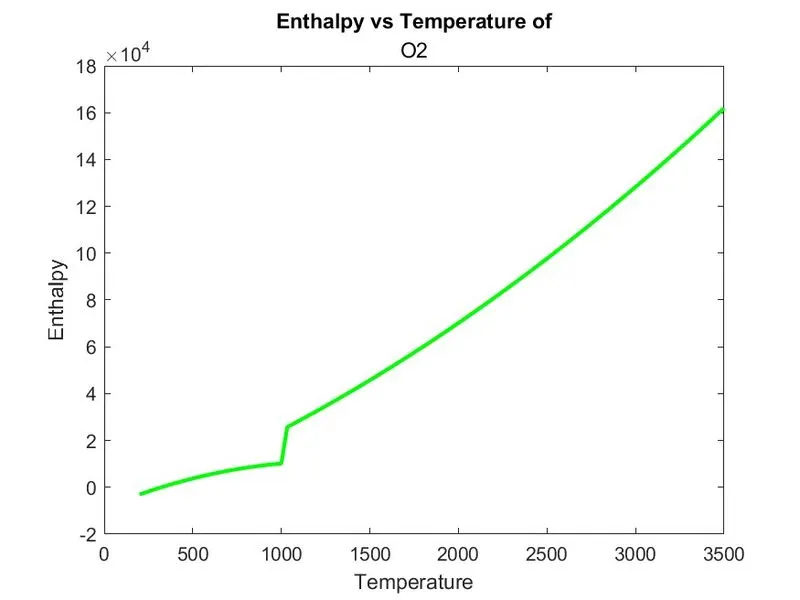
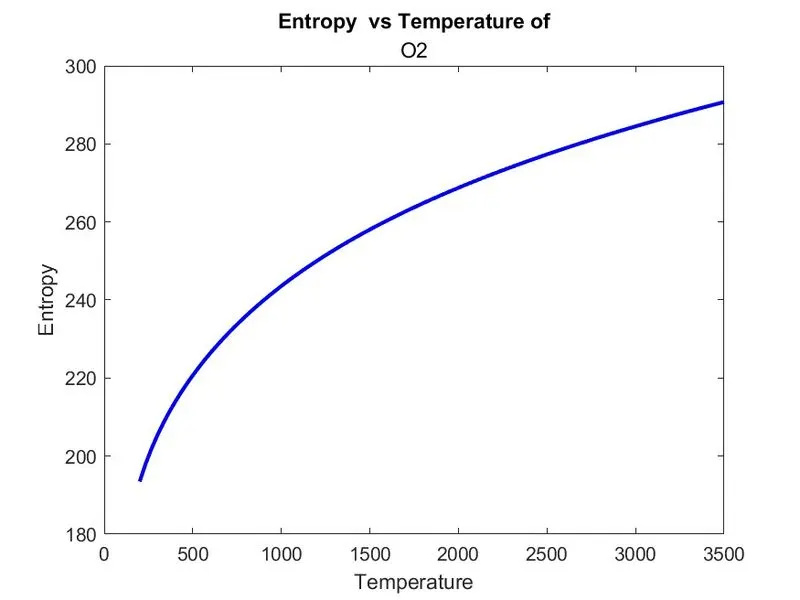
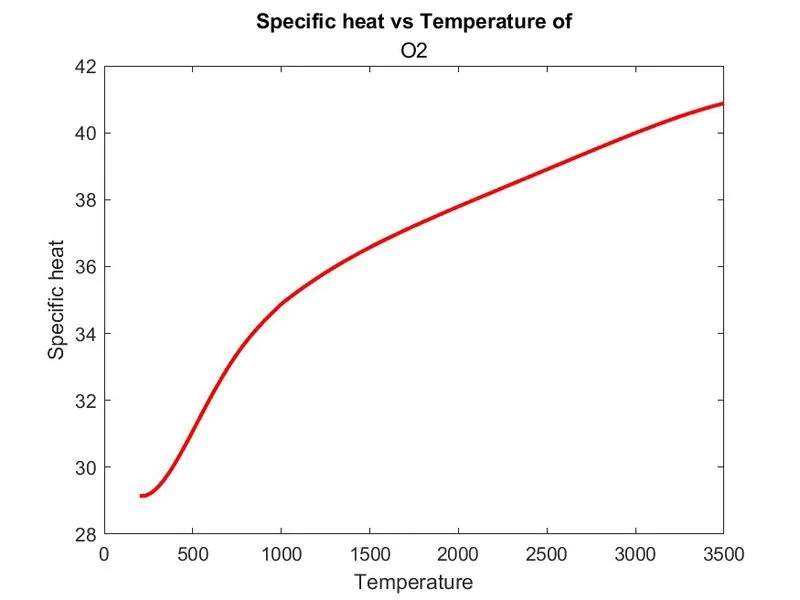
N2
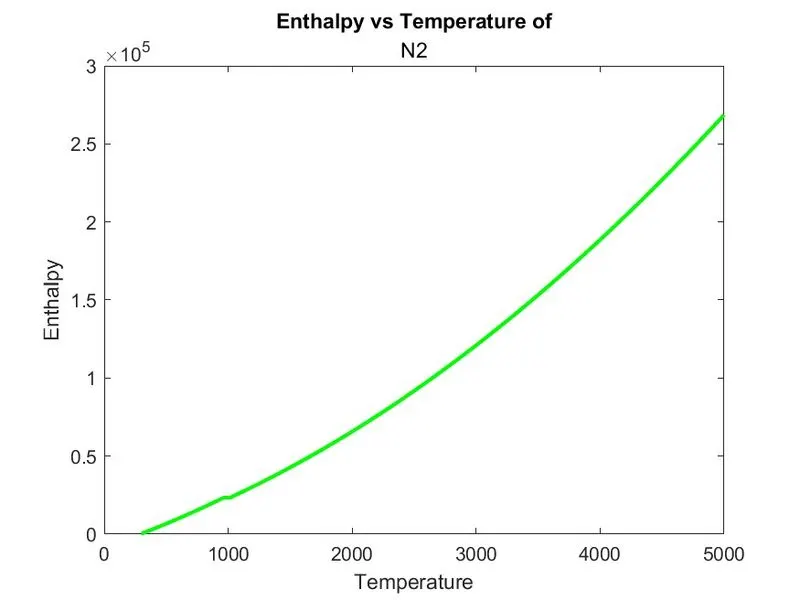
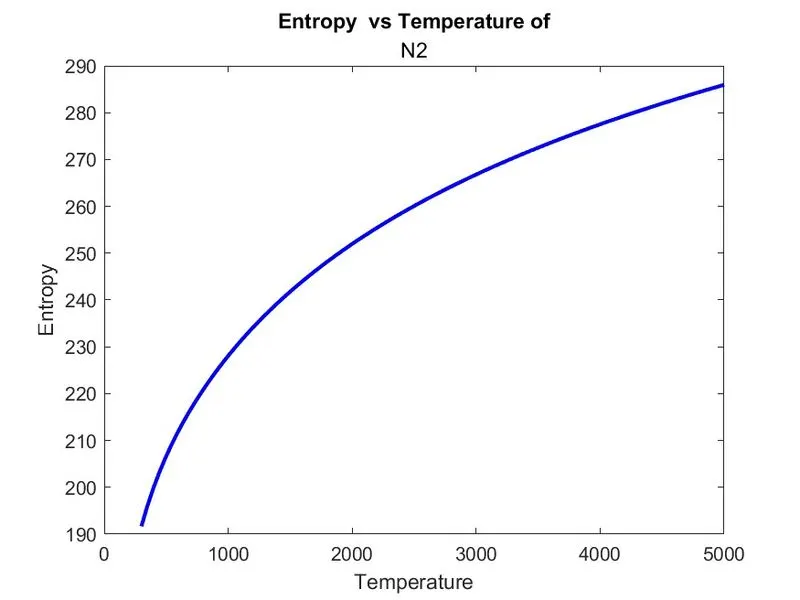
Co2
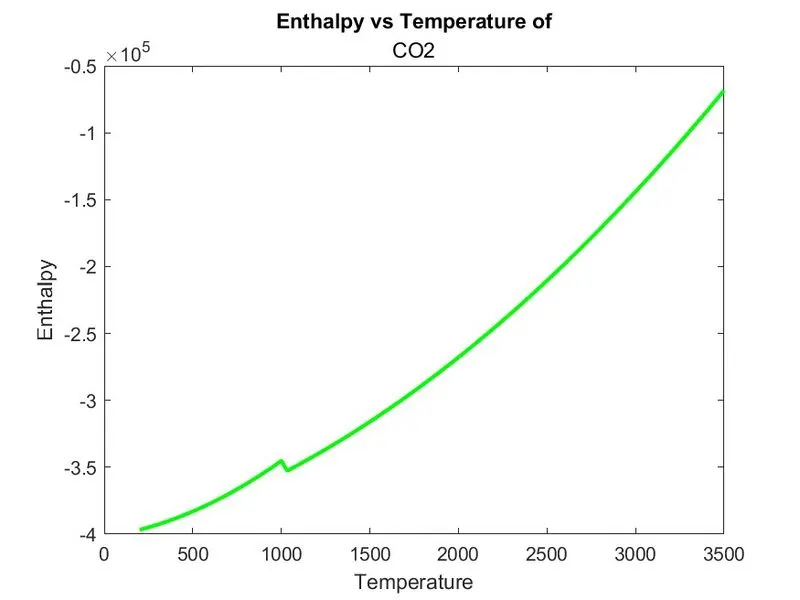
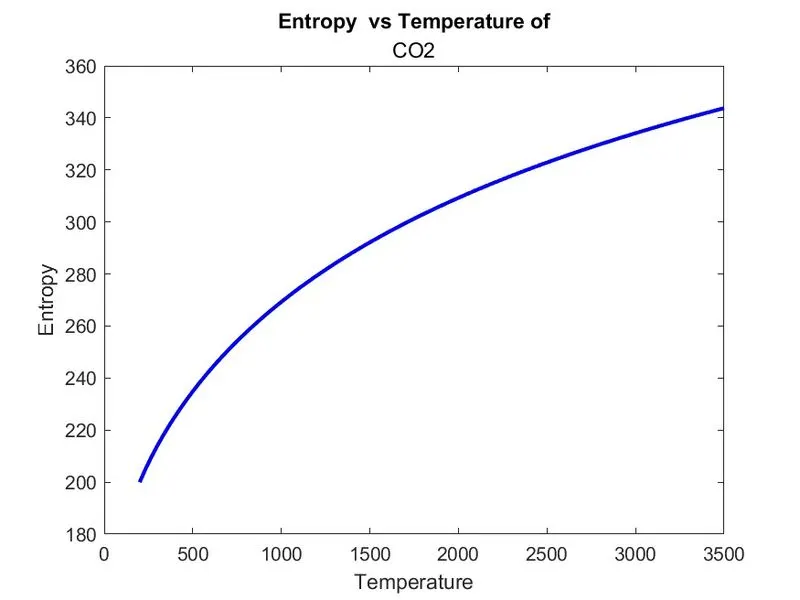
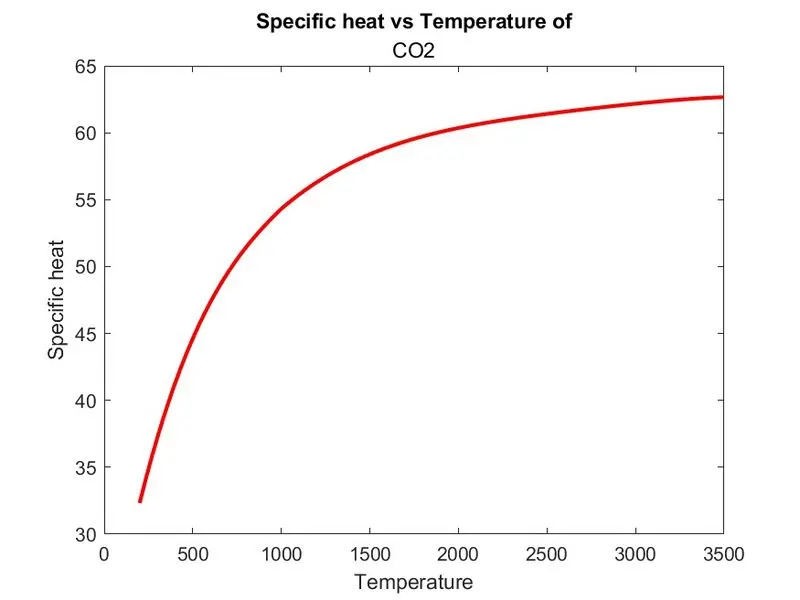
Created folders
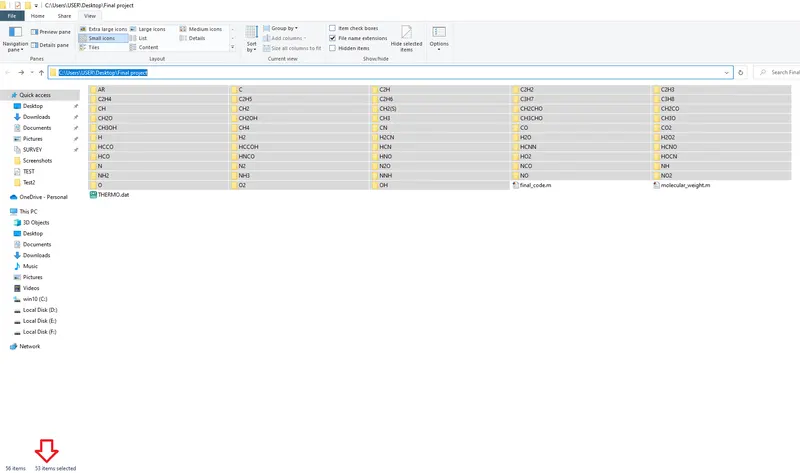
Explanation of the code
- Function explanation
For finding molecular weights, 2 arrays are created one with the atoms in the data file and the second with their corresponding atomic weights
a nested for loop is used to connect them and weight of each molecules are calculated
- Main code explained
the data is opened using fopen() command
the first 5 lines are non required data so it's skipped by using a for loop
then the position is set to the 6th line and strsplit() command is used to split the character vector of space ' '
the next point is taken as speciesname
the parsing is done by taking G before the temperature ranges in the THERMO data file
the low temp,high temp,mid temp values are set by taking their positon from that particular point G
100 values are set between high and low temprature ranges using linspace()
each line is taken into account by the taking range with ':' and converted it into numbers from strings by using str2double()
Calculation of Cp,H,S is done by using the formulas and selecting if the temprature range is high or low by using an if else condition
folders are created to the required directory by using mkdir(), cd() commands the figures are plotted using plot() command and saved as images in the corresponding folders using saveas() function
function for finding molecular weight is called. all this is done in a for loop which run 53 times since there are 53 molecular datas to be extracted.
Error faced
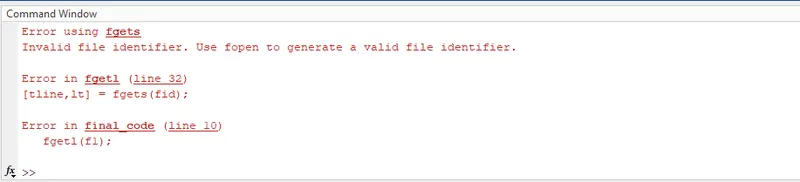
did not write extension of the file type (.dat) while calling