Project 1 - Parsing NASA thermodynamic data
File Parsing:- It is the process which helps to split the large input into smaller data and will process the data. This deals with the field of computational linguistics where it commonly defines the natural language processing. Natural Language processing (NLP), is concerned with programming the computers to proces and analyse the human written language.
Parsing a file means reading in a data stream of some sort and building an in memory model of the semantic content of that data. This aims at facilitating performing some kind of transformation on the data.
Specific Heat:- The specific heat is the amount of heat per unit mass required to raise the temperature by one degree Celsius.
Entropy:- Entropy, the measure of a system’s thermal energy per unit temperature that is unavailable for doing useful work. Because work is obtained from ordered molecular motion, the amount of entropy is also a measure of the molecular disorder, or randomness, of a system.
Enthalpy:- Enthalpy, a property of a thermodynamic system, is equal to the system’s internal energy plus the product of its pressure and volume. In a system contained so as to prevent mass transfer, for processes at constant pressure, the heat absorbed or released equals the change in Enthalpy.
Molecular weight:- It is a measure of the addition of the atomic weight values of the atoms in a molecule.
NASA Thermodynamic File:- NASA Thermodynamic file which is THERMO.dat file in which there are temperature range and 53 species are given in these data and each species contains 14 coefficients and temperature ranges in which first 7 are high temperature range and next 7 are low temperature range, and we have to parse these 14 coefficients to find Specific heat, Entropy and Enthalpy using formulae.
Here is the program given below to extracts the 14 co-efficients and calculates the enthalpy, entropy and specific heats for all 53 species in the data file.
clear all
close all
clc

%filereading
f1 = fopen('THERMO.dat','r');

for i = 1:5
    fgetl(f1);
end

for j = 1:53

a = fgetl(f1);
b = strsplit(a,' ');

species_name = b{1};

%local temperatures
low_temp = str2num(b{end-3});
high_temp = str2num(b{end-2});
mid_temp = str2num(b{end-1});

%extracting the co-efficients
line1 = fgetl(f1);

a = strfind(line1,'E');

a1 = str2double(line1(1:(a(1)+3)));
a2 = str2double(line1((a(1)+4):(a(2)+3)));
a3 = str2double(line1((a(2)+4):(a(3)+3)));
a4 = str2double(line1((a(3)+4):(a(4)+3)));
a5 = str2double(line1((a(4)+4):(a(5)+3)));

%getting 2nd line co-efficients (a6 to a10)
line2 = fgetl(f1);

a_1 = strfind(line2,'E');
a6 = str2double(line2(1:(a_1(1)+3)));
a7 = str2double(line2((a_1(1)+4):(a_1(2)+3)));
a8 = str2double(line2((a_1(2)+4):(a_1(3)+3)));
a9 = str2double(line2((a_1(3)+4):(a_1(4)+3)));
a10 = str2double(line2((a_1(4)+4):(a_1(5)+3)));

%getting 3rd line co-efficients (a7 to a14)
line3 = fgetl(f1);

a_2 = strfind(line3,'E');
a11 = str2double(line3(1:(a_2(1)+3)));
a12 = str2double(line3((a_2(1)+4):(a(2)+3)));
a13 = str2double(line3((a_2(2)+4):(a(3)+3)));
a14 = str2double(line3((a_2(3)+4):(a(4)+3)));


%calculation of Cp,H,S
T = linspace(low_temp,high_temp,100);

for i = 1:length(T)

    if (T(i)<=mid_temp)

        T1(i) = T(i);

    elseif (T(i)>mid_temp)

        T2(i) = T(i);

    end
end

ltr = T1;

d = length(T1);

htr = T2((d+1):100);

R = 8.314;


        Cp1 = (a1 + a2*htr + a3*htr.^2 + a4*htr.^3 + a5*htr.^4)*R;

        H1 = (a1 + (a2*htr)/2 + (a3*htr.^2)/3 + (a4*htr.^3)/4 + (a5*htr.^4)/5 + (a6./htr))*R.*htr;

        S1 = (a1*log(htr) + a2.*htr + (a3*htr.^2)/2 + (a4*htr.^3)/3 + (a5*htr.^4)/4 + a7)*R;


        Cp2 = (a8 + a9*ltr + a10*ltr.^2 + a11*ltr.^3 + a12*ltr.^4)*R;

        H2 = (a8 + (a9*ltr)/2 + (a10*ltr.^2)/3 + (a11*ltr.^3)/4 + (a12*ltr.^4)/5 + (a13./ltr))*R.*ltr;

        S2 = (a8*log(ltr) + a9.*ltr + (a10*ltr.^2)/2 + (a11*ltr.^3)/3 + (a12*ltr.^4)/4 + a14)*R;


Cp = [Cp1,Cp2];

H = [H1,H2];

S = [S1,S2];

%creating folders
mkdir(['A:\ABZ Skill-Lync\Matlab for Mech Engg\c9\',species_name]);

figure(1)

plot(T,Cp,'linewidth',3);
xlabel('Temperature')
ylabel('Specific Heat')
title(['Specific Heat vs Temperature of ',species_name])

figure(2)

plot(T,H,'linewidth',3)
xlabel('Temperature')
ylabel('Enthalpy')
title(['Enthalpy vs Temperature of ',species_name])

figure(3)

plot(T,S,'linewidth',3)
xlabel('Temperature')
ylabel('Entropy')
title(['Entropy vs Temperature of ',species_name])


cd(['A:\ABZ Skill-Lync\Matlab for Mech Engg\c9\',species_name]);

saveas(1,'Specific Heat vs Temperature','jpg')
saveas(2,'Enthalpy vs Temperature','jpg')
saveas(3,'Entropy vs Temperature','jpg')


% Molecular weight Calculation
MW = Molecular_weight(species_name)

end
Firstly, we have to read the data from THERMO.dat file by using command fopen.
After that, we will extract local temperatures of species by using the command fgetl().
Then we are extracting species wise higher & lower temperature coefficients by using str2double command.
Then in the for loop, we are storing equations for entropy, enthalpy & specific heat for both high, mid and low-temperature coefficients.
The formula for Specific ,Enthalpy, Entropy is used given below,
Cp = (a1 + a2*htr + a3*htr.^2 + a4*htr.^3 + a5*htr.^4)*R
H = (a1 + (a2*htr)/2 + (a3*htr.^2)/3 + (a4*htr.^3)/4 + (a5*htr.^4)/5 + (a6./htr))*R.*htr
S = (a1*log(htr) + a2.*htr + (a3*htr.^2)/2 + (a4*htr.^3)/3 + (a5*htr.^4)/4 + a7)*R
After that by using \'mkdir\' & \'cd:\' command we are creating an individual folder for each species and along there three specific plots of entropy, enthalpy & specific heat Vs. temperature.
Then as per asked we are getting molecular weight in the command window and plots for each species.
Here is the function program to read out the molecular weight of species from the data file.
function MW = Molecular_weight(species_name)

Elements = ['C','H','O','N','Ar'];
Atomic_weight = [12,1,16,14,40];

MW = 0;

for i = 1:length(species_name)

    for j = 1:length(Elements)

        if strcmp(species_name(i),Elements(j))

            MW = MW + Atomic_weight(j);
            position = j;

        end
    end
    n = str2num(species_name(i));

    if n>1
        MW = MW + Atomic_weight(position)*(n-1);
    end

end

fprintf('Molecular weight of %s : ',species_name)
fprintf('%f',MW);
disp(' ')

end
Then from the function program, we will extract the molecular weight of each species by calling Molecular_weight.m.
In a function program, we are reading specific species as they are repeating in certain species like [C, H, O, N, Ar].
In a function code, if data file specimen is having above five species then the if-else loop will read it and calculated the molecular weight for each of them.
But...
Before that I made a mistake that, I had not given the space value for str2num command due to that species having number is not converted from string to numerals. Consequencly, the number of atoms was not taking into the account for calculation of Molecular weight of species.
Here is the program function given below in which I made mistake and error occured in calculation of molecular weight.
function MW = Molecular_weight(species_name)

Elements = ['C','H','O','N','Ar'];
Atomic_weight = [12,1,16,14,40];

MW = 0;

for i = 1:length(species_name)

    for j = 1:length(Elements)

        if strcmp(species_name(i),Elements(j))

            MW = MW + Atomic_weight(j);
            position = j;

        end
    end
    n = str2num(species_name);

    if n>1
        MW = MW + Atomic_weight(position)*(n-1);
    end

end

fprintf('Molecular weight of %s : ',species_name)
fprintf('%f',MW);
disp(' ')

end
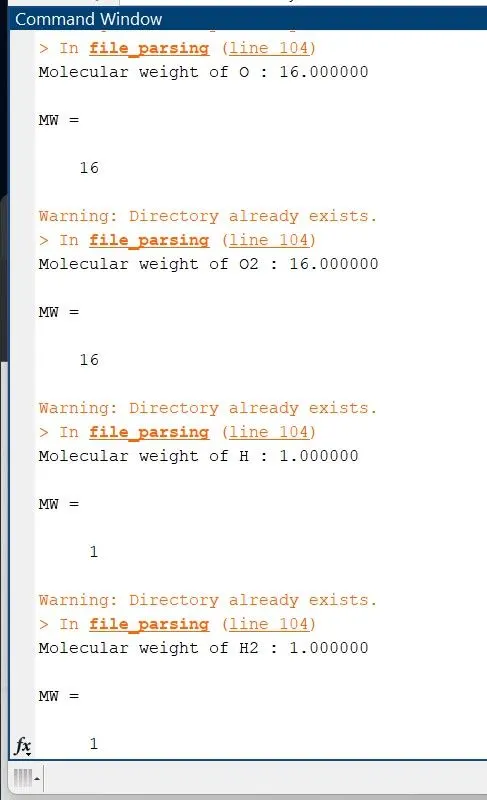
So, after running this main function I was getting same output value for same species having different number of atoms.
Example:-
Molecular weight of O = 16
Molecular weight of O2 = 16
Molecular weight of H = 1
Molecular weight of H2 = 1
Here is screen shot of incorrect outputs of molecular weight in command window.
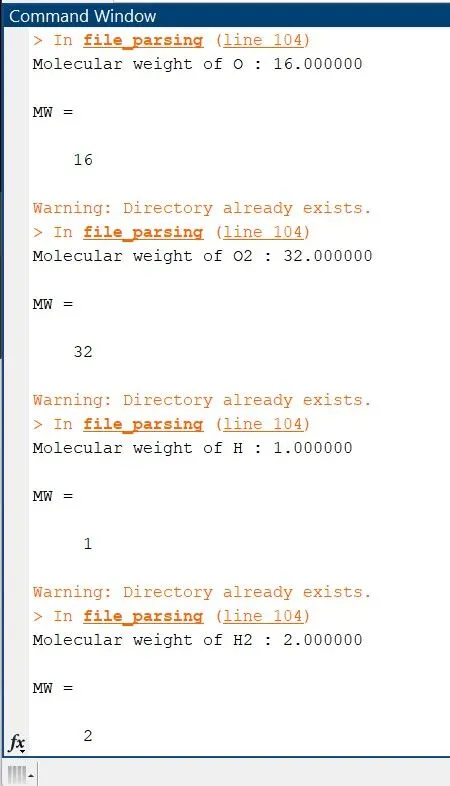
But after that I made correction in it by adding (i) in str2num command so that it will convert numbers value from strimg to numerlas and could taken into account for calculation of molecular weight. (Corrected program function is attached earlier above).
Here is screen shot of correct outputs of molecular weight in command window.
As well after running the main function program. There was a pop up of three graph for 53 species, and every graph is saved individually in theirs species folder.
Screenshot of all folders is given below.
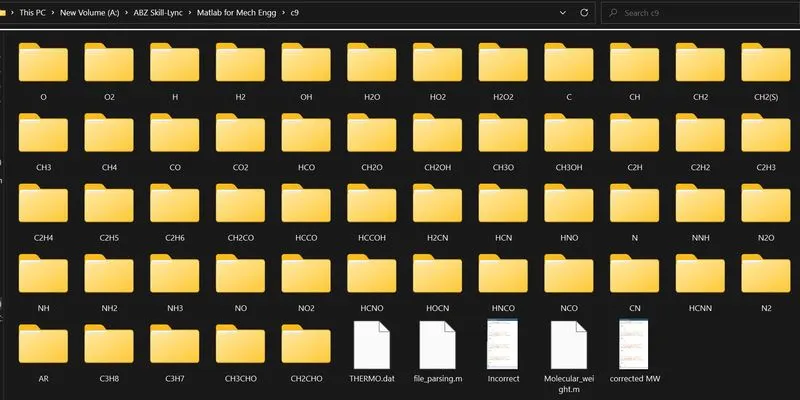
Here we can see that, there is 53 folders are created for every species and every folder contains three graph of Specific heat vs Temperature ; Enthalpy vs Temperature ; Entropy vs Temperature.
I am attaching thrice output graphs of O2 , N2 and CO2, which containing its folder itself.
Graphs of O2 :-
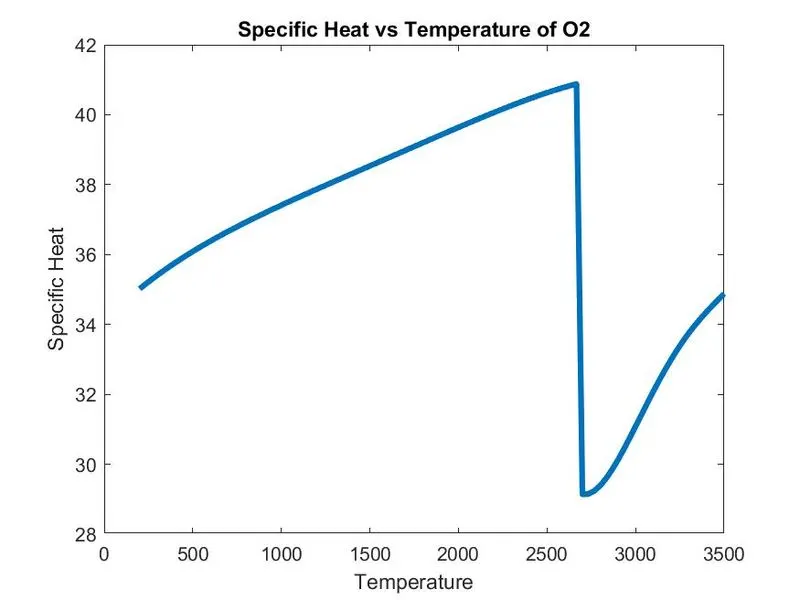
Specific heat vs Temperature of O2
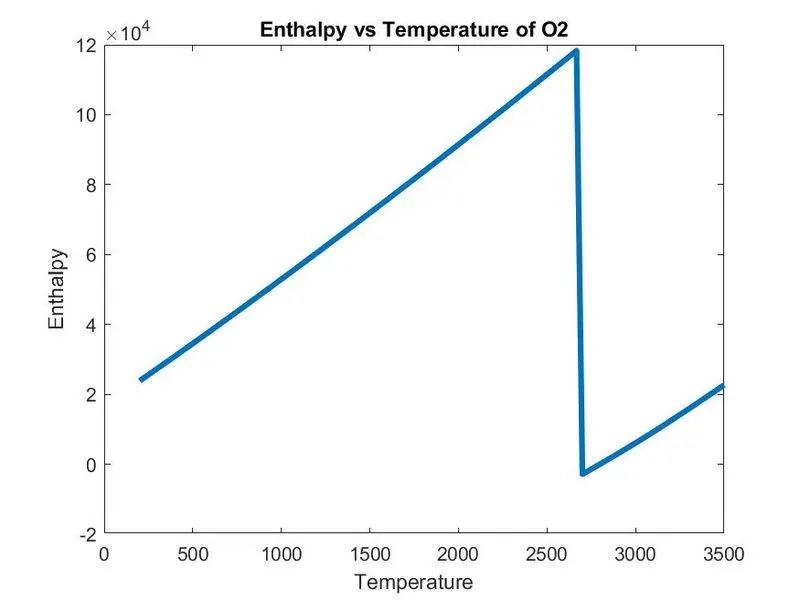
Enthalpy vs Temperature of O2
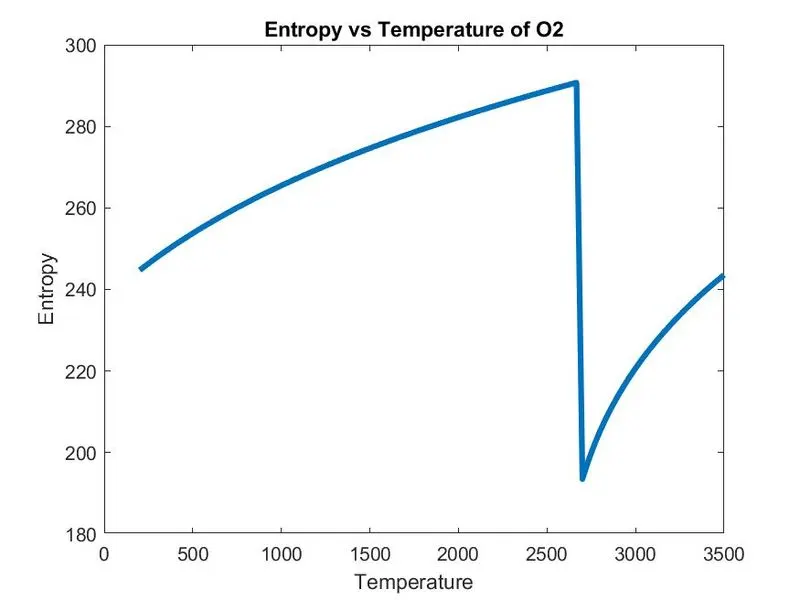
Entropy vs Temperature of O2
Graphs of N2 :-
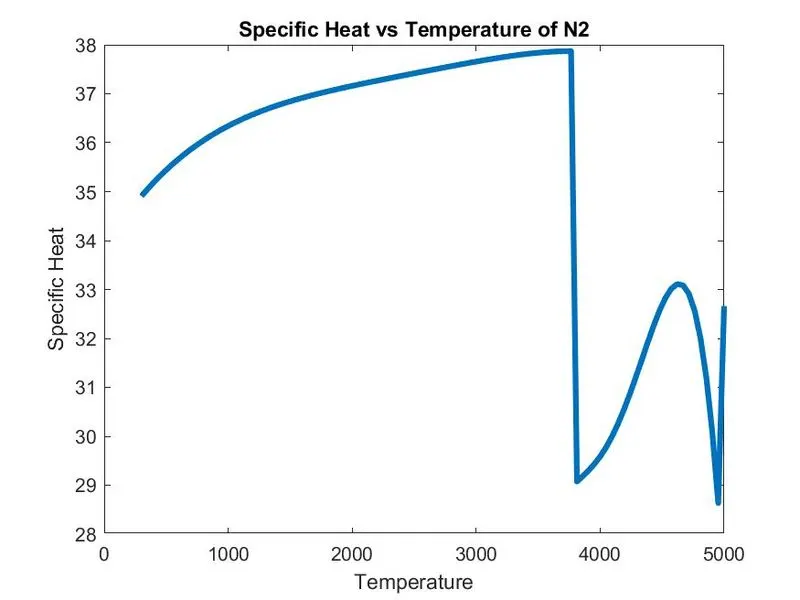
Specific heat vs Temperature of N2
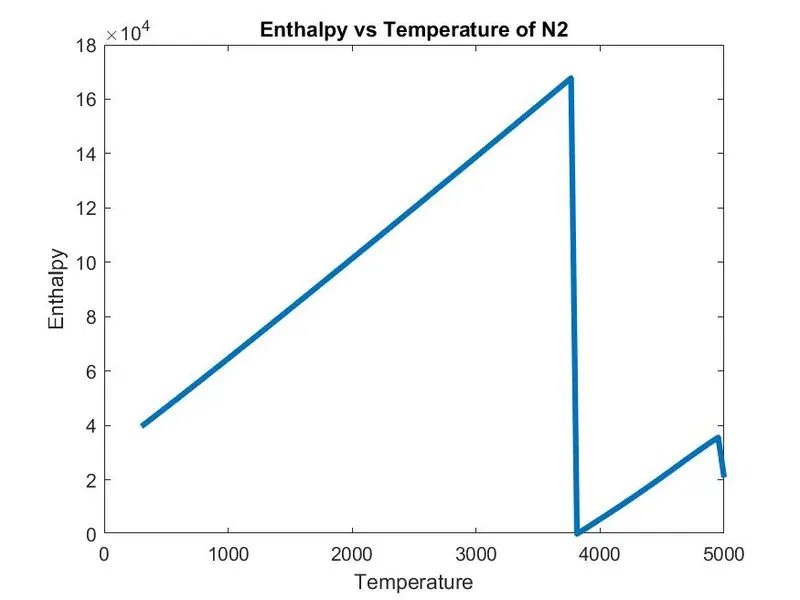
Enthalpy vs Temperature of N2
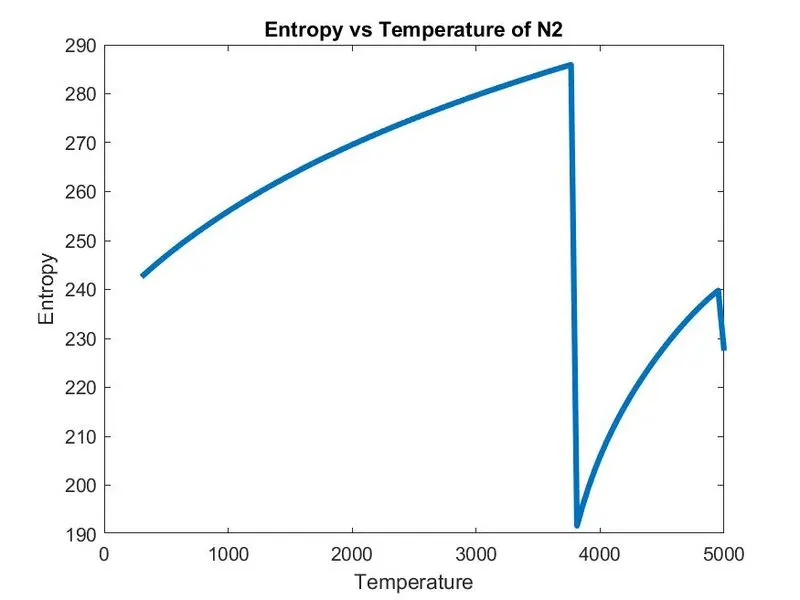
Entropy vs Temperature of N2
Graphs of CO2 :-
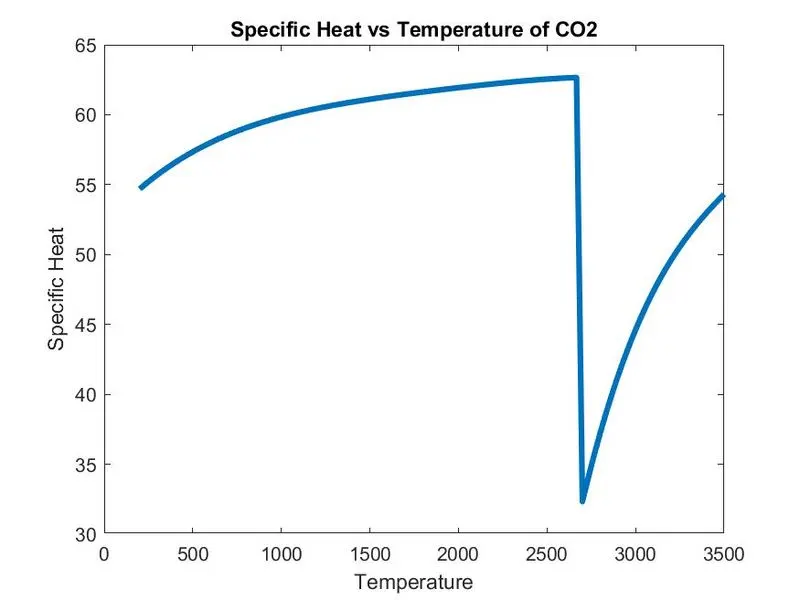
Specific heat vs Temperature of CO2
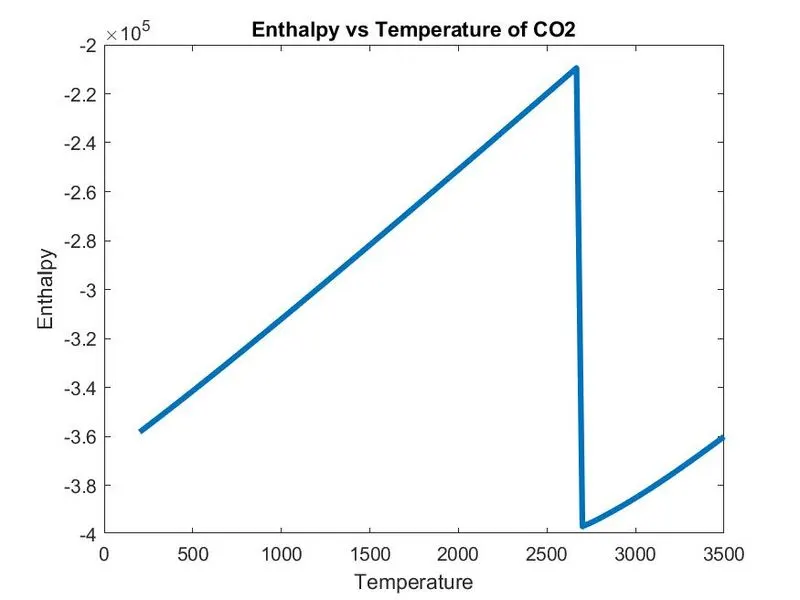
Enthalpy vs Temperature of CO2
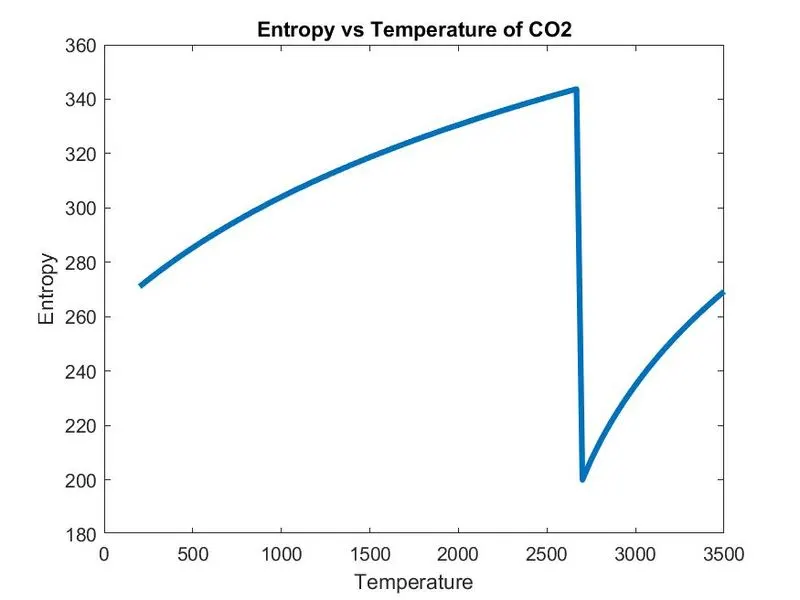
Entropy vs Temperature of CO2