Project 1 - Parsing NASA thermodynamic data
Aim: is to Write a function that extracts the 14 co-efficients and calculates the enthalpy, entropy and specific heats for all the species in the data file. You will be reading this file NASA thermodynamic data(Tip: use fopen and fgetl). The formulae are shown below.
Here R is the universal gas constant, T is the temeprature
The FIRST 7 coefficients are HIGH-temperature coefficients and the SECOND 7 coefficients are LOW-temperature coefficients.
Also use the LOCAL TEMPERATURE RANGES which is unique for each individual species, not the GLOBAL TEMPERATURE RANGE.
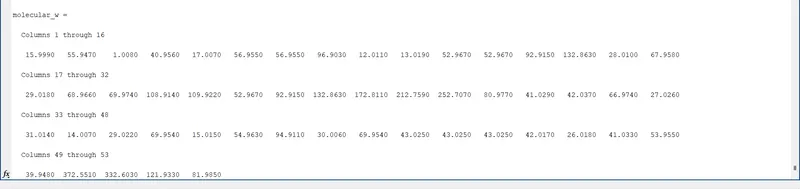
2. Calculate the molecular weight of each species and display it in the command window.
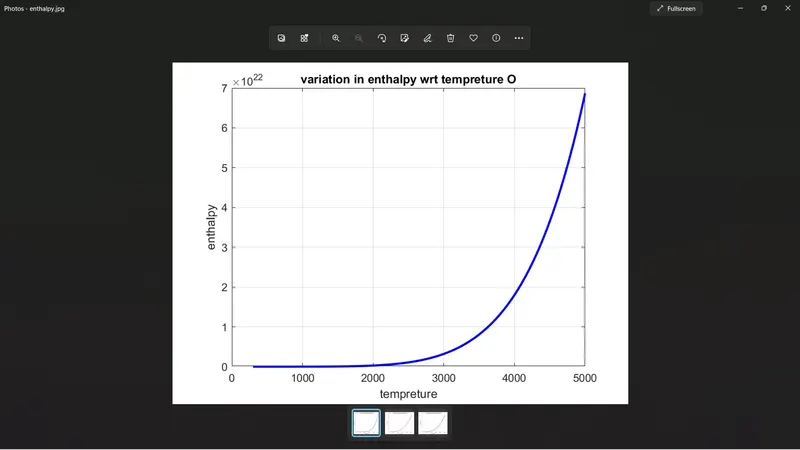
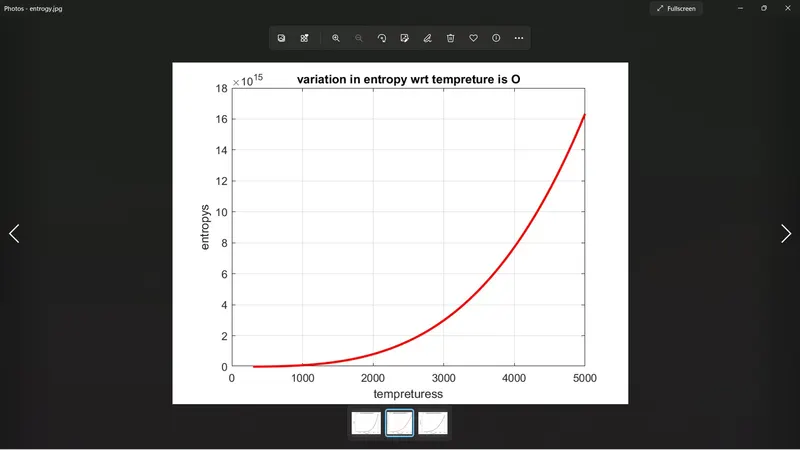
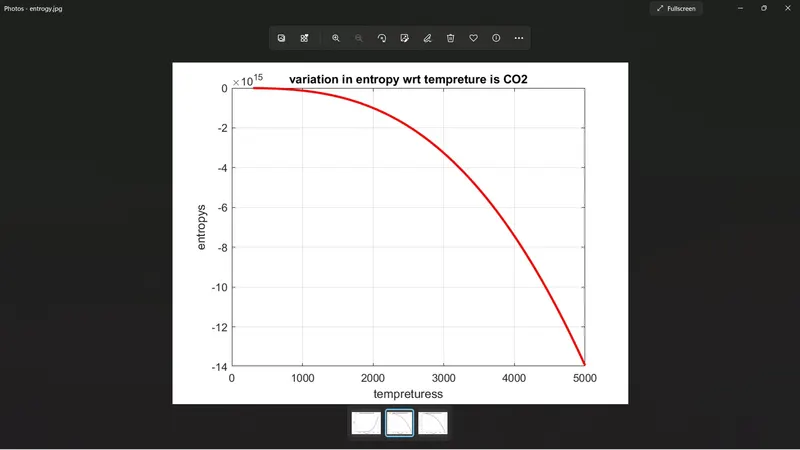
3. Plot the Cp, Enthalpy and Entropy for the local temperature range (low temperature : high temperature) specific for each species.
4. Save the plots as images with appropriate names and dump them in separate folders for each species with suitable name. All these should be generated automatically.
5. The main program that you will submit will just take the "THERMO.dat" file as an input and generate Cp, H and S plots.
6. Please write a detailed report to describe your logic.
File parsing:
The process of "parsing" can be described as reading in a data stream of some sort and building an in-memory model or representation of the semantic content of that data, in order to facilitate performing some kind of transformation on the data.
Some examples:
- A compiler parses your source code to (usually) build an abstract syntax tree of the code, with the objective of generating object- (or byte-) code for execution by a machine.
- An interpreter does the same thing but the syntax tree is then directly used to control execution (some interpreters are a mashup of byte-code generators and virtual machines and may generate intermediate byte-code).
- A CSV parser reads a stream structured according to the rules of CSV (commas, quoting, etc) to extract the data items represented by each line in the file.
- A JSON or XML parser does a similar operation for JSON- or XML-encoded data, building an in-memory representation of the semantic values of the data items and their hierarchical inter-relationships.
Entrophy:a thermodynamic quantity representing the unavailability of a system's thermal energy for conversion into mechanical work, often interpreted as the degree of disorder or randomness in the system.
equation for entrophy fALLOWS BELOW:

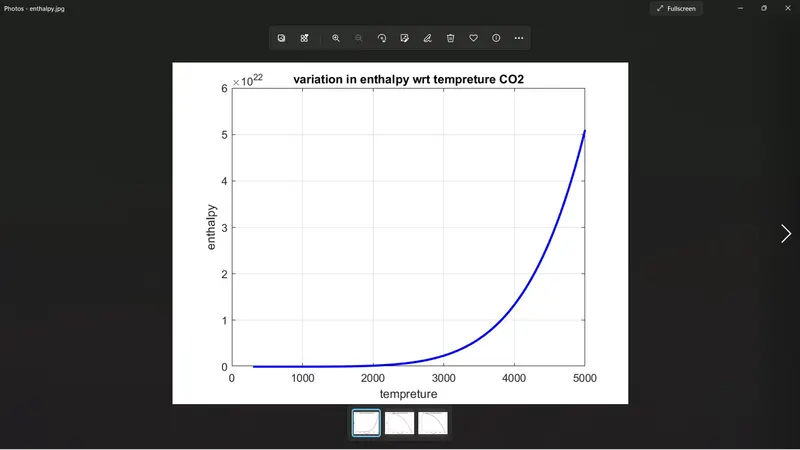
Enthalphy:a thermodynamic quantity equivalent to the total heat content of a system. It is equal to the internal energy of the system plus the product of pressure and volume.
equation for enthalphy fallows below

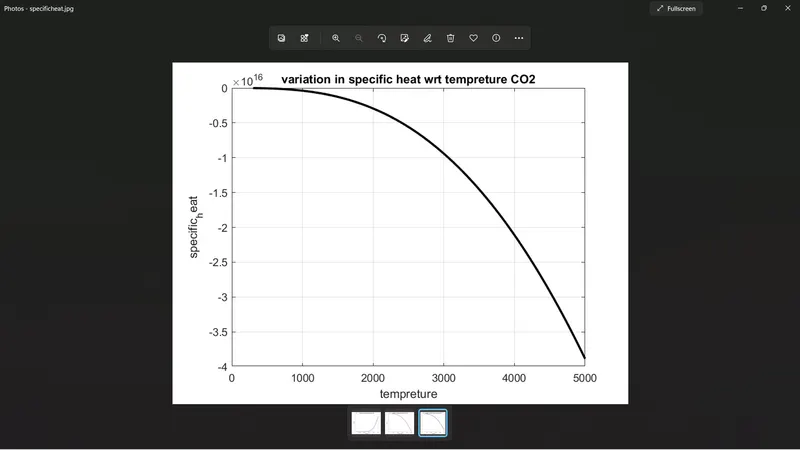
specific heat:the quantity of heat required to raise the temperature of one gram of a substance by one Celsius degree. The units of specific heat are usually calories or joules per gram per Celsius degree.
equation for specific heat:

main code:
%writing code for file parsing
clear all
close all
clc

%here we are opening the file
F1=fopen('THERMO.dat','r')
first_line=fgetl(F1);
%defining the values for R which is gas constant
R=8.314;

%know taking tempreture from the file
%secound line
temp=fgetl(F1);

%know dividing the tepreture

A=strsplit(temp,' ');

%know converting the string into number
globel_low_tempreture=str2num(A{2});
globel_middle_tempreture=str2num(A{3});
globel_high_tempreture=str2num(A{4});

%know defing the tempreture range
tempreture=linspace(globel_low_tempreture,globel_high_tempreture,globel_middle_tempreture);

%we have to skipp the 3lines

third_line=fgetl(F1);
fourth_line=fgetl(F1);
fifth_line=fgetl(F1);

%know we have run the for loop for 53 different species

for i=1:53
    %taking 1st species
    sixth_line=fgetl(F1);
    M=strsplit(sixth_line,' ');
    species_name=M{1};

    %know finding the coefficents from the 1st line of the taken species
    sixth_line_one=fgetl(F1);
    a=findstr(sixth_line_one,'E');

    %there fore we have 5 coefficents in our 1st line so we have to find
    %the 5 coefficents

    a1=sixth_line_one(1:a(1)+3);
    a1=str2num(a1);

    a2=sixth_line_one(a(1)+4:a(2)+3);
    a2=str2num(a2);
    a3=sixth_line_one(a(2)+4:a(3)+3);
    a3=str2num(a3)
    a4=sixth_line_one(a(3)+4:a(4)+3);
    a4=str2num(a4);
    a5=sixth_line_one(a(4)+4:a(5)+3);
    a5=str2num(a5);

    % we have to move to next line for further coefficents here we have 5
    % coefficents
    sixth_line_sec=fgetl(F1)
    a=findstr(sixth_line_sec,'E')
    a6=sixth_line_sec(1:a(1)+3);
    a6=str2num(a6);

    a7=sixth_line_sec(a(1)+4:a(2)+3);
    a7=str2num(a7);
    a8=sixth_line_sec(a(2)+4:a(3)+3);
    a8=str2num(a8)
    a9=sixth_line_sec(a(3)+4:a(4)+3);
    a9=str2num(a9);
    a10=sixth_line_sec(a(4)+4:a(5)+3);
    a10=str2num(a10);

    % we have to move to next line for further coefficents here we have 5
    % coefficents

    sixth_line_third=fgetl(F1)
    a=findstr(sixth_line_sec,'E')
    a11=sixth_line_sec(1:a(1)+3);
    a11=str2num(a11);

    a12=sixth_line_sec(a(1)+4:a(2)+3);
    a12=str2num(a12);
    a13=sixth_line_sec(a(2)+4:a(3)+3);
    a13=str2num(a13)
    a14=sixth_line_sec(a(3)+4:a(4)+3);
    a14=str2num(a14);

    %know we have to find the entropy enthalpy and specific heat

    %entropy
    A=entropy(a1,a2,a3,a4,a5,a7,a8,a9,a10,a11,a12,a14,tempreture,globel_middle_tempreture,R);

    %enthalphy
    B=enthalphy(a1,a2,a3,a4,a5,a6,a8,a9,a10,a11,a12,a13,tempreture,globel_middle_tempreture,R)

    %specific heat
     C=speciofic_heat(a1,a2,a3,a4,a5,a8,a9,a10,a11,a12,tempreture,globel_middle_tempreture,R)

     %know for moleculer weigth
      molecular_w(i) = molecular_weight(species_name)

      %writting the moleculer weight into a file

      molecular_weight_of_the_species=fopen('molecular_weight.txt','w');

     fprintf(molecular_weight_of_the_species,'molecular_weight_of_the_species is %s is %f',species_name,molecular_w);
     fprintf(molecular_weight_of_the_species,'/n');
     fclose( molecular_weight_of_the_species)

     %making a file
     derectory_curr=pwd;
     mkdir(species_name);
     cd(species_name);

     %plotting
     %tempreture vs entropy
     figure(1)
     plot(tempreture,A,'color','r',LineWidth=2)
     xlabel('tempreturess')
     ylabel('entropys')
     grid on
     title(sprintf('variation in entropy wrt tempreture is %s',species_name))
     saveas(figure(1),'entrogy.jpg')

     %tempreture vs enthalpy
     figure(2)
     plot(tempreture,B,'color','b',LineWidth=2)
     xlabel('tempreture')
     ylabel('enthalpy')
     grid on
     title(sprintf('variation in enthalpy wrt tempreture %s',species_name))
     saveas(figure(2),'enthalpy.jpg')

     %tempreture vs entropy
     figure(3)
     plot(tempreture,C,'color','k',LineWidth=2)
     xlabel('tempreture')
     ylabel('specific_heat')
     grid on
     title(sprintf('variation in specific heat wrt tempreture %s',species_name))
     saveas(figure(3),'specificheat.jpg')
     cd(derectory_curr)
end
code for entrophy:
%% writting the function for enthalphy
function [B]=enthalphy(a1,a2,a3,a4,a5,a6,a8,a9,a10,a11,a12,a13,tempreture,globel_middel_temp,R)
%as mensioned in the question 1st 7 coeeficents are high temp and secound 7
%coefficents are low tempreture
% creating loop to divede this cofficents
if (tempreture>=globel_middel_temp)
    B=R.*tempreture.*(a1+(a2.*tempreture/2)+(a3.*(tempreture).^2/3)+(a4.*(tempreture).^3/4)+(a5.*(tempreture).^4/5)+(a6.*(tempreture).^5/6));
else
    B=R.*tempreture.*(a8+(a9.*tempreture/2)+(a10.*(tempreture).^2/3)+(a11.*(tempreture).^3/4)+(a12.*(tempreture).^4/5)+(a13.*(tempreture).^5/6));
end
end
code for enthalphy:
% writting the function for entropy
function [A]=entropy(a1,a2,a3,a4,a5,a7,a8,a9,a10,a11,a12,a14,tempreture,globel_middel_temp,R)
%as mensioned in the question 1st 7 coeeficents are high temp and secound 7
%coefficents are low tempreture
% creating loop to divede this cofficents

if (tempreture>=globel_middel_temp)
    A=R*(a1.*log(tempretur)+a2.*(tempreture)+(a3.*(tempreture).^2/2)+(a4.*(tempreture.^3)/3)+(a5.*(tempreture).^4/4)+a7);
else
    A=R.*(a8.*log(tempreture)+a9.*(tempreture)+(a10.*(tempreture).^2/2)+(a11.*(tempreture.^3)/3)+(a12.*(tempreture).^4/4)+a14);
end


end
code for specific heat:
%% writting the function for enthalphy
function [C]=speciofic_heat(a1,a2,a3,a4,a5,a8,a9,a10,a11,a12,tempreture,globel_middel_temp,R)
%as mensioned in the question 1st 7 coeeficents are high temp and secound 7
%coefficents are low tempreture
% creating loop to divede this cofficents
if (tempreture>=globel_middel_temp)
    C=R.*(a1+(a2.*(tempreture))+(a3.*(tempreture).^2)+(a4.*(tempreture).^3)+(a5.*(tempreture).^4));
else

C=R.*(a8+(a9.*(tempreture))+(a10.*(tempreture).^2)+(a11.*(tempreture).^3)+(a12.*(tempreture).^4));
end
end
code for molecular weight
function molecular_w = molecular_weight(species_name)
%creating array of elements
key_possion=['O','H','C','N','A']
%storing the atomic mass into an array

compounds_value= [15.999,1.008,12.011,14.007,39.948];
molecular_w= 0;
%creating the loop

for i = 1:length(species_name)
    for j = 1:length(key_possion)
        if strcmp(species_name(i),key_possion(j))
            %if above statement is truw then calculate

            molecular_w= molecular_w+compounds_value(j);
            poss = j;

        end
    end
    %converting the string into the number
    K= str2num(species_name(i));
    %comparing if the value for K is greter then excicuted the further
    %statements

    if (K>1)
       molecular_w = molecular_w+compounds_value(j)*(K-1);
    end
    fprintf('molecular weight of the species %s',species_name)
    fprintf('%f',molecular_w)
    disp(' ')
end
Explanetion:
- first we have to start the code by writting the clear all, close all,clc
- then we have to use the fopen command to open the file
- we have to use the command fgetl to read the data present inside the file
- then we have to read the dat present in it the we have to use the strsplit command to split the data present in geader line of the file
- after that we have to define the gas constant R then we have define the range for tempreture
- after that we have to wright the function for enthalphy,entrophy,specifiv heat and molecular weight of the components
- then we have to call this function in our main program
- then we have to plot the graphs for tempreture vs enthalphy,entrophy,specific heat and molecular weight
- then we have to creat a folder to add this details of all the species in to it.
outputs:
output for O:
code for co2
output of current window:

moleculer weight of the species: