Project 1 - Parsing NASA thermodynamic data
Project 1: NASA Thermodynamic data file parsing in MATLAB.
Aim:
1. To write a MATLAB code that extracts the 14 co-efficients and calculates the enthalpy, entropy and specific heats for all the species in the data file. By reading the file NASA thermodynamic data(using fopen and fgetl). The formulae are shown below.
Here R is the universal gas constant, T is the temeprature
The FIRST 7 coefficients are HIGH-temperature coefficients and the SECOND 7 coefficients are LOW-temperature coefficients.
Also use the LOCAL TEMPERATURE RANGES which is unique for each individual species, not the GLOBAL TEMPERATURE RANGE.
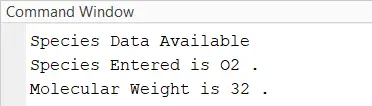
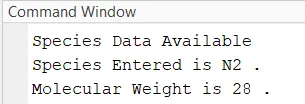
2. To calculate the molecular weight of each species and to display it in the command window.
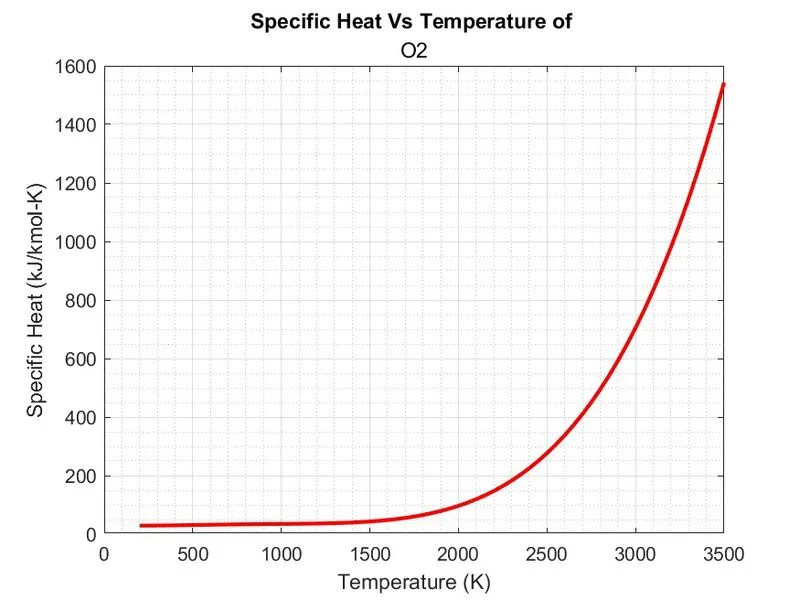
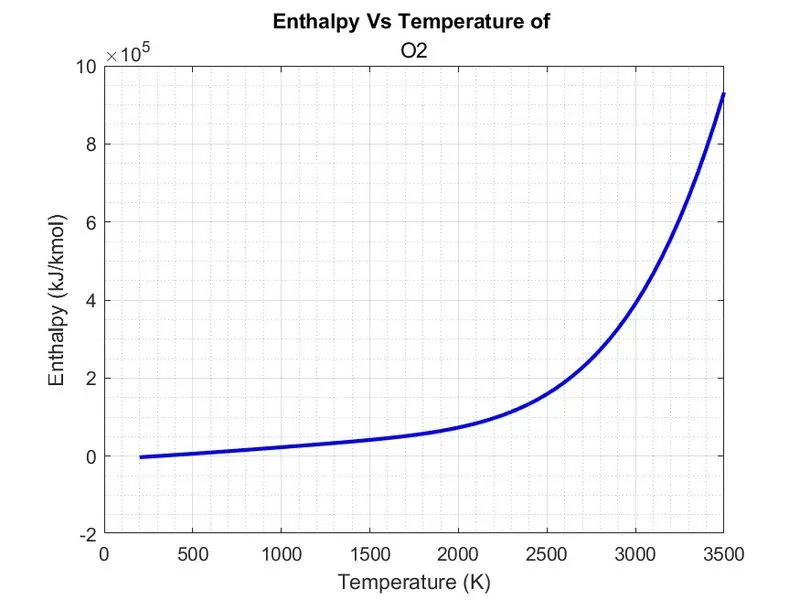
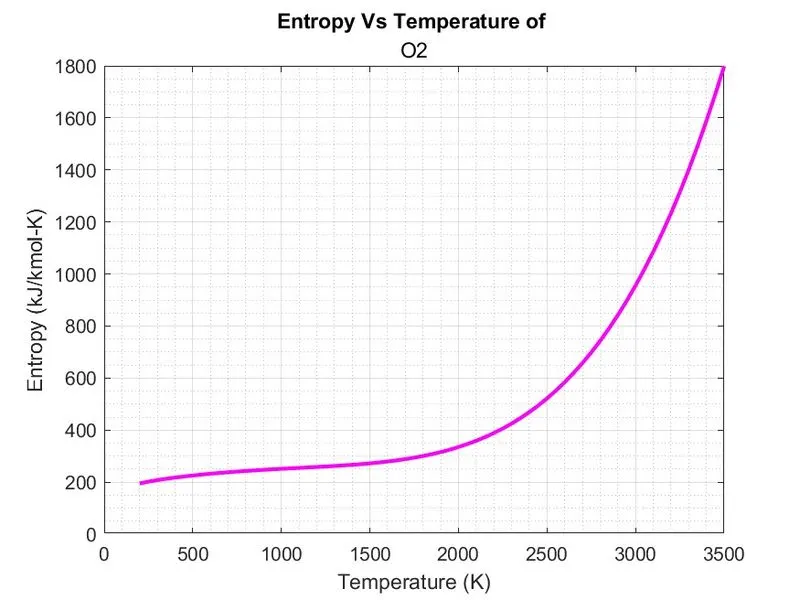
3. To plot the Specific Heat, Enthalpy and Entropy for the local temperature range (low temperature : high temperature) specific for each species.
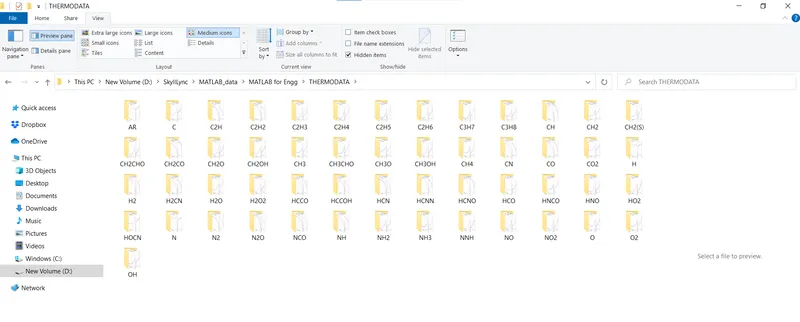
4. To save the plots as images with appropriate names and dump them in separate folders for each species with suitable name. All these should be generated automatically.
The input to the code should be only the NASA Thermodynamic data file i.e. `"THERMO.dat"`.
Steps to write a required program:
- The code has been started with commands to close all previously open plots , to clear work space and to clean command window.
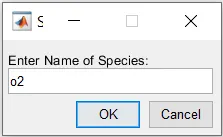
- The required inputs have been given with the help of code.
- The respective data file is opened using fopen command.
- The header of the file has been read using fgetl command.
- The Global temperature ranges have been read and converted to number using strsplit and str2num commands.
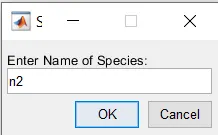
- Obtain the Species name through input dialog box using inputdlg command. Make it uppercase to eliminate case sensitivity using upper command.
- Using while loop to read the file till the end of file. The next lines of the file are read through fgetl command and the same has been split to the species name and local temperature ranges as string using strsplit command.
- The strings of input specied name and the species name from line of file are compared using strcmpi command to idetify the location of species data into the data file.
- At the same time the code is wrtitten such way that if species data is not found in the file it will give the output message regrding the same.
- For successful match of the species name between input and data from file. The local temperature ranges strings are converted to the numbers and the first, second and third line of coefficients using str2num command.
- Here from the observation of data file it has been found that there are 14 coefficients written into three lines of code. Each coefficient has 15 characters of space allocation into the string. Thus same have been read and converted to numbers.
- After finding all 14 coefficients the function has been written to calculate the molecular weight. Explained as below.
- A character array is defined for the atoms and array of atomic weights respective to character array is defined.
- The input string is compared with character array, when a match occurs, associated atomic weight is taken.
- For molecules having numbers defining the number of atoms, that number is first extracted, and calculation is made to account for multiple atomic weights.
- A seperate variable is assigned to store the output value of the function.
- Similarly functions to calculate Specific Heat (`C_p`), Enthalpy(`h`) and Entropy(`s`)have been written.
- Since the coefficients available in data file are temperature dependent, thus if condition is used to calculate high temperature properties with first 7 coefficients and low temperature properties with next 7 coefficients.
- The Plots of the calculated property data are plotted with the temperatures.
- The same plots have been saved to seprated folder for each species.
- The required screenshots and output plots are represented here.
MATLAB Code:
% Thermo data file parsing
close all;
clear all;
clc;

R = 8.314; % Universal Gas constant kJ/kmol-K

f1=fopen('THERMO.dat','r');                  % Opening data file
fgetl(f1);                                   % Reading First line
a = strsplit(fgetl(f1),' ');                 % Reading and Splitting second line for Global temp ranges
global_low_temp = str2num(a{2});             % Converting string to number for Global low temp
global_mid_temp = str2num(a{3});             % Converting string to number for Global medium temp
global_high_temp= str2num(a{4});             % Converting string to number for Global high temp

fgetl(f1);                                   % Reading file Header lines
fgetl(f1);
fgetl(f1);

get1 = inputdlg('Enter Name of Species: ','Species Name');  % Taking Spacies name as input through dialog box
get = upper(get1{1});                        % Converting input string to uppercase string

while ~feof(f1)                              % While loop till the end of data
    tline1=fgetl(f1);                        % Reading line for Species Name and Local temp ranges
    b = strsplit(tline1,' ');                % Spliting the above string
    eb = length(b);                          % Reading length of splitted string
    species= b(1);                           % Reading species name as string from the line

    match1=strcmpi(species,'END');           % match 1 for Comparing input string with 'END' string to mark the end of file
    match = strcmpi(species,get);            % match for Comparing input string with read species name string
    if match1 == 1                           % If loop with compared results of match1
      disp('Species Data Not Available');    % if matched to display results as Species not found
    elseif match == 1                        %  elseif with compared results of match
            disp('Species Data Available');  % if matched then to display results as Species found

            local_low_temp = str2num(b{eb-3});  % Converting string to number for Local low temp
            local_mid_temp = str2num(b{eb-1});  % Converting string to number for Local medium temp
            local_high_temp = str2num(b{eb-2}); % Converting string to number for Local high temp

            tline2=fgetl(f1);                   % Reading first line of coefficients for matched species
            c = findstr(tline2,'E');            % Finding string 'E' in the coeff's
                                                % There are 5 coeffs in 1st line with 15 characters each
            a1=str2num(tline2(1:15));           % Reading first coeff with str2num using 15 characters
            a2=str2num(tline2(16:30));          % Reading second coeff with str2num using 15 characters
            a3=str2num(tline2(31:45));          % Reading third coeff with str2num using 15 characters
            a4=str2num(tline2(46:60));          % Reading fourth coeff with str2num using 15 characters
            a5=str2num(tline2(61:75));          % Reading fifth coeff with str2num using 15 characters

            tline3=fgetl(f1);                   % Reading second line of coefficients for matched species
            d = findstr(tline3,'E');            % Finding string 'E' in the coeff's
                                                % There are 5 coeffs in 2nd line with 15 characters each
            a6=str2num(tline3(1:15));           % Reading sixth coeff with str2num using 15 characters
            a7=str2num(tline3(16:30));          % Reading seventh coeff with str2num using 15 characters
            a8=str2num(tline3(31:45));          % Reading eighth coeff with str2num using 15 characters
            a9=str2num(tline3(46:60));          % Reading ninth coeff with str2num using 15 characters
            a10=str2num(tline3(61:75));         % Reading tenth coeff with str2num using 15 characters

            tline4=fgetl(f1);                   % Reading third line of coefficients for matched species
            e = findstr(tline4,'E');            % Finding string 'E' in the coeff's
                                                % There are 4 coeffs in 3rd line with 15 characters each
            a11=str2num(tline4(1:15));          % Reading 11th coeff with str2num using 15 characters
            a12=str2num(tline4(16:30));         % Reading 12th coeff with str2num using 15 characters
            a13=str2num(tline4(31:45));         % Reading 13th coeff with str2num using 15 characters
            a14=str2num(tline4(46:60));         % Reading 14th coeff with str2num using 15 characters

            break                               % Breaking if loop

    else                                        % if match results are mismatched for match
            fgetl(f1);                          % Reading next 3 lines as 4 lines belong to a single species
            fgetl(f1);
            fgetl(f1);

    end                                         % Ending if loop
end                                             % Ending while loop


    mol_wt = molecular_weight(get);                 % Calculating molecular weight with function molecular_weight
    text1 = sprintf('Species Entered is %s .',get); % Making text1 for Species entered message
    disp (text1);                                   % Display text1

    text2 = sprintf('Molecular Weight is %d .',mol_wt);   % Making text2 for Species - Molecular weight message
    disp (text2)                                          % Display text2

if match == 1                                        % If loop to calculate Cp, h and s using functions & Plot the results
    TempR = (local_low_temp:50:local_high_temp);          % Declaring Temperature range array

    %Specific Heat Calculation using function specific_heat
    Cp=specific_heat(a1,a2,a3,a4,a5,a8,a9,a10,a11,a12,local_mid_temp,TempR,R);

    %Enthalpy Calculation using function enthalpy
    H=enthalpy(a1,a2,a3,a4,a5,a6,a8,a9,a10,a11,a12,a13,local_mid_temp,TempR,R);

    %Entropy Calculation using function entropy
    S=entropy(a1,a2,a3,a4,a5,a7,a8,a9,a10,a11,a12,a14,local_mid_temp,TempR,R);

    mkdir('THERMODATA'); % Making new directory
    cur_dir = pwd ;      % Saving current path
    cd ('THERMODATA');   % Getting into the newly created directory
    mkdir(get);          % Making subdirectory with species name
    cd (get);            % Getting into the subdirectory

    %Plotting
    figure(1)
    plot(TempR,Cp,'linewidth',2,'color','r');             % Specific Heat vs Temperature plot
    title('Specific Heat Vs Temperature of ',species);    % Plot title
    xlabel('Temperature (K)');                            % X axis label
    ylabel('Specific Heat (kJ/kmol-K)');                  % Y axis label
    grid on
    grid minor
    saveas(1,'Specific Heat Vs Temp','jpg')               % Saving Plot to subdirectory

    figure(2)
    plot(TempR,H,'linewidth',2,'color','b');              % Enthalpy Vs Temperature plot
    title('Enthalpy Vs Temperature of ',species);         % Plot title
    xlabel('Temperature (K)');                            % X axis label
    ylabel('Enthalpy (kJ/kmol)');                         % Y axis label
    grid on
    grid minor
    saveas(2,'Enthalpy Vs Temp','jpg')                    % Saving Plot to subdirectory

    figure(3)
    plot(TempR,S,'linewidth',2,'color','m');             % Entropy Vs Temperature Plot
    title('Entropy Vs Temperature of ',species);         % Plot title
    xlabel('Temperature (K)');                           % X axis label
    ylabel('Entropy (kJ/kmol-K)');                       % Y axis label
    grid on
    grid minor
    saveas(3,'Entropy Vs Temp','jpg')                    % Saving Plot to subdirectory

    cd (cur_dir);                                        % Returning to current directory
    fclose('all');                                       % Closing datafile
end
function code : molecular_weight.m
function [M]=molecular_weight(s)
n=length(s);                          % Measuring the string length for Enetered Species name
elem = ['H','C','N','O','A','S'];     % Elements array
mass = [1,12,14,16,40,32];            % Atomic weigth array
wt=0;                                 % Molecular weight intialised to 0
for i=1:n                             % Outer For loop for calculating molecular weight
    for j=1:length(elem)              % Inner For loop for calculating molecular weight
        if strcmpi(s(i),elem(j))      % Comparing string with elements symbol array through if loop
            wt = wt + mass(j);        % Calculating molecular weight
            y=j;                      % saving element index from the array
        end                           % Ending if loop
    end                               % Ending for loop
    num=str2num(s(i));                % converting string to number if string is not a element
    if (num > 1)
        wt = wt + (mass(y)*(num-1));  % if loop to check if number is greater than 1 then add extra weight
    end
    M=wt;                             % Final molecular weight
end                                   % Ending for loop

end
function code: specific_heat.m
function [Cp]=specific_heat(a1,a2,a3,a4,a5,a8,a9,a10,a11,a12,local_mid_temp,TempR,R)

   if (TempR>local_mid_temp) % if loop to check if temp from range array is less than local medium temp
       Cp = R*(a1+(a2*TempR)+(a3*TempR.^2)+(a4*TempR.^3)+(a5*TempR.^4)); % Calculating high temp cp
   else
       Cp = R*(a8+(a9*TempR)+(a10*TempR.^2)+(a11*TempR.^3)+(a12*TempR.^4)); % Calculating low temp cp
   end

end
function code: enthalpy.m
function [H]=enthalpy(a1,a2,a3,a4,a5,a6,a8,a9,a10,a11,a12,a13,local_mid_temp,TempR,R)

   if (TempR>local_mid_temp)% if loop to check if temp from range array is less than local medium temp
       H = R.*TempR.*(a1+((a2/2)*TempR)+((a3/3)*TempR.^2)+((a4/4)*TempR.^3)+((a5/5)*TempR.^4)+(a6./TempR)); % Calculating high temp enthalpy
   else
       H = R.*TempR.*(a8+((a9/2)*TempR)+((a10/3)*TempR.^2)+((a11/4)*TempR.^3)+((a12/5)*TempR.^4)+(a13./TempR)); % Calculating low temp enthalpy
   end

end
function code: entropy.m
function [S]=entropy(a1,a2,a3,a4,a5,a7,a8,a9,a10,a11,a12,a14,local_mid_temp,TempR,R)

   if (TempR>local_mid_temp)% if loop to check if temp from range array is less than local medium temp
       S = R*((a1*log(TempR))+(a2*TempR)+(a3*TempR.^2)+(a4*TempR.^3)+(a5*TempR.^4)+(a7)); % Calculating high temp entropy
   else
       S = R*((a8*log(TempR))+(a9*TempR)+(a10*TempR.^2)+(a11*TempR.^3)+(a12*TempR.^4)+(a14)); % Calculating low temp entropy
   end

end
Screenshot of the Folder THERMODATA:
Species `O_2`: Input dialog box and output in command window.
- Plot Specific Heat Capacity Vs Temperature (`O_2`):
- Plot Specific Enthalpy Vs Temperature (`O_2`):
- Plot Specific Entropy Vs Temperature (`O_2`):
Species `N_2 : Input dialog box and output in command window.
- Plot Specific Heat Capacity Vs Temperature (`N_2`):
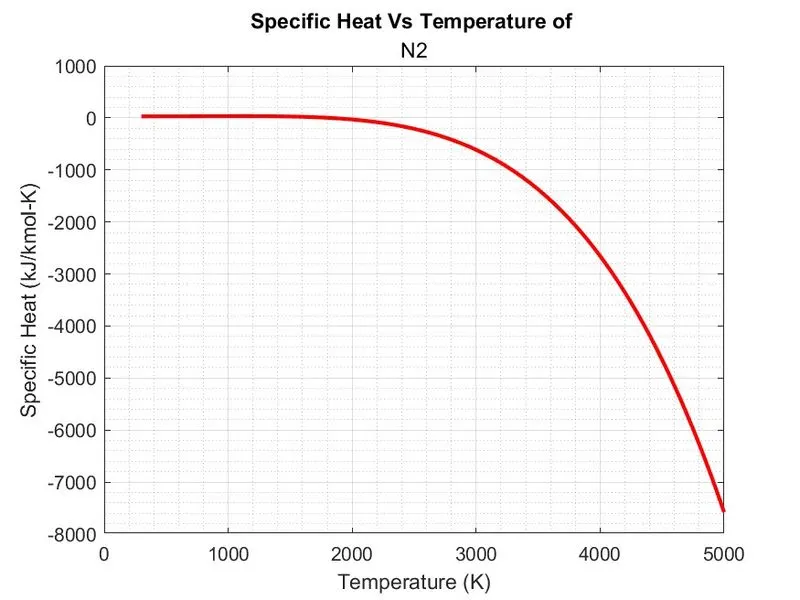
- Plot Specific Enthalpy Vs Temperature (`N_2`):
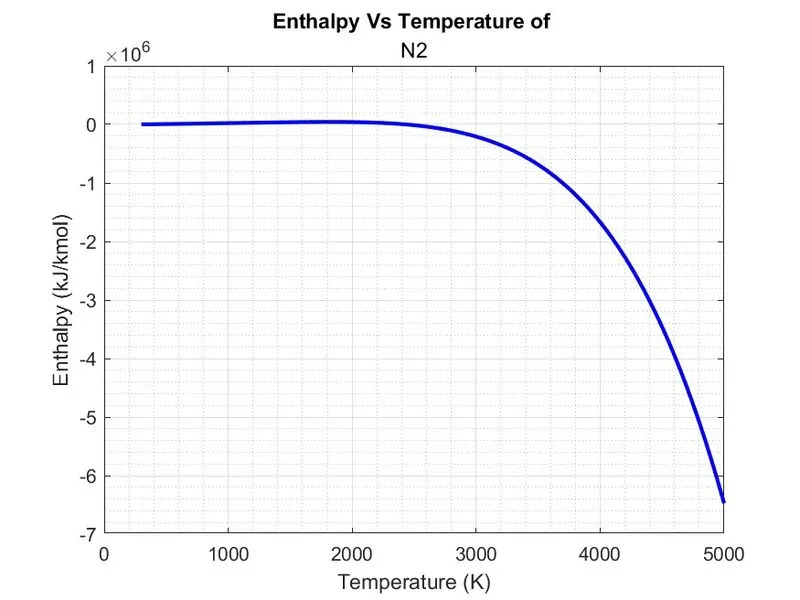
- Plot Specific Entropy Vs Temperature (`N_2`):
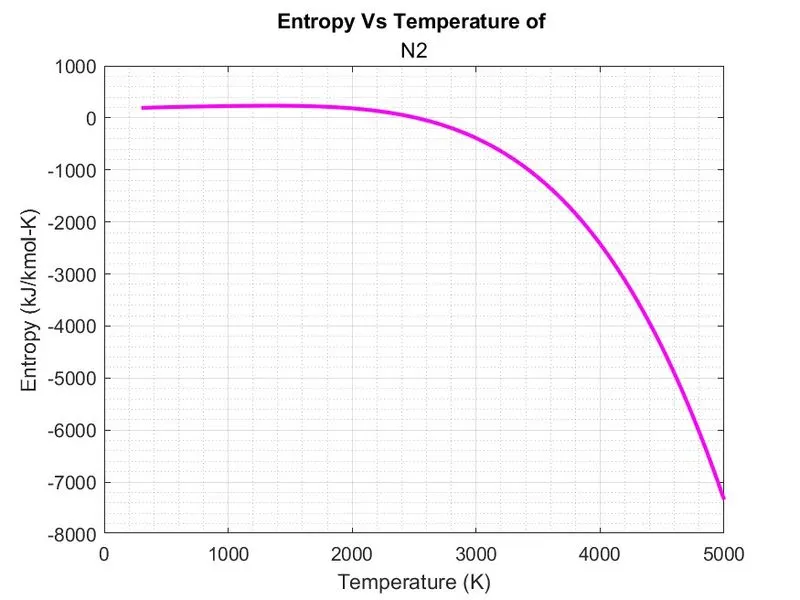
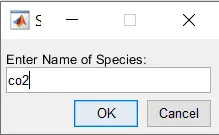
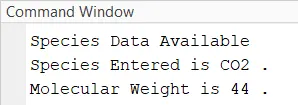
Species `CO_2` : Input dialog box and output in command window.
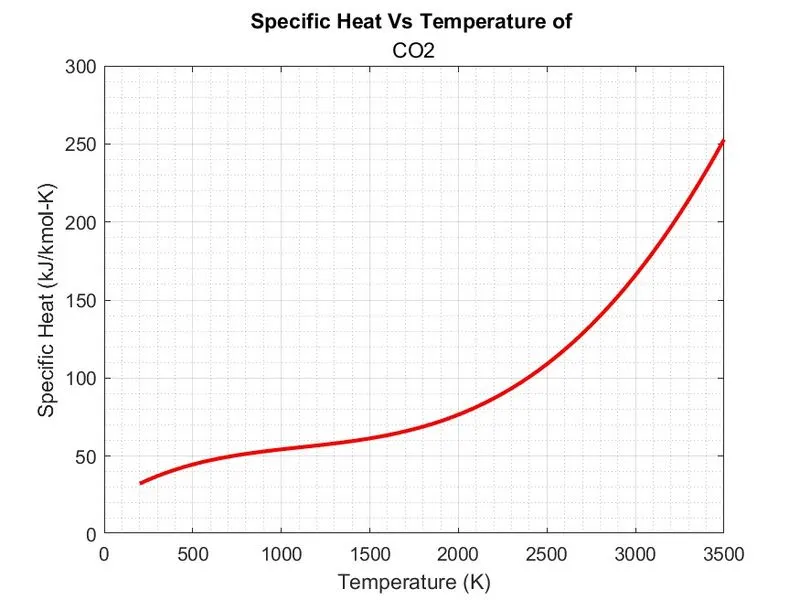
- Plot Specific Heat Capacity Vs Temperature (`CO_2`):
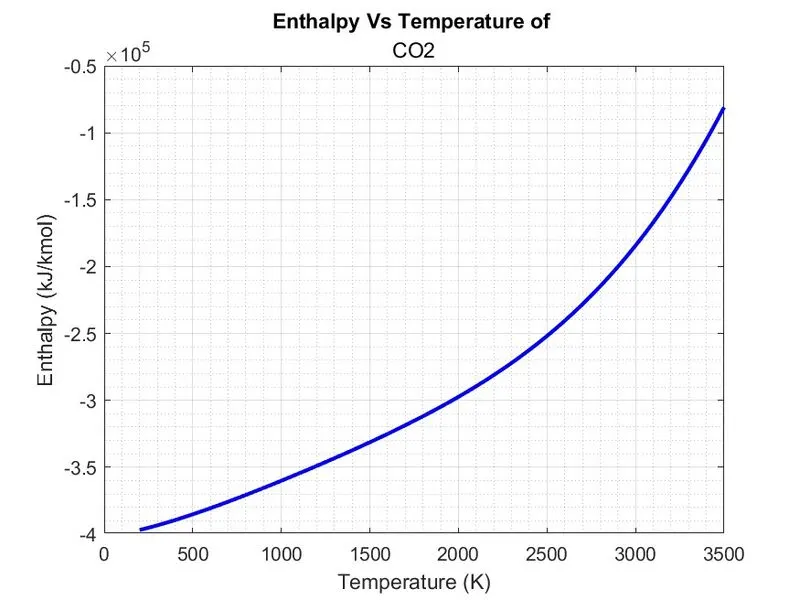
- Plot Specific Enthalpy Vs Temperature (`CO_2`):
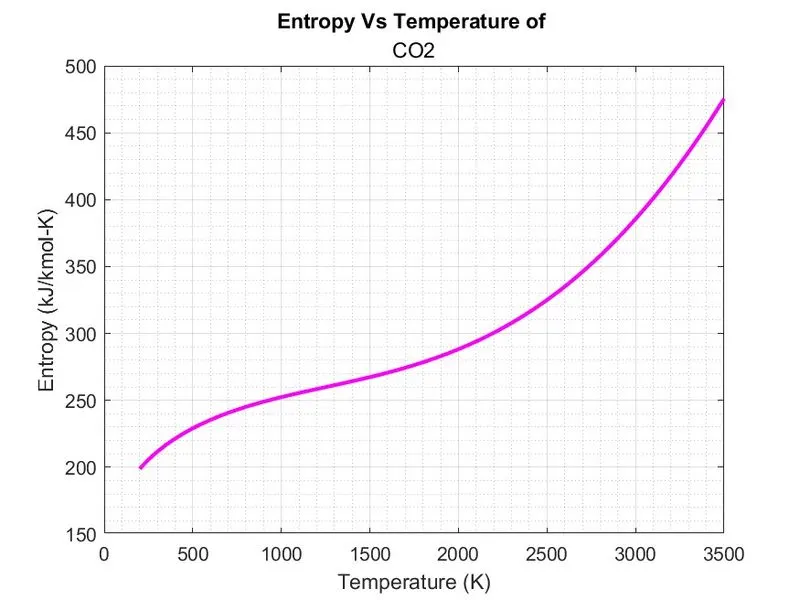
- Plot Specific Entropy Vs Temperature (`CO_2`):
Conclusion:
Thus the NASA thermodynamic data file is successfully parsed using MATLAB and the required data has been successfully extracted.