Project 1 - Parsing NASA thermodynamic data
Main Program:
clear all
close all
clc

% TO open the thermal data file
f1=fopen('THERMO.dat','r');

% get heading file
heading=fgetl(f1);


% Global Temperature Values
global_temp=fgetl(f1);
x=strsplit(global_temp);

global_low_temp=str2double(x{2});
global_mid_temp=str2double(x{3});
global_high_temp=str2double(x{4});
fgetl(f1)
fgetl(f1)
fgetl(f1)

% getting Local temperature information of individual species.
for i=1:53 % Running for a loop for every molecule
line1=fgetl(f1); % assigning the molecular data's 1st line from the file to species
species_name=line1(1:6); % assigning the species name from the 1st 6 elements of species array.

% Local temperature
local_temp1=line1(49:55);
low_temp=str2double(local_temp1);

local_temp2=line1(58:65)
mid_temp=str2double(local_temp2);

local_temp3=line1(68:75)
high_temp=str2double(local_temp3);

% To extract the coefficient values

line2=fgetl(f1);
line3=fgetl(f1);
line4=fgetl(f1);

a=strfind(line2,'E');
b=strfind(line3,'E');
c=strfind(line4,'E');

% Extracting the coefficient of high temperature.
a1=str2double(line2(1:a(1)+3));
a2=str2double(line2(a(1)+4:a(2)+3));
a3=str2double(line2(a(2)+4:a(3)+3));
a4=str2double(line2(a(3)+4:a(4)+3));
a5=str2double(line2(a(4)+4:a(5)+3));
a6=str2double(line3(1:b(1)+3));
a7=str2double(line3(b(1)+4:b(2)+3));

% Extracting the coefficient of Low temperature.
a8=str2double(line3(b(2)+4:b(3)+3));
a9=str2double(line3(b(3)+4:b(4)+3));
a10=str2double(line3(b(4)+4:b(5)+3));
a11=str2double(line4(1:c(1)+3));
a12=str2double(line4(c(1)+4:c(2)+3));
a13=str2double(line4(c(2)+4:c(3)+3));
a14=str2double(line4(c(3)+4:c(4)+3));

% Universal gas constant
R=8.314;
t=linspace(low_temp,high_temp,500);

% Calculating Specific heat
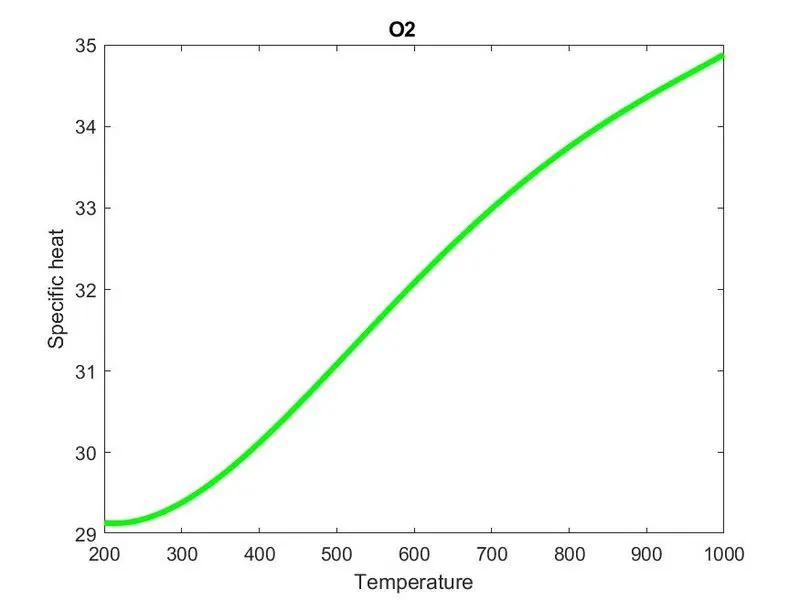
c_p=specific_heat(a1,a2,a3,a4,a5,a8,a9,a10,a11,a12,mid_temp,R,t);

% calculating enthalpy
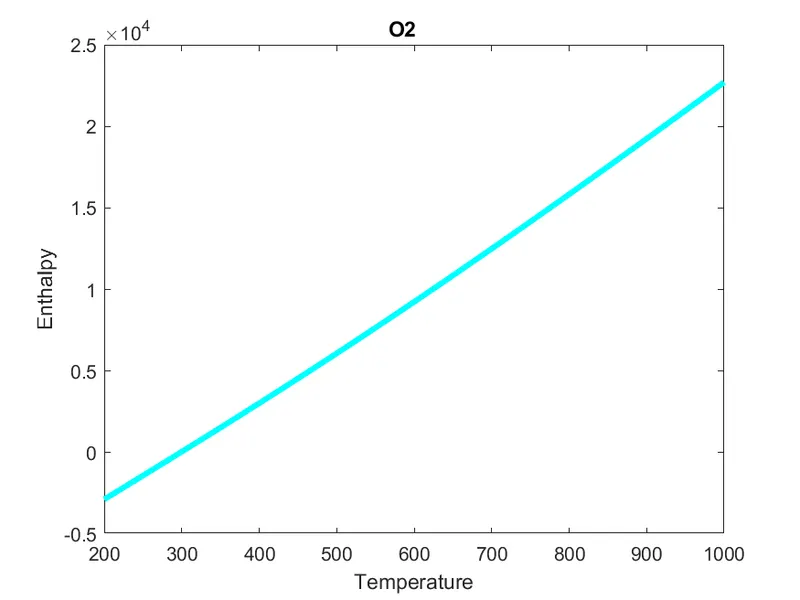
H=enthalpy(a1,a2,a3,a4,a5,a6,a8,a9,a10,a11,a12,a13,R,t,mid_temp);

% calculating entropy
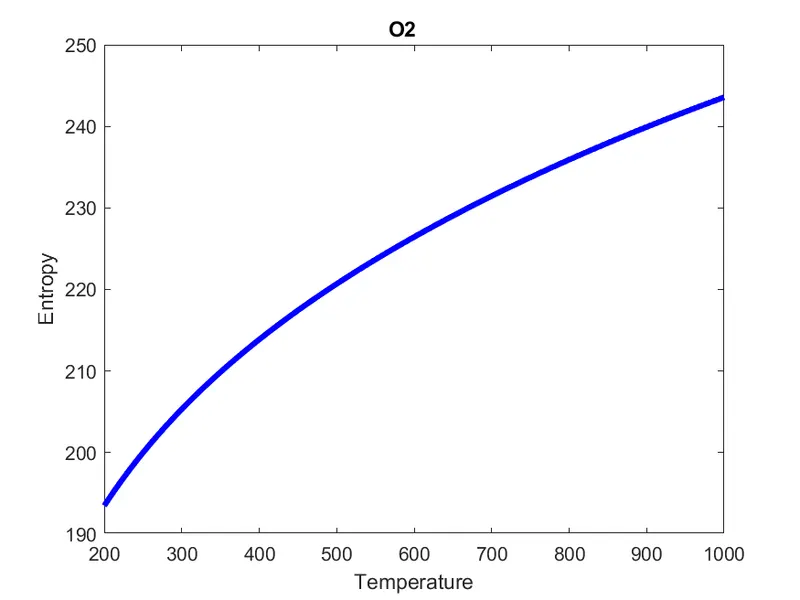
S=entropy(a1,a2,a3,a4,a5,a7,a8,a9,a10,a11,a12,a14,R,t,mid_temp);

% Creating folder
data=strcat('properties of .....',species_name);
mkdir(data);
file=pwd;

%plotting
figure(1)
plot(t,c_p,'linewidth',3,'color','g')
data1=strcat(species_name,'temperature vs specific heat');
xlabel('Temperature')
ylabel('Specific heat')
title(species_name)
f=fullfile(data)
cd(f);
saveas(1,[pwd '/Specific heat vs temperature.png'])
cd(file)

figure(2)
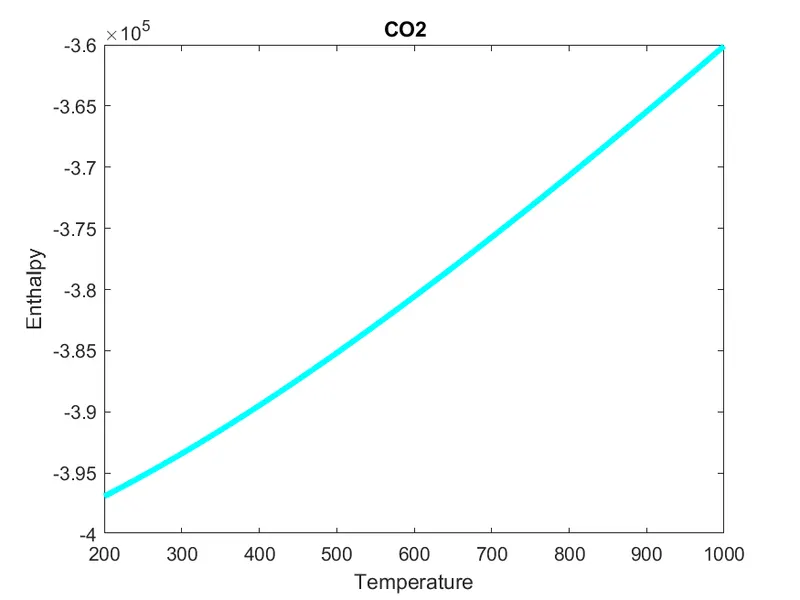
plot(t,H,'linewidth',3,'color','c')
data1=strcat(species_name,'temperature vs enthaloy');
xlabel('Temperature')
ylabel('Enthalpy')
title(species_name)
cd(f);
saveas(2,[pwd '/Enthalpy vs temperature.png'])
cd(file)

figure(3)
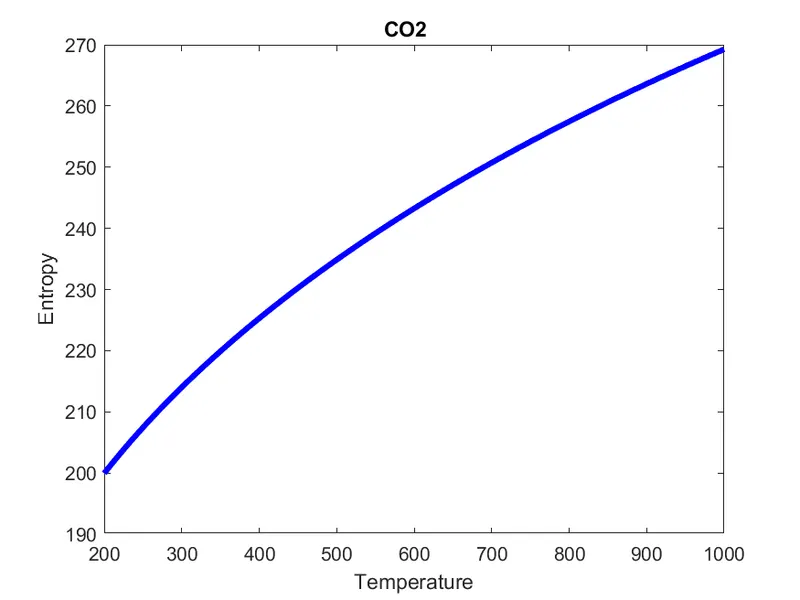
plot(t,S,'linewidth',3,'color','b')
data1=strcat(species_name,'temperature vs entropy');
xlabel('Temperature')
ylabel('Entropy')
title(species_name)
cd(f);
saveas(3, [pwd '/Entropy vs temperature.png'])
cd(file)

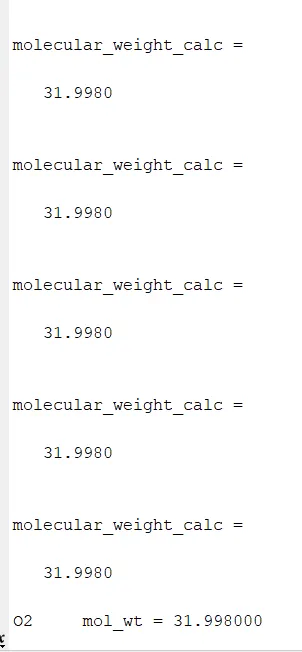
molecular_weight_calc=molecular_weight(species_name);
k=sprintf('%s mol_wt = %f',species_name,molecular_weight_calc);
disp(k)
end
fclose(f1)
Functional Program 1: Calculating thermodynamic Properties(Specific heat,enthalpy,entropy)
function c_p = specific_heat(a1,a2,a3,a4,a5,a8,a9,a10,a11,a12,mid_temp,R,t)
if t<=mid_temp
    c_p=(a8+a9.*t+a10.*t.^2+a11.*t.^3+a12.*t.^4).*R;
else
    c_p=(a1+a2.*t+a3.*t.^2+a4.*t.^3+a5.*t.^4).*R;
end
function H = enthalpy(a1,a2,a3,a4,a5,a6,a8,a9,a10,a11,a12,a13,R,t,mid_temp)
if t<=mid_temp
H=(a8+(a9.*t./2)+(a10.*t.^2/3)+(a11.*t.^3/4)+(a12.*t.^4/5)+(a13./t)).*R.*t;
else
H=(a1+(a2.*t/2)+(a3.*t.^2/3)+(a4.*t.^3/4)+(a5.*t.^4/5)+(a6./t)).*R.*t;
endfunction S = entropy(a1,a2,a3,a4,a5,a7,a8,a9,a10,a11,a12,a14,R,t,mid_temp)
if t<=mid_temp
S=(a8*log(t)+a9.*t+(a10.*t.^2/2)+(a11.*t.^3/3)+(a12.*t.^4/4)+a14).*R;
else
S=(a1*log(t)+a2.*t+(a3.*t^2/2)+(a4.*t.^3/3)+(a5.*t.^4/4)+a7).*R;
end
Functional Program 2: Calculating the molecular weight of species mentioned in data file.
function molecular_weight_calc=molecular_weight(species_name)
elements=['O','H','C','N','A'];
atomic_mass=[15.999,1.008,12.011,14.007,39.948];
mol_wt=0;
for i=1:length(species_name)
    for j=1:length(elements)
        if strcmpi(species_name(i),elements(j))
            mol_wt=mol_wt+atomic_mass(j);
            z=j;
        end
    end
    t=str2num(species_name(i));
    if(t>1)
        mol_wt=mol_wt+(atomic_mass(z)*(t-1));
    end
    molecular_weight_calc=mol_wt
end
Commands Used:
fopen- used to open the data file from the folder.
fgetl- used to read the required data and also to skip the data.
strsplit-string splitting, used to split the string in to number of words.
str2num-string to number,used to convert the string into numbers.
strfind-used to find the letter or a number in the data.
mkdir- used to create a folder.
saveas-used to save the plots as images.
CODE EXPLANATION:
- Opening and reading the given data from the folder using fopen command.
- fgetl is used to read the file and skip the file.
- the global temperature data can be stored in after header.
- strsplit comand is used to get the string splitted.
- giving max,med and min ranges to the temperature by finding it in data.
- inorder to obtain the first objective of finding the co-efficients(a1-a14)
- a loop is created for 1:53, because we are having 53 species in the data .
- obtain the header by extracting the first line.
- the global temp ranges are extracted by using str2double command.
- all species names and temp ranges are available in the header line.
- linspace command is used to obtain an array of local_min_temp to the local_max_temp.
- the corresponding equations to find cp,H and S is put inside a loop along with if else statement according to the temp greater or lessthan local medium temp.
- the high temp and low temp coefficients are obtained ,thus the cp,H and S can be finded easily.
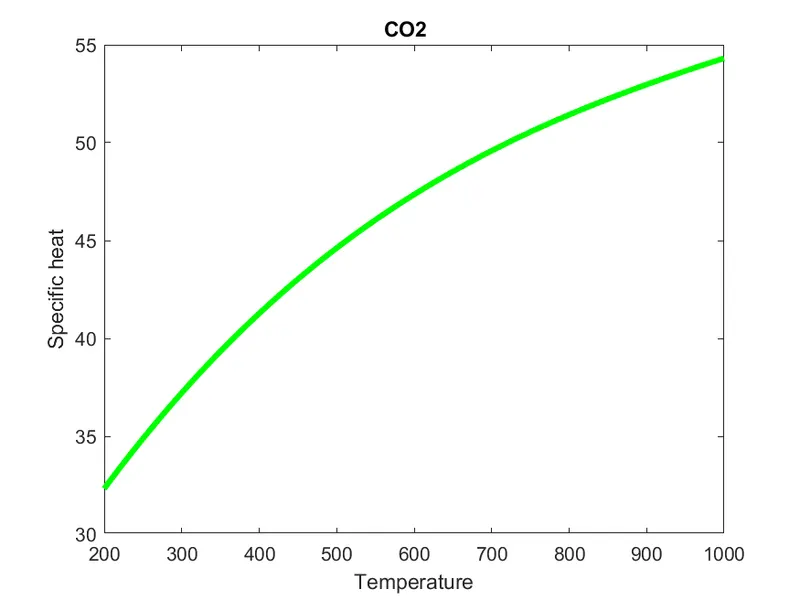
- plotting the cp v/s temp, H v/s temp and S v/s temp using plot command
- the corresponding x and y labels, titles and figure number is given in each case
- this will take part inside the previous loop and thus the curve will ploted for each 53 species.
- saveas command is used to save the curve as images.
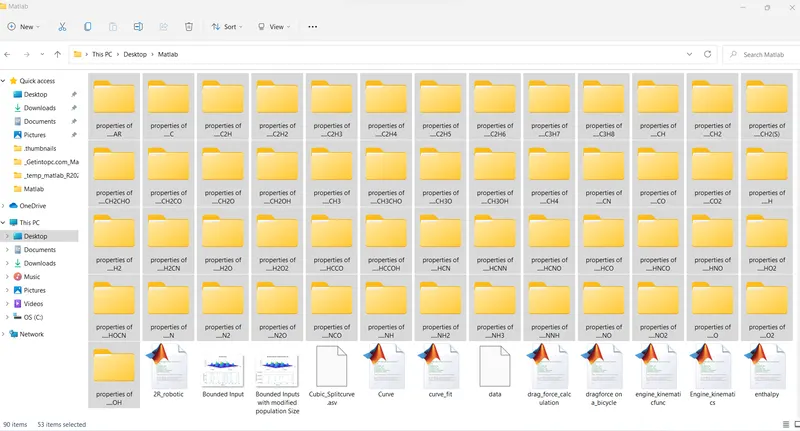
- folder is created using mkdir command
- and thus the 3 plot for each 53 species areobtained and saves in the corresponding species folder.
Plots for O2:
Plots for N2:
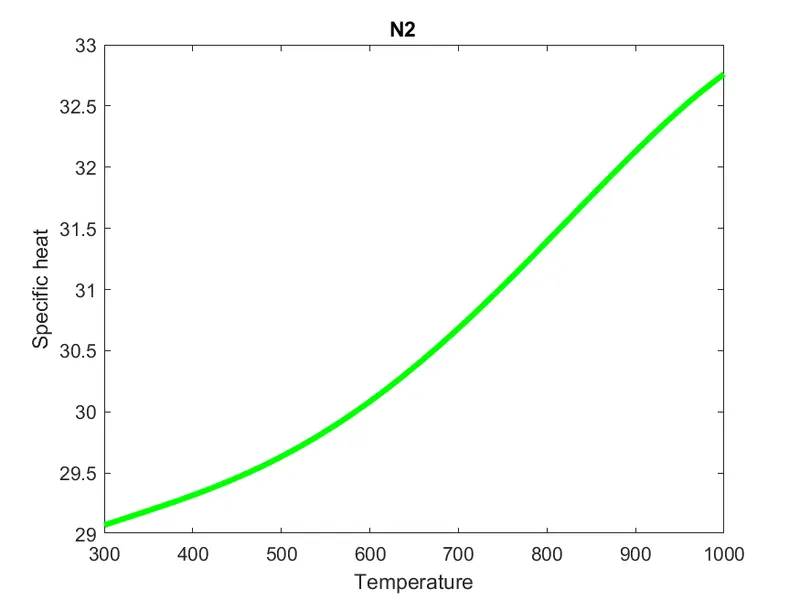
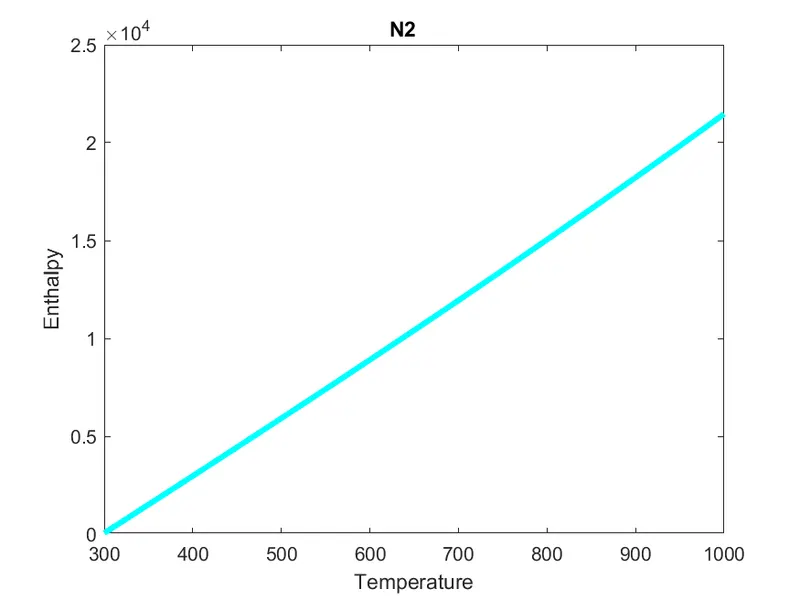
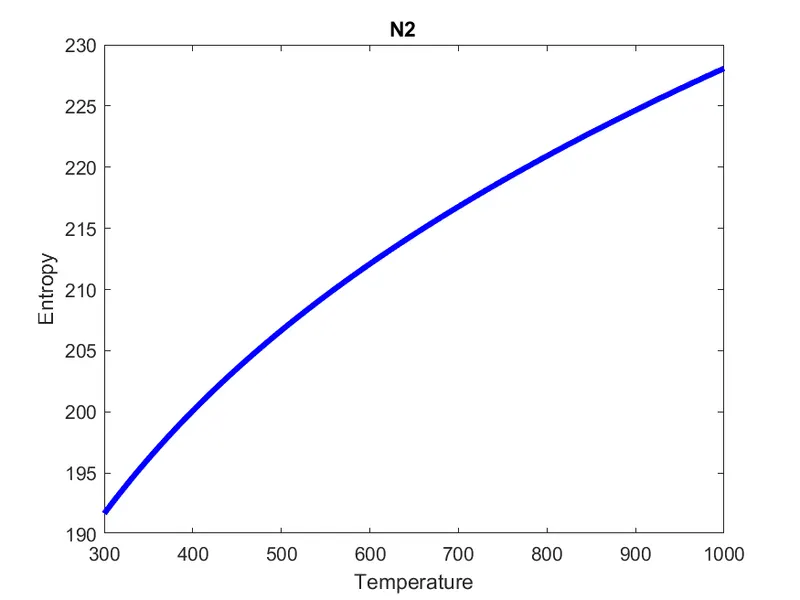
Plots for CO2:
Files of Individual Species:
Molecular weight of 'O':
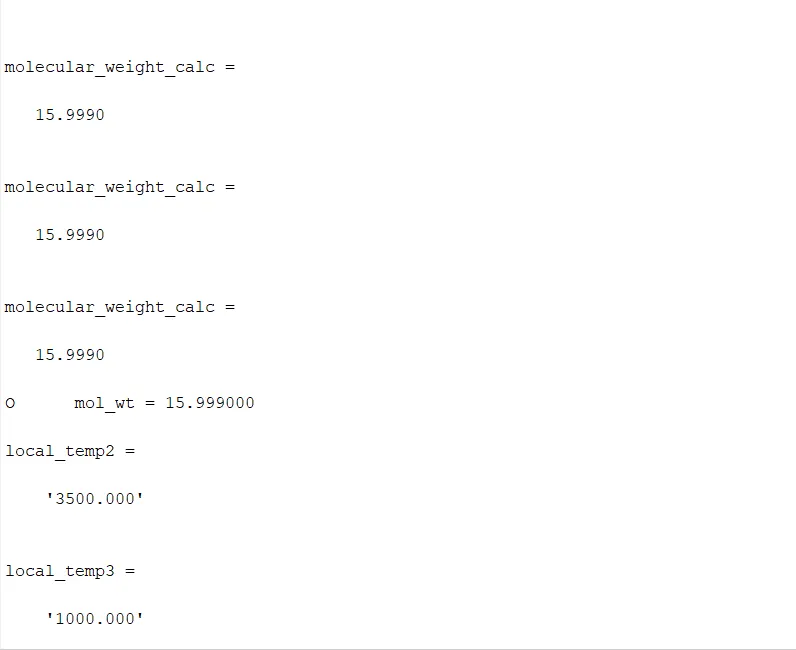
Molecular weight of 'O2':