Project 1 - Parsing NASA thermodynamic data
AIM:
Extracting data from Nasa unreadable file and converting it into readable data to find any information from the data.
OBJECTIVES:
1. Write a function that extracts the 14 co-efficients and calculates the enthalpy, entropy and specific heats for all the species in the data file.
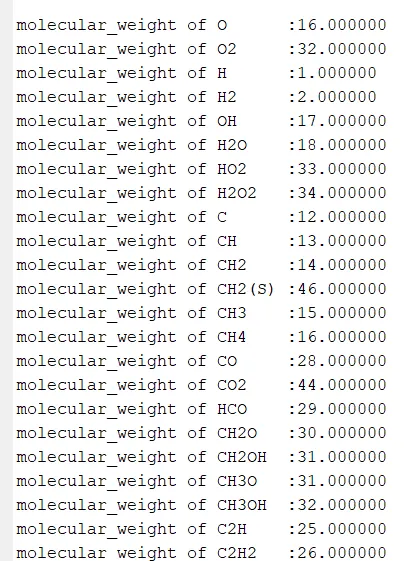
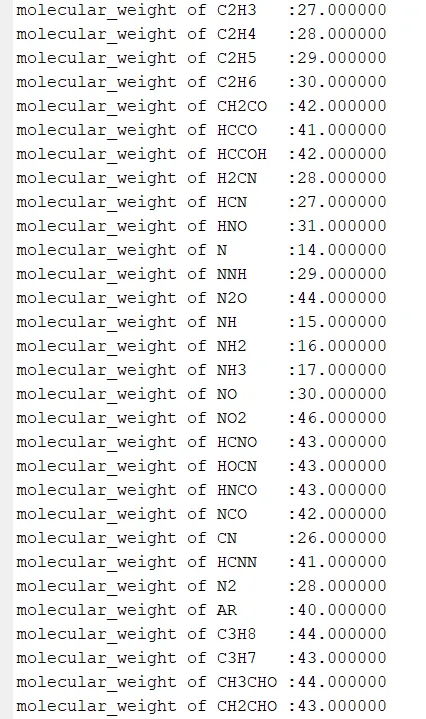
2. Calculate the molecular weight of each species and display it in the command window.
3. Plot the Cp, Enthalpy and Entropy for the local temperature range (low temperature : high temperature) specific for each species.
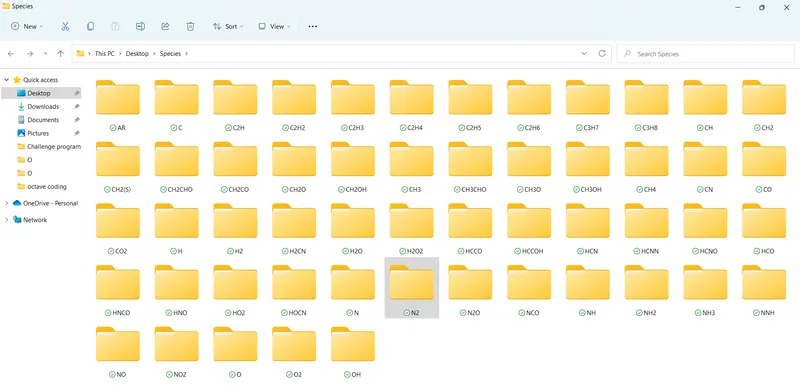
4. Save the plots as images with appropriate names and dump them in separate folders for each species with suitable name. All these should be generated automatically.
INTRODUCTION:
File Parsing is the process of converting illogical data into logical data. This parsing process can be achieved by using MATLAB software. In general, the term parsing refers to the Matlab to reading a m-file which will later translate into an internal code inside the Matlab. By using certain commands we could read and manipulate those data as we needed.
Here, we will use the extracted data to calculate Enthalpy, Entropy, and Specific heat for the given species and find the molecular weight for each species. Once these parameters were found, Plot those parameters to get a graphical view of the data.
Finally, we will be storing the plots for Enthalpy, Entropy ,and Specific heat for each species.
Formulas used to calculate Cp,H and S:

Cp-Specific Heat(J / K-Kg)
H- Enthalpy (J)
S-Entropy(J/K)
R-Universal gas constant (J/mol-k)
T-Temperate(k)
Via of these formulas, the Specific heat, Entropy, and Enthalpy can determine.
To calculate the molecular weight, we need to formulate a formula for molecular weight which is Molecular_weigh=(Atomic number)*(Atomic weight).
FUNCTION COMMAND CODING FOR (THERMAL PROPERITIES):
function [Cp,H,S]=co_eff(T,R,Tm1,c1,c2,c3,c4,c5,c6,c7,c8,c9,c10,c11,c12,c13,c14);

for i = 1:length(T)
    if T(i)>Tm1

        Cp=(c1 + c2.*T + c3.*T.^2+ c4.*T.^3 +c5.*T.^4).*R;
        H=(c1 + (c2.*T)./2 + (c3.*T.^2)./3 + (c4.*T.^3)./4+(c5.*T.^4)./5 + c6./T).*T.*R;
        S=(c1.*log(T)+c2.*T+(c3.*T.^2)./2 + (c4.*T.^3)./3 + (c5.*T.^4)./4+c7).*R;

    else

         Cp=(c8 + c9.*T + c10.*T.^2+ c11.*T.^3 +c12.*T.^4).*R;
        H=(c8 + (c9.*T)./2 + (c10.*T.^2)./3 + (c11.*T.^3)./4+(c12.*T.^4)./5 + c13./T).*T.*R;
        S=(c8.*log(T)+c9.*T+(c10.*T.^2)./2 + (c11.*T.^3)./3 + (c12.*T.^4)./4+c14).*R;

    end
end
end
Procedure:
By using this command function for thermal properties we could find the values for specific heat, enthalpy, and entropy by slightly modifying the given formula.
The term R defines a gas constant which has a value of 8.314.
The T value is used to assign the value for loop to repeat the program for certain times and 'if' command compare the temp.
If the temp is less than the given values then it will run a particular code or else it will run the code which is below the else command.
End commands are used to close the if command,function command, and the for loop command.
FUNCTION COMMAND CODING FOR (MOLECULAR WEIGHT):
%Find the molecular weight for the given atoms

function [molecular_weight] = Mol_wgh(sp_name);
SPECIES=upper(sp_name);
Chemical_name=['H', 'C', 'N', 'O', 'A', 'S'];
Atomic_weight=[1 12 14 16 40 32 ];

molecular_weight=0;
for i = 1:length(SPECIES);
    for j = 1:length(Chemical_name);
        if strcmp(SPECIES(i),Chemical_name(j));
            molecular_weight=molecular_weight+Atomic_weight(j);
           u=j;
        end
    end

     n=str2double(SPECIES(i));


    if n>1
           molecular_weight=molecular_weight+Atomic_weight(u)*(n-1);

    end
end

fprintf('molecular_weight of %s :',sp_name)
fprintf('%f\n',molecular_weight)

end
Procedure:
Using the function command we could calculate the molecular weight for each species.
By calling certain function command we could perform a particular group of code without formulating the entire code in the Main coding.
Converting the string into an Uppercase for easy understanding.
Naming the species elements for enrolling the values of the atomic weight of the elements.
Initially, Molecular weight is considered as zero.
For loop is determined by the length of species name.
Inner for loop, Compare the each data of species and constituents with one another.
Once the comparing process is done, it will calculate the molecular weight.
Converting j value in a name of u, because once the for loop is end , J value will disappear.
The two end commands were used to end the for loop and if command.
By using str2double command, the species data is converted into double precision values.
If command is used to find the molecular weight is less than one.
Finally, the End command is used to end the first for loop and if command as well.
fprintf command is used to print the molecular weight of species in a command window.
CODING FOR FILE PARSING (MAIN CODING):
clear all
close all
clc

%Importing a data using fopen command

f1=fopen('THERMO.output','r');
Header=fgetl(f1);
tline=fgetl(f1);
A=strsplit(tline,' ');

Global_low_temp = str2num(A{2});
Global_mid_temp = str2num(A{3});
Global_high_temp = str2num(A{4});

%Skipping the comment lines using fgetl command

for i =1:3;
Comments =fgetl(f1);
disp(i);
end

%Extracting the temp and co_eff for each species

for j= 1:53;
    species = fgetl(f1);
    t=findstr(species,'.');

    %Find the local temp
    species(52-3:52+3);
    Tl = species(52-3:t(1)+3);
    Tl1=str2num(Tl);

species(t(1)+6:62+3);
Th=species(t(1)+6:t(2)+3);
Th1=str2num(Th);

species(t(2)+6:72+3);
Tm=species(t(2)+6:t(3)+3);
Tm1=str2num(Tm);


%Extracting species name

sp_name=species(1:6);


%Find the co_eff for each species

coeff_line_1=fgetl(f1);
A11=strfind(coeff_line_1,'E');
coeff_line_1(1:12+3);


a1=coeff_line_1(1:A11(1)+3);
c1=str2num(a1);
a2=coeff_line_1(1:A11(1)+4:A11(2)+3);
c2=str2num(a2);
a3=coeff_line_1(A11(2)+4:A11(3)+3);
c3=str2num(a3);
a4=coeff_line_1(A11(3)+4:A11(4)+3);
c4=str2num(a4);
a5=coeff_line_1(A11(4)+4:A11(5)+3);
c5=str2num(a5);


%Coding for Extracting data from line two

coeff_line_2=fgetl(f1);
A12=strfind(coeff_line_2,'E');
coeff_line_2(1:12+3);


a6=coeff_line_2(1:A12(1)+3);
c6=str2num(a6);
a7=coeff_line_2(1:A12(1)+4:A12(2)+3);
c7=str2num(a7);
a8=coeff_line_2(A12(2)+4:A12(3)+3);
c8=str2num(a8);
a9=coeff_line_2(A12(3)+4:A12(4)+3);
c9=str2num(a9);
a10=coeff_line_2(A12(4)+4:A12(5)+3);
c10=str2num(a10);

%Coding for Extracting data from line three
coeff_line_3=fgetl(f1);
A13=strfind(coeff_line_3,'E');
coeff_line_3(1:12+3);


a11=coeff_line_3(1:A13(1)+3);
c11=str2num(a11);
a12=coeff_line_3(1:A13(1)+4:A13(2)+3);
c12=str2num(a12);
a13=coeff_line_3(A13(2)+4:A13(3)+3);
c13=str2num(a13);
a14=coeff_line_3(A13(3)+4:A13(4)+3);
c14=str2num(a14);


%Calculating the Enthalpy, Entropy, Specific heat

T=linspace(Tl1,Th1,100);
R=8.314;

[Cp,H,S]=co_eff(T,R,Tm1,c1,c2,c3,c4,c5,c6,c7,c8,c9,c10,c11,c12,c13,c14);
mkdir(['C:\Users\gurus\OneDrive\Desktop\Species\',sp_name]);

%Ploting [Cp,H,S]

figure(1)
plot(T,Cp,'linewidth',3,'color','b')
title(sp_name)
xlabel('Temperature')
ylabel('Specific Heat')
grid on

figure(2)
plot(T,H,'linewidth',3,'color','r')
title(sp_name)
xlabel('Temperature')
ylabel('Enthalpy')
grid on


figure(3)
plot(T,S,'linewidth',3,'color','g')
title(sp_name)
xlabel('Temperature')
ylabel('Entropy')
grid on

%Saving the displayed plots in particular folder

cd(['C:\Users\gurus\OneDrive\Desktop\Species\',sp_name]);

saveas(1,'Specific heat.png');
saveas(2,'Enthalpy.png');
saveas(3,'Entropy.png');

%Calculating the Molecular weight


 Mol_wgh(sp_name);

end

fclose(f1)
Procedure:
Clear all, Close all , clc commands were used to clear the history of the data in matlab.
fopen command is used to read or write data from the given file.
Reading the entire line of the data by using fgetl command. Here, the first line of data is considered as header which is a name of the species.
In order to split the data of the next line, we could use strsplit command which will split up the data into single value, so the needed data can extract by calling the place number.
Converting the string data into numerical data by passing the str2num command for each three values which were Global_low_temp,Global_mid_temp,Global_high_temp. Highest value is considered as Global_high_temp and remaining temp values were considered according to the data.
For loop command were used to skip the three comment lines.
Here,The for loop command is utillized to repeat the same code for next 53 lines.
Calling the next line using fgetl command to extract the local_high_temp, local_mid_temp and local_low_temp. The process has achieved with the help of findstr command which will find the dot placed area and by adding or subtracting certain numbers will bring the exact values of the local temperatures with decimal points.
Converting the data into proper numerical format using str2num command. By following the same pattern the remaining temperatures values were obtained.
Specimen name was derived by calling the line and providing the limits.
In the next line we were extracting the co_efficients of respective species.
Finding the E string placed area by using the find string command which is strfind. Once the values were found, We could seperate the co efficients by adding or subtracting with E string placed area values.
This process were followed to the remaining two lines to split up the all the co efficients.
In order to calculate the specific heat, Entropy, Enthalpy values, we have to use the function command which has modified given formula to derived the Sp,E,H values.
Here, Linspace command is used to find the values for T. The term R is an universal gas constant which has value of 8.314.
Creating a folder to save the plots in respective names.
Ploting the Temp and Cp values to get a grapical view of the data.
Title command determine the text which should be placed on the plot.
xlabel denotes the text for x-axis and ylabel denotes the text for y-axis.
grid on command bring a lines in the plot for each values of x and y axis.
cd command is used to change the current directory to save plots in a particular folder.
By using the saveas command the plot of Cp,S,H have stored in the folder with respective names.
Calling the molecular weight function to display to all the molecular weight values in a command window.
End the for loop command for the for loop 1:53.
fclose(f1) command will close the file.
THE O2 PLOTS:
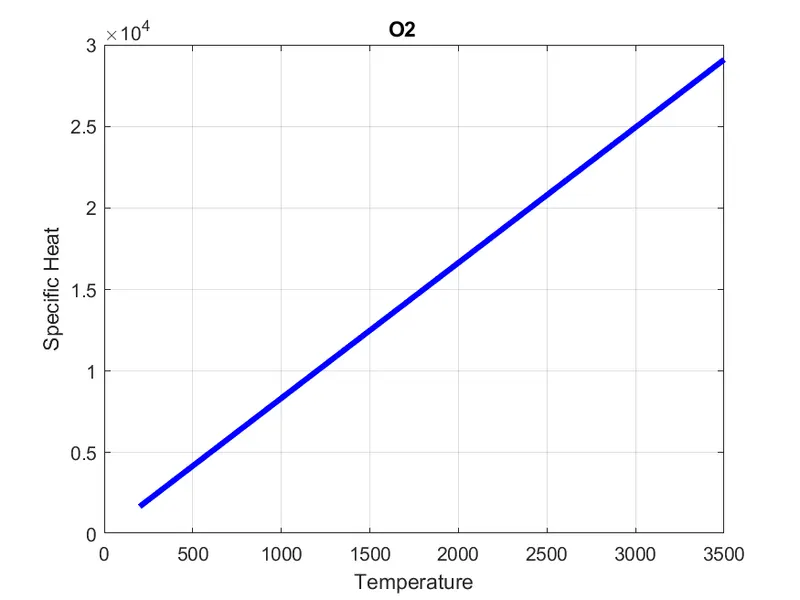
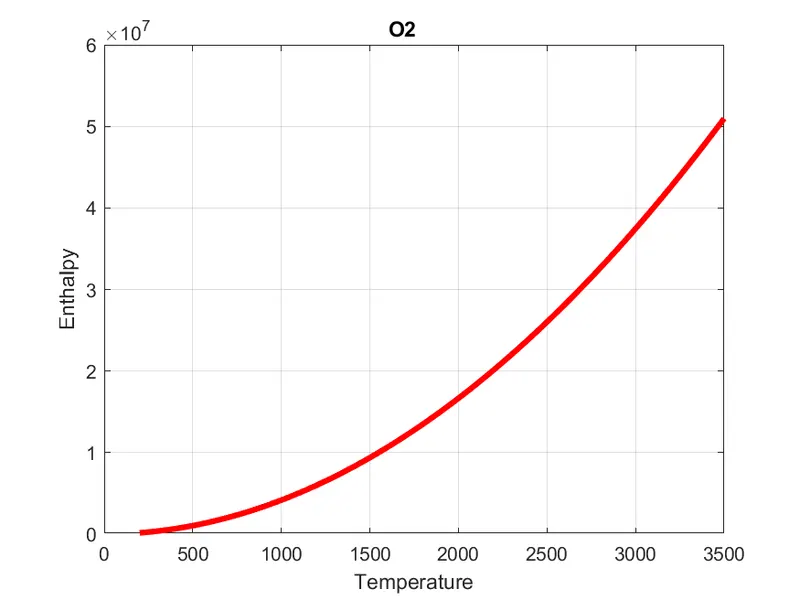
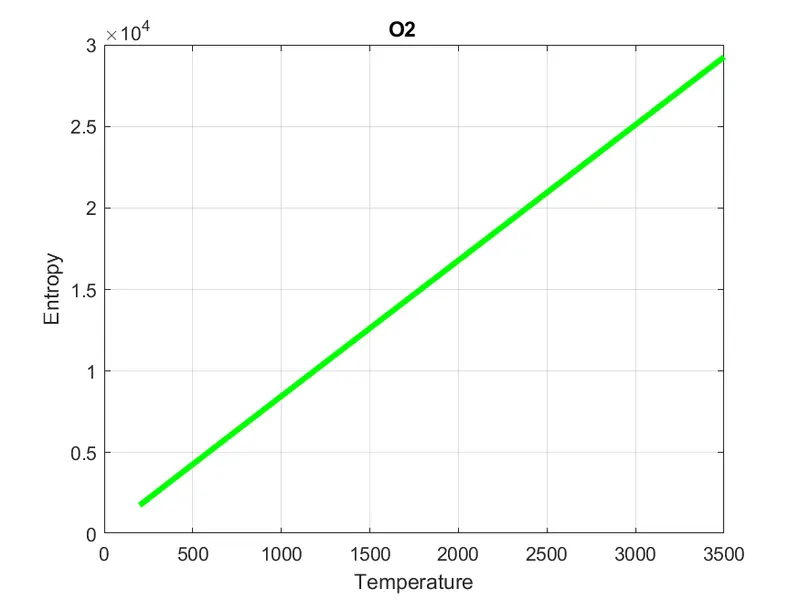
THE N2 PLOTS:
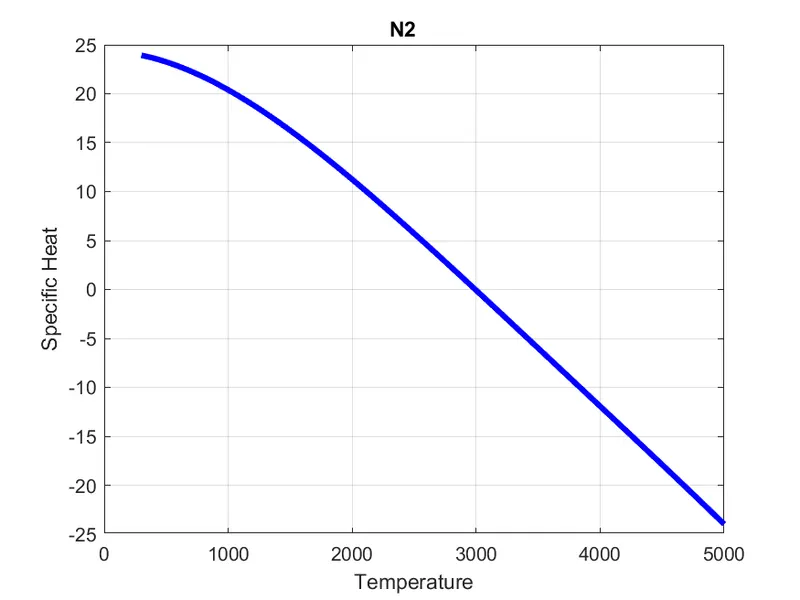
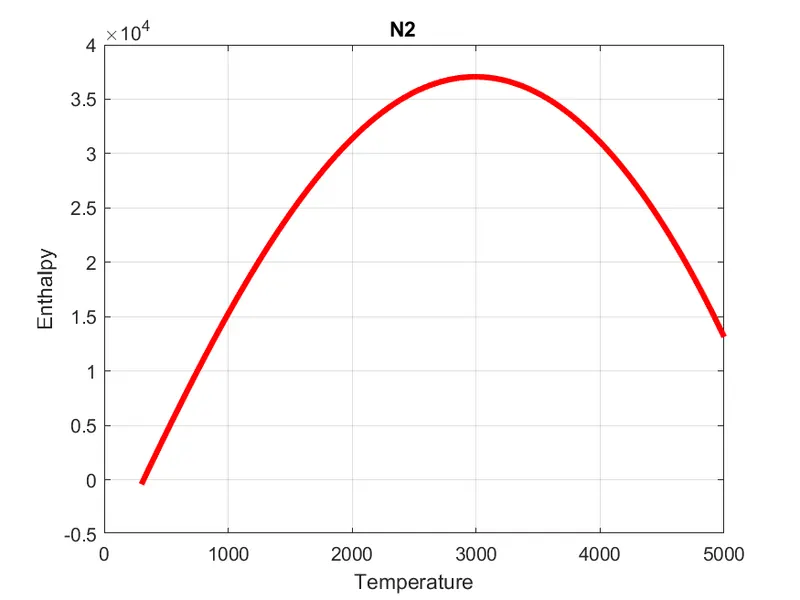
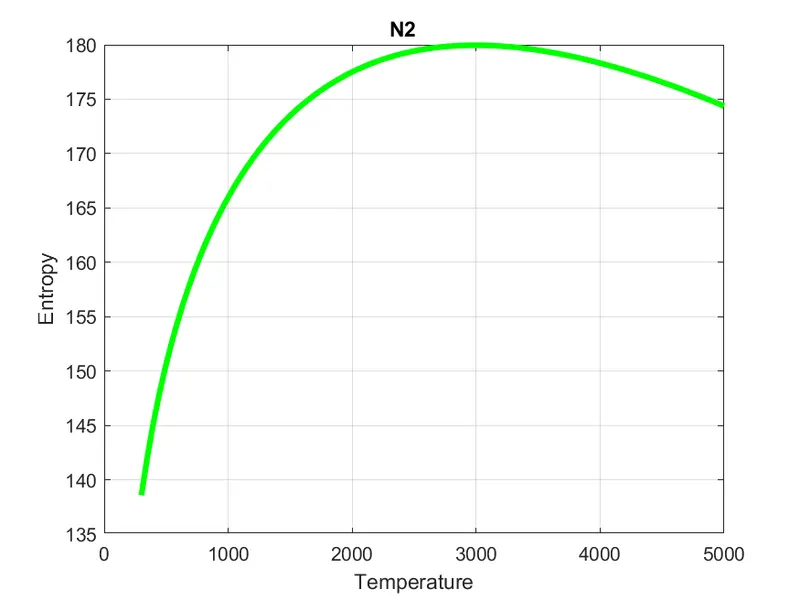
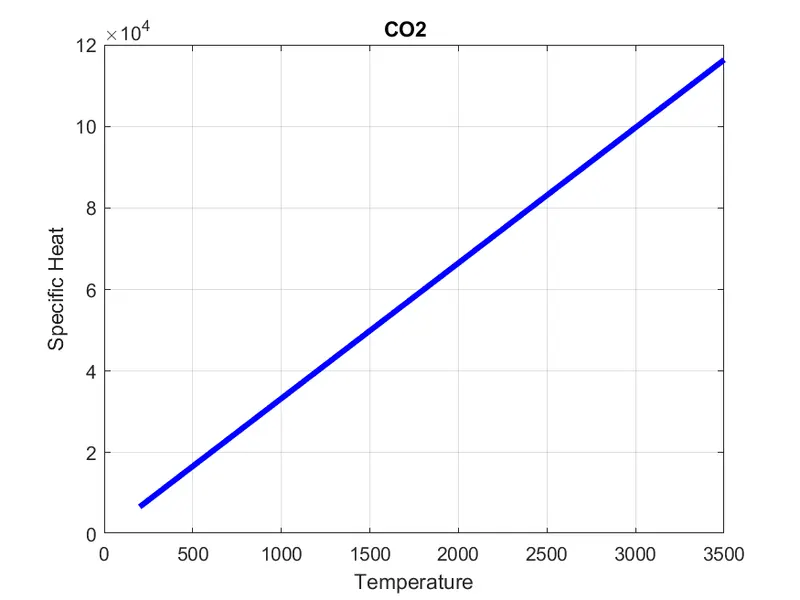
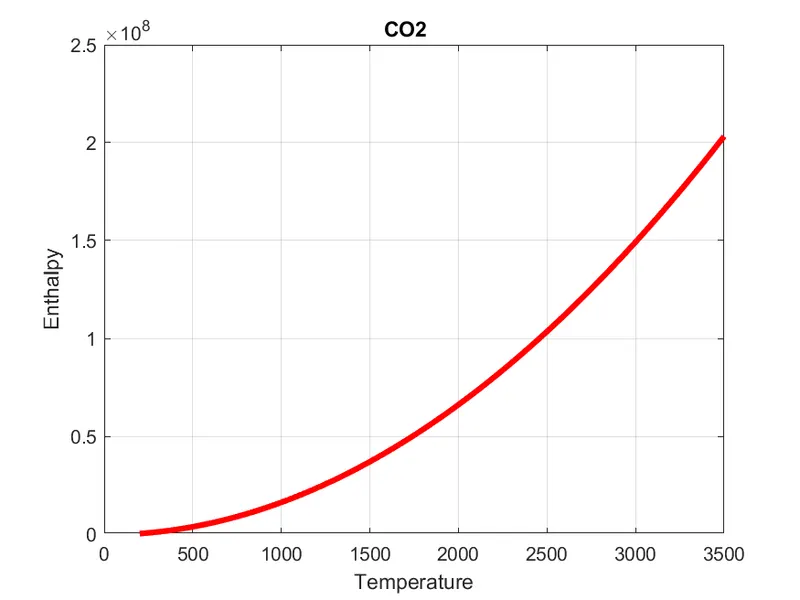
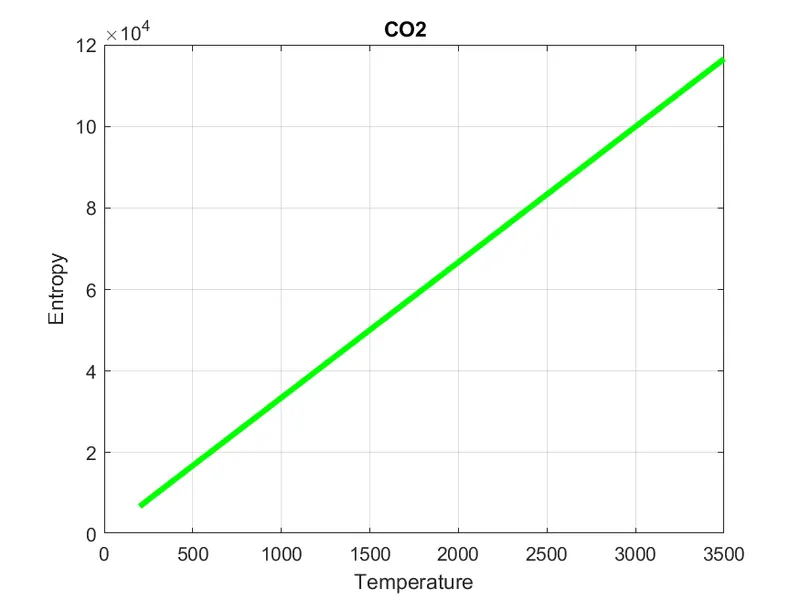
THE C02 PLOTS:
THE SCREENSHORT OF THE SPECIES FOLDER:
THE SCREENSHORT OF MOLECULAR WEIGHT OF THE SPECIES:
APPLICATION OF THE PROJECT:
Extracting an unreadable data and converting into an useful data for future developments.
Showing the graphical information about the data for easy understanding.
CONCLUSION:
By using file parsing method, The NASA FILE PARSING data has extracted and converted into readable information by using MATLAB software.