Project 1 - Parsing NASA thermodynamic data
Aim:
To extract the coefficients of all the thermodynamic properties to calculate the specific heat(cp), enthalpy(H) and entropy(S) that are evaluated from the NASA thermodynamic file of polynomials for '53' species by parsing all temperature coefficients of local temperatures.
Objective:
- The objective of the program is to do a task of parsing of a 'NASA thermodynamic file' to calculate the Specific heat(cp), Enthalpy(H) and Entropy(S) coefficient temperatures for the defined local temperatures of each species.
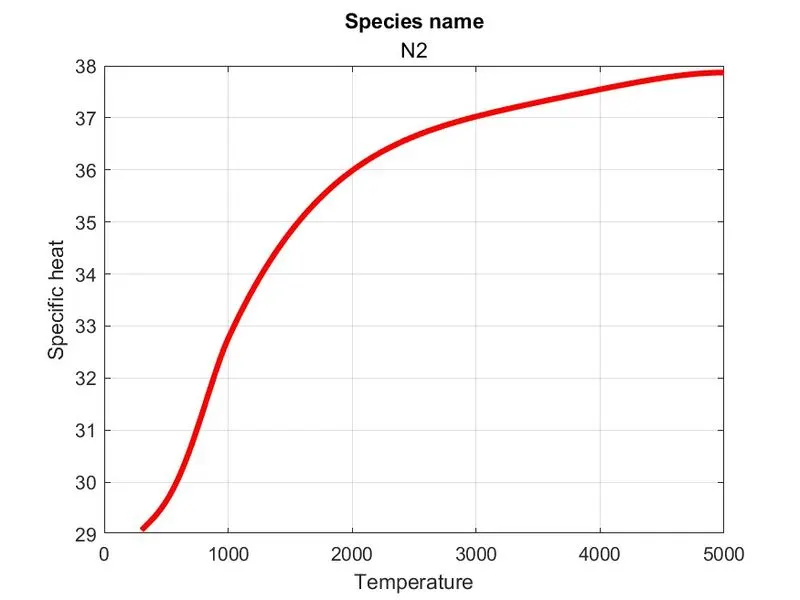
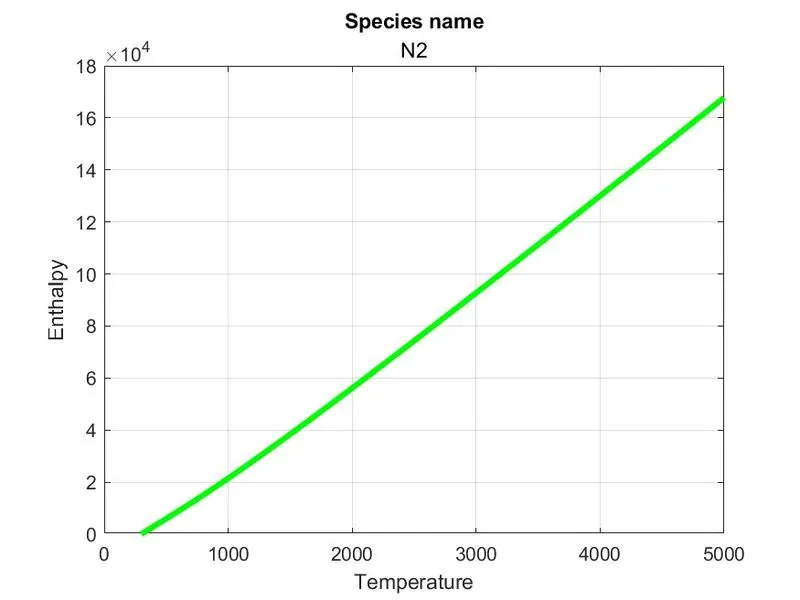
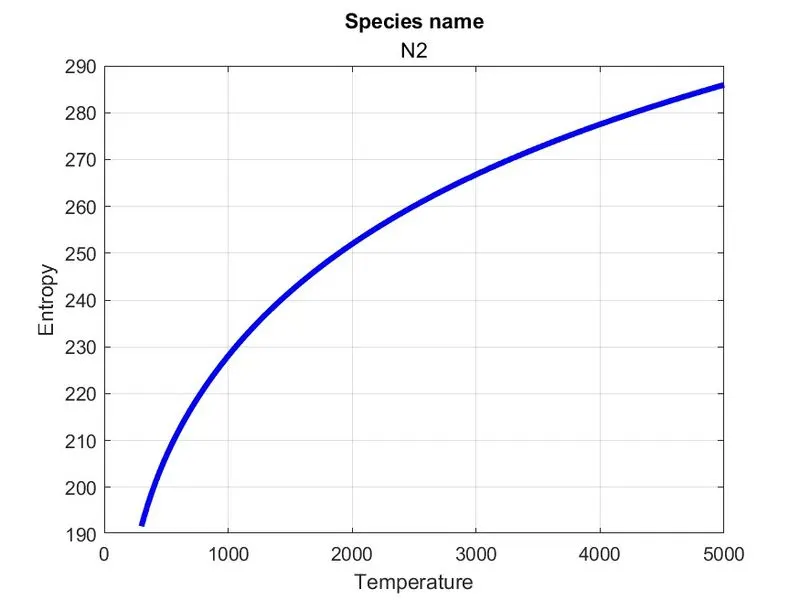
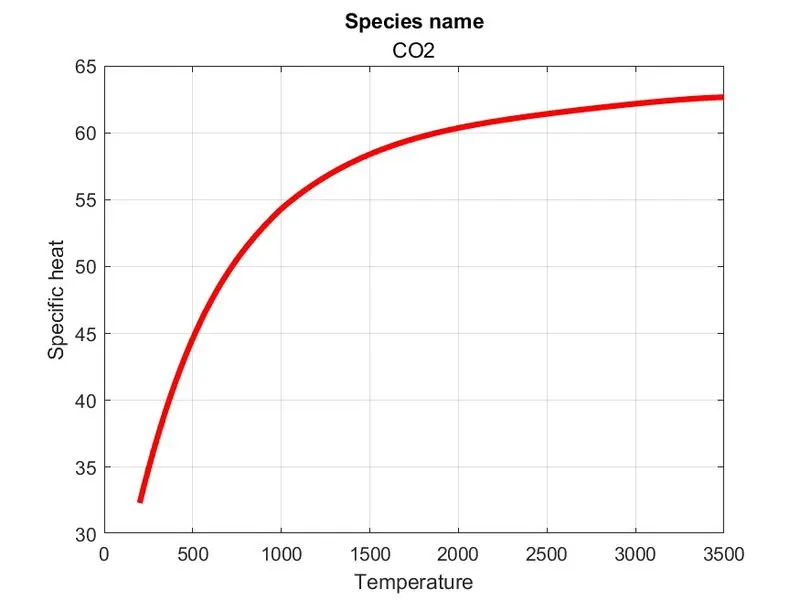
- To plot the cp, H and S from the coefficients temperature for for the local temperature of ranges from low temperature to high temperatures as (T) for each species and the file for plot of each species to be created automatically.
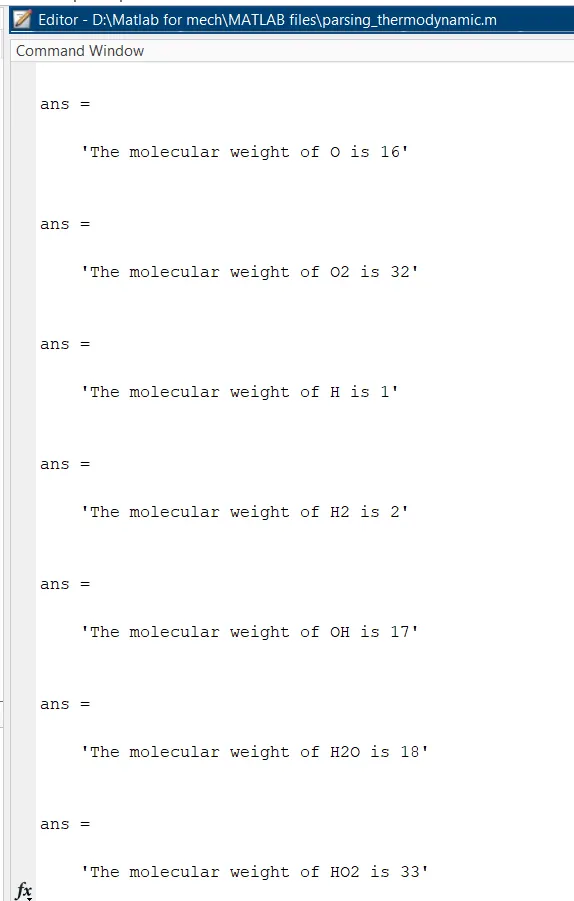
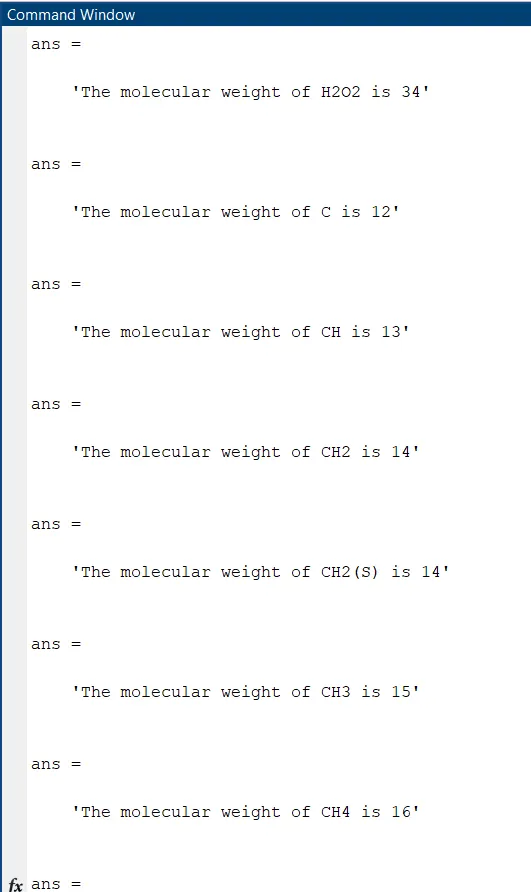
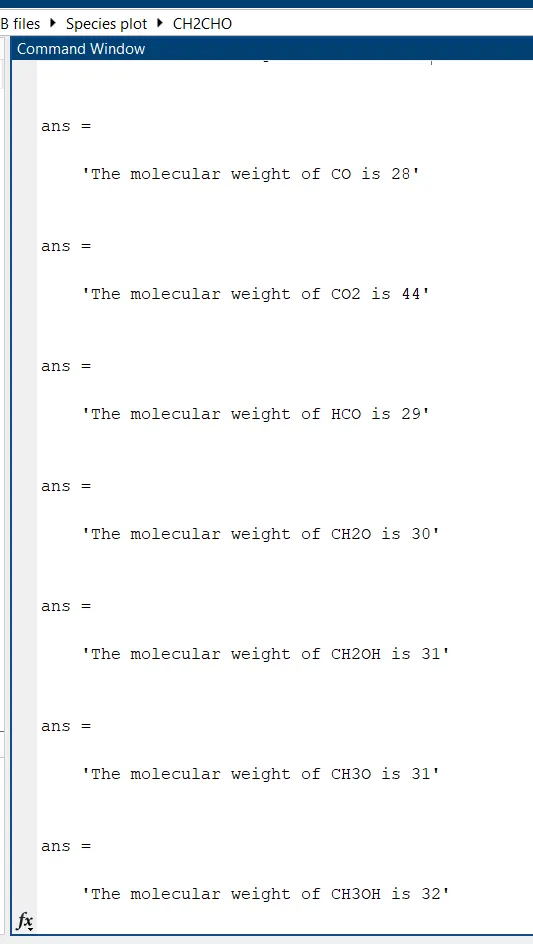
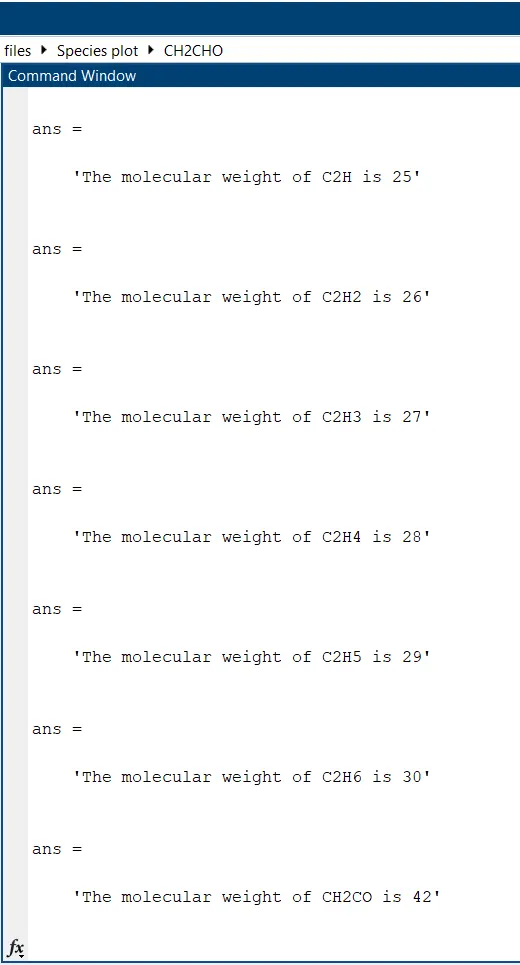
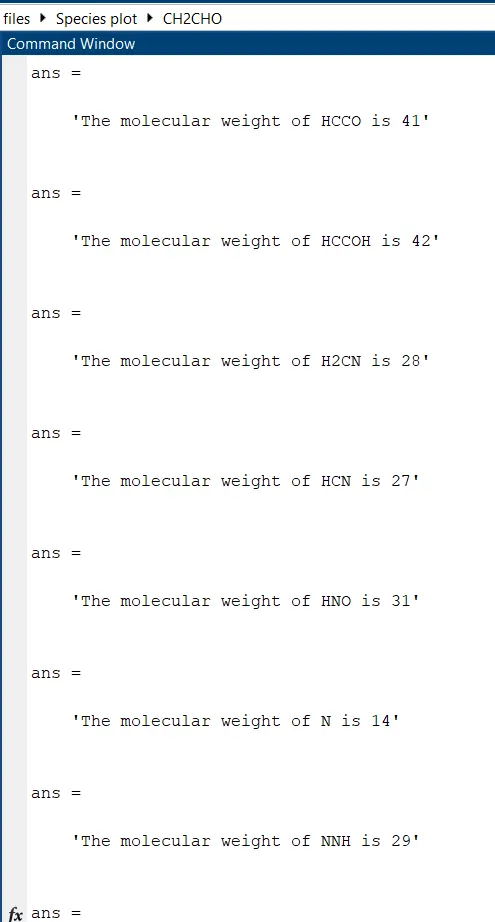
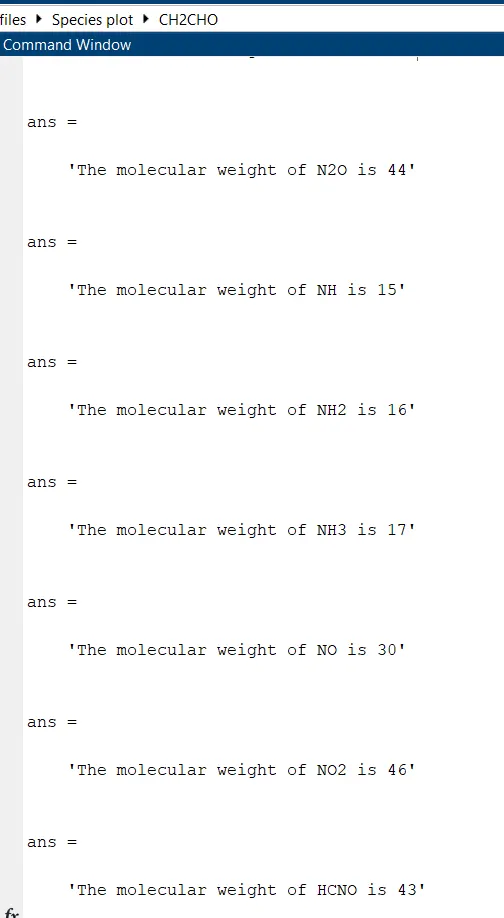
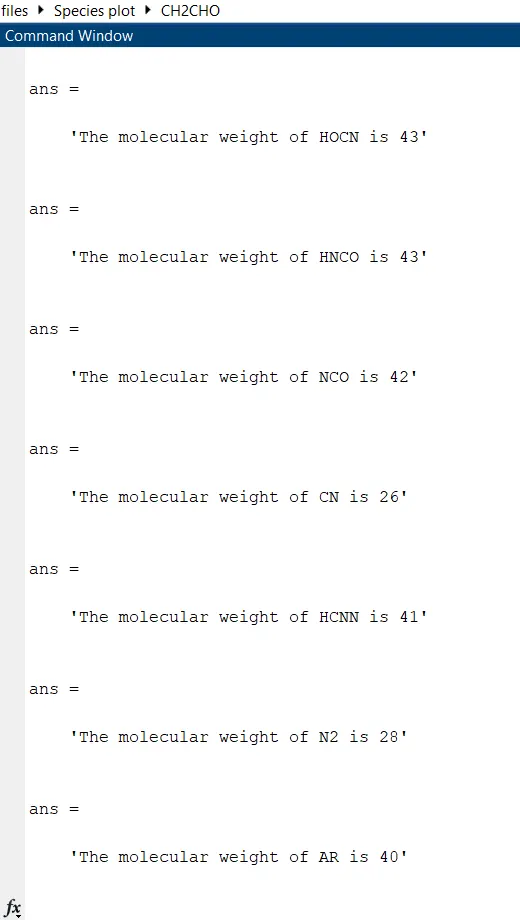
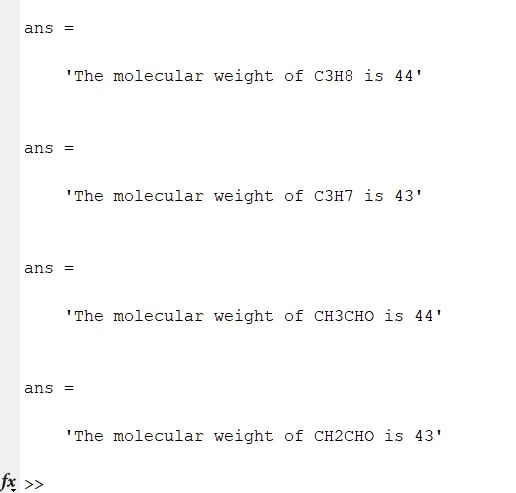
- Then to calculate the molecular weight of the each species to be displayed in the command window.
Introduction:-
Procedure:
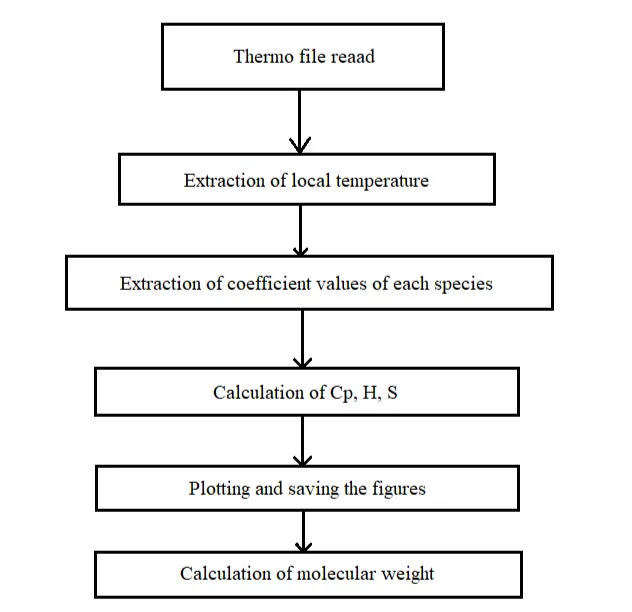
THe following flowchart will describes that the way to approach the process of the program,
File parsing:
- Parsing is an action of gathering a set of data as input in the form of string, text or as number of specified things. Parsing a file means reading or writing by obtain by loading a data and building a memory model of the content of that data as in the form of computer language. Parsing splits a file or other input into pieces of data that can be easily stored or manipulated.
- This mange with the field of computational linguistics where it commonly describes the natural language processing.
- Parsing helps to split the large input data into the defined or selective smaller data to process the data.
- Parsing helps to automate the particular works and also reduces the human error. It can be used for the applications of machine learning, automation etc.
NASA thermodynamic file:
The NASA thermodynamic file contains the evaluated polynomials of '53' - species of thermodynamic properties of cp, H, S contains the local temperature of ranges from low, mid and high temperatures for each individual species. Each species contains 14 temperature co-efficients where the first 7 coefficients are high-temperature coefficients and the next 7 coefficients are low-temperature coefficients to find the spcific heat, enthalpy and entropy using formula as,
where,
cp - Specific heat (J/Kg.K)
H - Enthalpy (KJ/mol)
S - Entropy (J/K)
R - Universal gas constant
T -Temperature
Specific heat:
Specific heat is the amountof heat required to increase the temperature of one gram of a substance by one Celsius degree. The units of specific heat are usually referred as calories or joules per gram per Celsius degree.
Cp = `a1+a2*T+a3*T^2+a4*T^3+a5*T^4`
Enthalpy:
Enthalpy is the sum of the internal energy per unit temperature and the product of the pressure and volume of a thermodynamic system for doing useful work.
`H = [a1+(a2*T)/2+(a3*T^2)/3+(a4*T^3)/4+(a5*T^4)/5+(a6)/T]*(R*T)`
Entropy:
Entropy is the measure of a system's thermal energy per unit temperature that is unavailable for doing useful work as output energy. Because work is obtained from ordered molecular motion, the amount of entropy is also a measure of the molecular disorder, or randomness, of a system.
`S = [a1*logT+a2T+(a3*T^2)/2+(a4*T^3)/3+(a5*T^4)/4+a7]*R`
Code Explanation:
- By using the fopen command and to mention the NASA thermodynamic file name to gather the required format as readable.
- Then use to for loop to skip the 1st five lines which are not required. Then create for loop tht run for each number of species.
- Then call the local temperature line and split them as each string by mentioning the spacing between them.
- From the splitted string the 1st cell will be as species name. Then extract the low, mid and high temperatures and convert them from string to number.
- Then provide the staring and ending range with no. of values for the temperature coefficients.
- Now call the next line and store in variable and using strfind to find the position of E that mention on all the values of temperature coefficients.
- Then from the calculated position of E convert all the string into integer values and store all the coefficients to the variables from a1 to a14 by call the 1st three lines.
- Now provide the value of universal gas constant. Then provide the length of T in another variable and use if command to provide the formulas for specific heat, enthalpy and entropy by using the range limit to above the mid temperature for 1st 7 coefficients.
- Then use else command if the temperature T is below the mid temperature to calculate the cp, H and S.
- Then plot T vs cp, T vs H, and T vs S for each species and provide grid on , x and y labels and also provide the title as species name.
- Now provide the mkdir and cd command to create a directory for storage the plotted figures of files for each species the folder to be created automatically.
- Then using the saveas command to save the each species figures as specific heat, enthalpy and entropy.
- Now for calculating the molecular weight of each species gather the common element that specified on all species.
- Then provide the atomic weight for all the common species and mention the molecular weight as 0.
- And provide the length for common species and their atomic weight as variables.
- Then by using the strcmp to compare the elements with each species name at each index.
- THen convert the string to integer of the species name. Then calculate the atomic weight with position of elements as molecular weight by increasing the index in species name to calculate the molecular weight.
- Then by using the fclose command to close the file as providing file id as f.
Program code:
clear all
close all
clc

%using fopen to read the NASA thermodynamic file
f = fopen('THERMO.dat','r');

% Skip the first 5 lines using for loop
for i=1:5
    fgetl(f);
end

for i = 1:53   %Parse every species block from 1 to 53 species present inside the thermo data file
    a = fgetl(f);  %To access the first line of the first species 'O'
    b = strsplit(a,' '); % Splitting the 1st line as string

    %Get the species name by represent 1st cell
    speciesname = b{1}; %Using curly brackets to define a string

    %Extracting the local temperature
    z = length(b); %Assigning the index for the string
    lowtemp = str2double(b{z-3});
    hightemp = str2double(b{z-2});
    midtemp = str2double(b{z-1});

    T = linspace(lowtemp,hightemp,400);

    %Extracting the co_efficients
    %Line 1
    co_line1 = fgetl(f);
    %Finding the position of E in line 1
    pos_e1 = strfind(co_line1,'E');

    %All co-efficients of line 1 & converting string to number
    a1 = str2double(co_line1(1:pos_e1(1)+3));
    a2 = str2double(co_line1(pos_e1(1)+4:pos_e1(2)+3));
    a3 = str2double(co_line1(pos_e1(2)+4:pos_e1(3)+3));
    a4 = str2double(co_line1(pos_e1(3)+4:pos_e1(4)+3));
    a5 = str2double(co_line1(pos_e1(4)+4:pos_e1(5)+3));

    %line 2
    co_line2 = fgetl(f);
    %Finding the position of E in line 2
    pos_e2 = strfind(co_line2,'E');
    a6 = str2double(co_line2(1:pos_e2(1)+3));
    a7 = str2double(co_line2(pos_e2(1)+4:pos_e2(2)+3));
    a8 = str2double(co_line2(pos_e2(2)+4:pos_e2(3)+3));
    a9 = str2double(co_line2(pos_e2(3)+4:pos_e2(4)+3));
    a10 = str2double(co_line2(pos_e2(4)+4:pos_e2(5)+3));

    %line 3
    co_line3 = fgetl(f);
    %Finding the position of E in line 3
    pos_e3 = strfind(co_line3,'E');
    a11 = str2double(co_line3(1:pos_e3(1)+3));
    a12 = str2double(co_line3(pos_e3(1)+4:pos_e3(2)+3));
    a13 = str2double(co_line3(pos_e3(2)+4:pos_e3(3)+3));
    a14 = str2double(co_line3(pos_e3(3)+4:pos_e3(4)+3));

    %Creating the folder that automatically saves the files
    mkdir(['D:\Matlab for mech\MATLAB files\Species plot\',speciesname]);

    %Universal gas constant
    R = 8.314;
    % cp - Specific heat; H - Enthalpy; S - Entropy

    for k = 1:length(T)
        %To compare the species temperature to assign the coefficients
        %(a1:a7)-high temp coefficients, (a8:a14)-low temp coefficients
        if T(k)>midtemp

            %High temp coefficients
            cp(k) = (a1+a2*T(k)+a3*T(k)^2+a4*T(k)^3+a5*T(k)^4)*R;
            H(k) = (a1+(a2*T(k))/2+(a3*T(k)^2)/3+(a4*T(k)^3)/4+(a5*T(k)^4)/5+a6/T(k))*(R*T(k));
            S(k) = (a1*log(T(k))+a2*T(k)+(a3*T(k)^2)/2+(a4*T(k)^3)/3+(a5*T(k)^4)/4+a7)*R;

        else
            %Low temp coefficients
            cp(k) = (a8+a9*T(k)+a10*T(k)^2+a11*T(k)^3+a12*T(k)^4)*R;
            H(k) = (a8+(a9*T(k))/2+(a10*T(k)^2)/3+(a11*T(k)^3)/4+(a12*T(k)^4)/5+a13/T(k))*(R*T(k));
            S(k) = (a8*log(T(k))+a9*T(k)+(a10*T(k)^2)/2+(a11*T(k)^3)/3+(a12*T(k)^4)/4+a14)*R;
        end
    end

    %Plotting
    figure(1);
    plot(T,cp,'LineWidth',3,'Color','r');
    grid on
    title('Species name',speciesname);
    xlabel('Temperature');
    ylabel('Specific heat');

    figure(2);
    plot(T,H,'LineWidth',3,'Color','g');
    grid on
    title('Species name',speciesname);
    xlabel('Temperature');
    ylabel('Enthalpy');

    figure(3);
    plot(T,S,'LineWidth',3,'Color','b');
    grid on
    title('Species name',speciesname);
    xlabel('Temperature');
    ylabel('Entropy');

    % Changing the directory and saving the file
    cd(['D:\Matlab for mech\MATLAB files\Species plot\',speciesname]);

    %Saveas will saves the figures to the specific format
    saveas(1,'Specific heat','jpg');
    saveas(2,'Enthalpy','jpg');
    saveas(3,'Entropy','jpg');

    %Calculating molecular weight of each species
    elements = ['H','C','O','N','A']; %Gathering the common element from all species
    atomic_wt = [1,12,16,14,40];
    molecular_wt = 0;

    for n = 1:length(speciesname)
        for o = 1:length(elements)
            if strcmpi(speciesname(n),elements(o))
                molecular_wt = molecular_wt+atomic_wt(o);
                position = o;
            end
        end
        p = str2double(speciesname(n)); % Converting the string to number
        if p>1
            molecular_wt = molecular_wt + atomic_wt(position)*(p-1);
        end
    end
    sprintf('The molecular weight of %s is %d', speciesname,molecular_wt)

end

fclose(f);
Output:
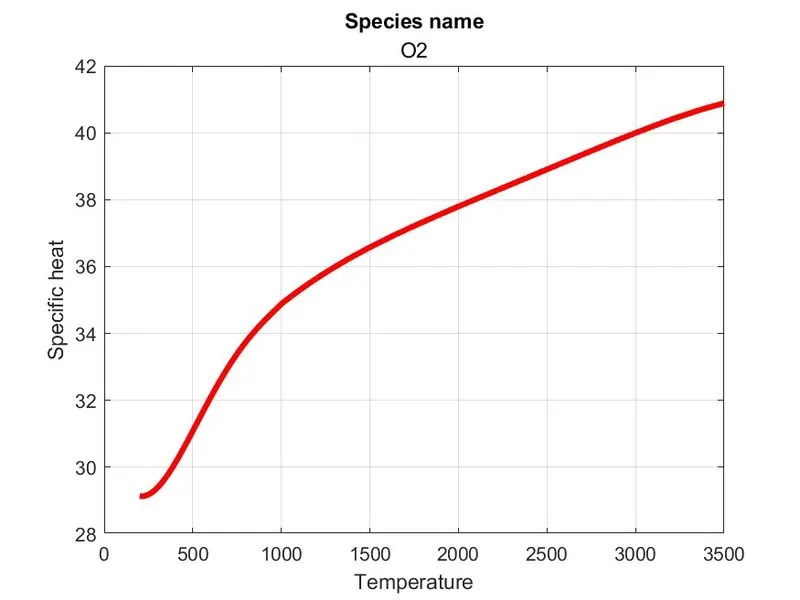
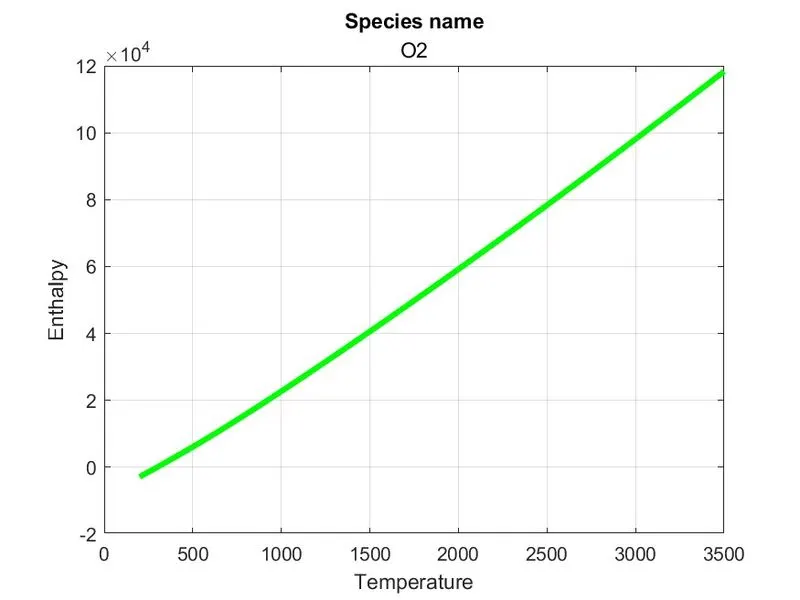
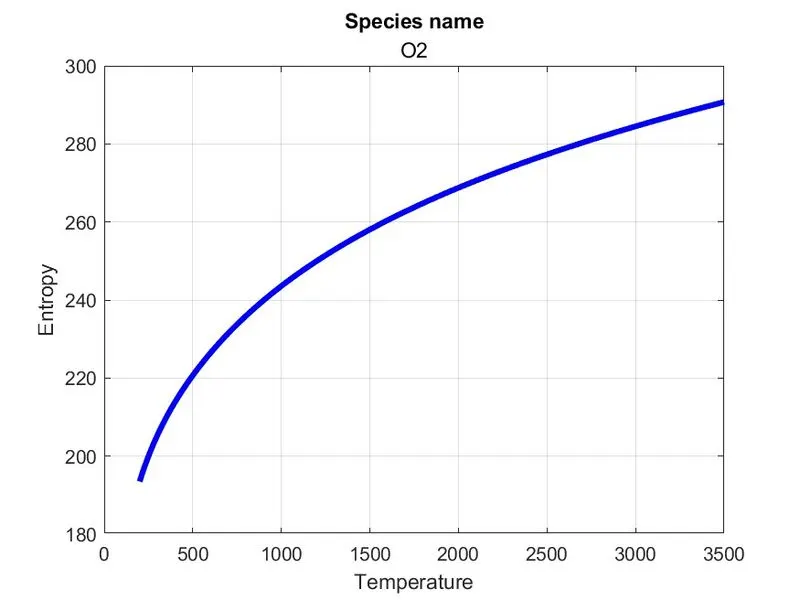
Plots of species `O_2`
Temperature vs Specific heat
Temperature vs Enthalpy
Temperature vs Entropy
Plots of species `N_2`
Temperature vs Specific heat
Temperature vs Enthalpy
Temperature vs Entropy
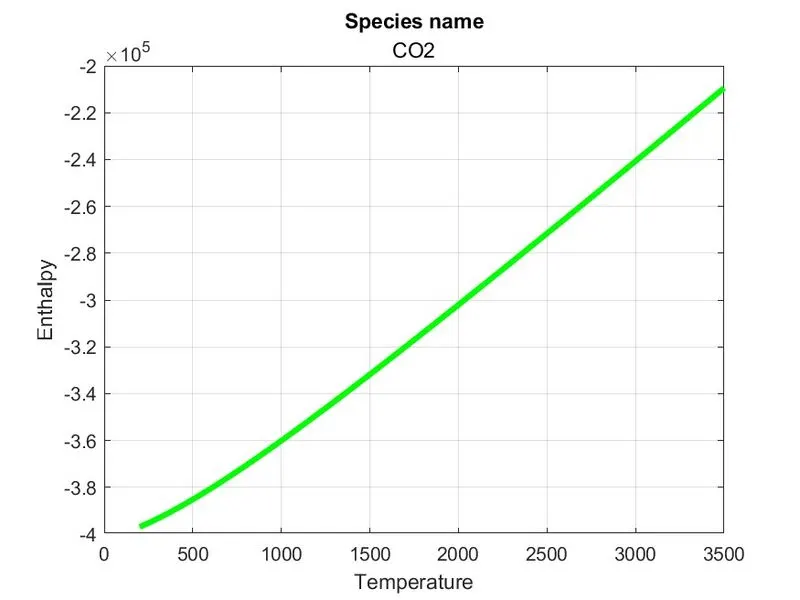
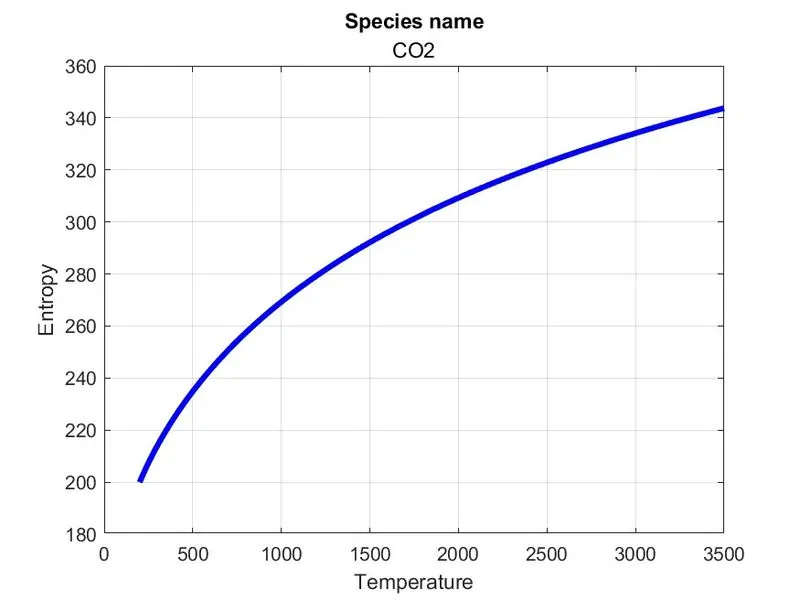
Plots of species `CO_2`
Temperature vs Specific heat
Temperature vs Enthalpy
Temperature vs Entropy
Screenshot of the window where all the folders are saved:
Files of 53 - species plots

Molecular weight of each species:
Result:
By using the NASA thermodynamic data file the specific heat(cp), enthalpy(H) and entropy(S) are calculated by file parsing process.
For each species the cp, H and S are plotted. Plots for o2, N2 and Co2 species are attached.
Screenshot of the window where all the files for the folders of plots for each species are also attached.
The molecular weight of each species are calculated and display it in the command window are to be attached.
Error thrown in command window while programming:
The is found that the directory for saving plot figures files are not created due to not providing square brackets ([]) to the storage directory.
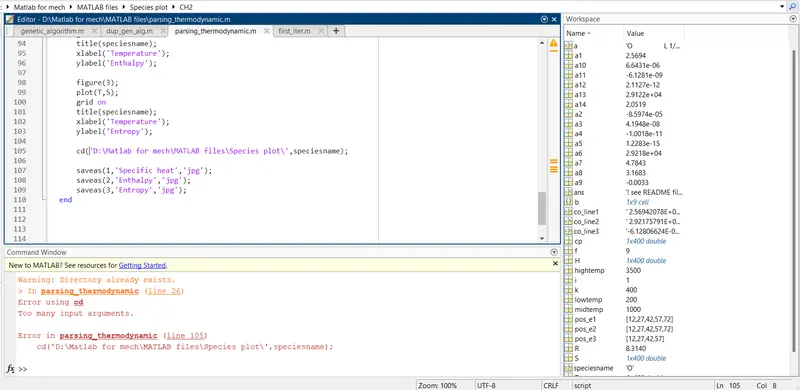
To overcome this error by providing the square brackets to the folder creating directory the error get resolved.