Project 1 - Parsing NASA thermodynamic data
Writing a program for file parsing of NASA thermodynamic data.
Explanation:
1. First, To open the given data file and read its contents, we use the 'fopen' command. We include the file name and use the 'r' command to read the file.
2. As the first line in the data shows 'Thermo data' we skip the first line. To get the next line we use 'fgetl' command.
3. In the data there are three global temperatures namely low, medium, and high-temperature values.
4. To get the line where the temperature values are located we use 'fgetl' command. As the values are in string format we use 'str2num' command to convert them into numbers.
5. After converting we separate each temperature value namely global low temperature, global medium temperature, and global high temperature.
6. In the given data the first three lines are not required so we ignore the three lines and skip to the next line where the numerical values are located.
7. To skip the values we use for loop and get to the next line using 'fgetl' command.
8. From the next line the species such as O, O2, CO, N2 etc are started. There are 53 species and we need to read all the species and extract the respective coefficients that are given for each species.
9. There are also local temperature values for each species. and we need to calculate the specific heat, enthalpy and entropy using the local temperature values themselves.
10. To extract all the species and the coefficients we use 'for' loop. In the 'for' loop the I values range from 1 to 53. We use 'fgetl' command to read the first local temperature line.
11. Between the temperature values there are spaces and we need to remove them. to do so, We use the 'strsplit' command.
12. This separation of the spaces between the temperature values is named A.
13. For each species the local temperatures are given and to read them we use 'str2num' command to convert the temperature values into numbers.
14. As the temperature values are located at the end of the line, we read the temperature values by using 'end-1' 'end-2' 'end-3'.
15. After separating the local temperature values we assign 500 values between the low temperature and high temperature using 'linspace' command.
16. The next part is getting the coefficients for each species.
17. Each species has three lines and first two lines consist of 5,5 values and the third line consists of 4 values.
18. The first line is taken as line1 and to get the line we use 'fgetl' command.
19. As the values are not in the order we use 'E' as the separating element and we find the position of 'E' in each line using 'findstr' command.
20. The position of E in the first line is taken as 'position1'. And using this position we separate each coefficient value.
21. The first five coefficients are named as a1,a2,a3,a4 and a5.
22. To extract the values that are in string format we use 'str2num' command. Using 'position1' each coefficient value is taken as shown in the code.
23. Similarly, to read the values from the second line we name it 'line2' and get the line using 'fgetl' command.
24. To separate the coefficients we use 'E' as a separating value and use 'findstr' command to find 'E' in the second line.
25. In the second line the position of E is taken as 'Position2'. using this we separate each coefficient value namely a6 to a10.
26. The values that are in string format are converted into numbers using 'str2num' command.
27. The same process is repeated to extract the values a11 to a14 from line3. The third line is named 'line3' and the position of E in the third line is taken as 'position3'.
28. As we extracted the coefficients, now we calculate the specific heat, enthalpy and entropy using the function command.
29. Firstly we calculate the specific heat. In a new script we use the function command where the file name is taken as specific heat and the input elements are (a1,a2,a3,a4,a5,a8,a9,a10,a11,a12,med_temp,T,R).
30. The formula to calculate the specific heat is given as Cp/R = al + a2 T + a3 T*2 + a4 T*3 + a5 T*4.
31. After giving the input values we use the 'if' loop to calculate the specific heat for low-temperature and high-temperature coefficients.
32. The high-temperature coefficients are a1 to a5 and the low-temperature coefficients are a8 to a12.
33. If the temperature value is less than or equal to the medium temperature value, then the specific heat for low-temperature coefficients is calculated.
34. If the temperature value is greater than or equal to the medium temperature value, then the specific heat for high-temperature coefficients is calculated.
35. After calculating specific heat, enthalpy for all the species is calculated using the function command.
36. The name of the function is given as enthalpy_h and the inputs of the function are (a1,a2,a3,a4,a5,a6,a8,a9,a10,a11,a12,a13,med_temp,T,R)
37. The formula for calculating enthalpy is (H/RT = al + a2 T /2 + a3 T*2 /3 + a4 T*3 /4 + a5 T*4 /5 + a6/T).
38. Using the if-else condition, If the temperature value is less than or equal to the medium temperature value, then the enthalpy for low-temperature coefficients is calculated.
39. If the temperature value is greater than or equal to the medium temperature value, then the enthalpy for high-temperature coefficients is calculated.
40. After enthalpy the last property to be calculated is Entropy. The name of the function is given as entropy_s and the inputs for entropy are (a1,a2,a3,a4,a5,a7,a8,a9,a10,a11,a12,a14,med_temp,T,R).
41. The formula for calculating the entropy is S/R = a1 lnT + a2 T + a3 T*2 /2 + a4 T*3 /3 + a5 T*4 /4 + a7.
42. Using the if-else condition, If the temperature value is less than or equal to the medium temperature value, then the entropy for low-temperature coefficients is calculated.
43. If the temperature value is greater than or equal to the medium temperature value, then the entropy for high-temperature coefficients is calculated.
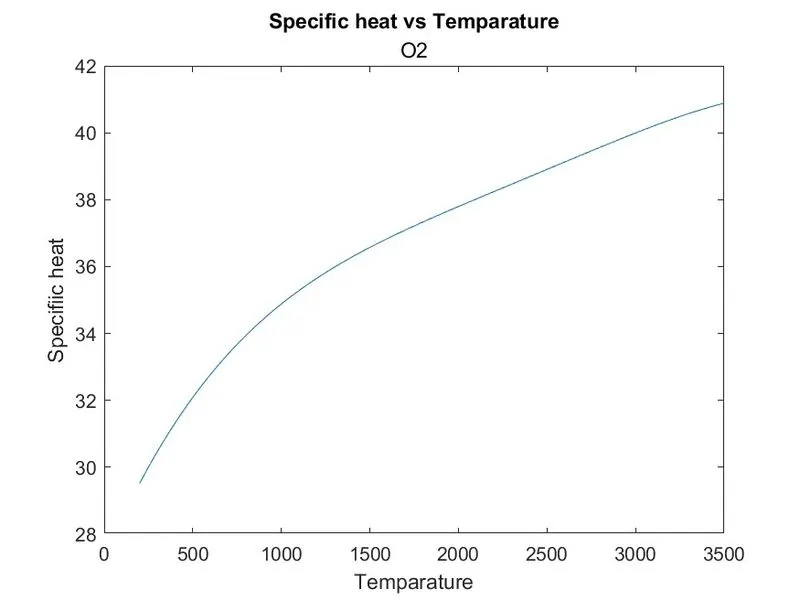
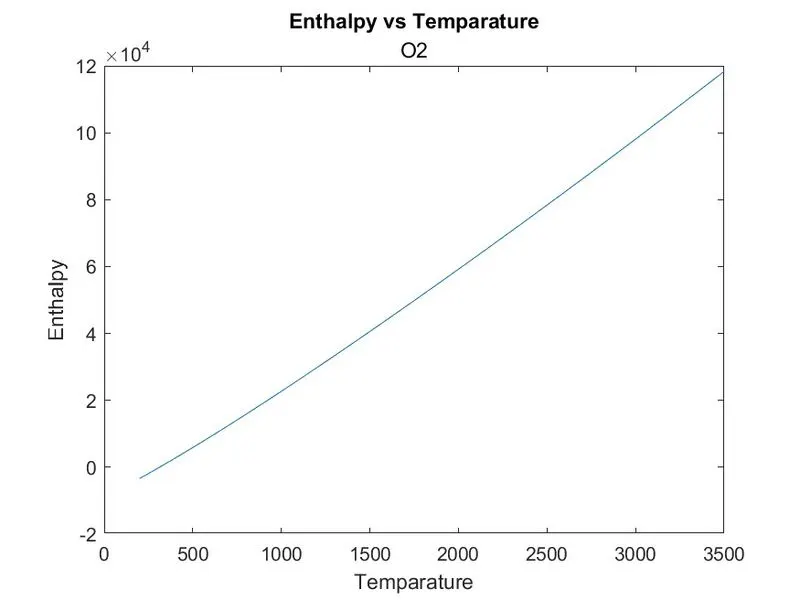
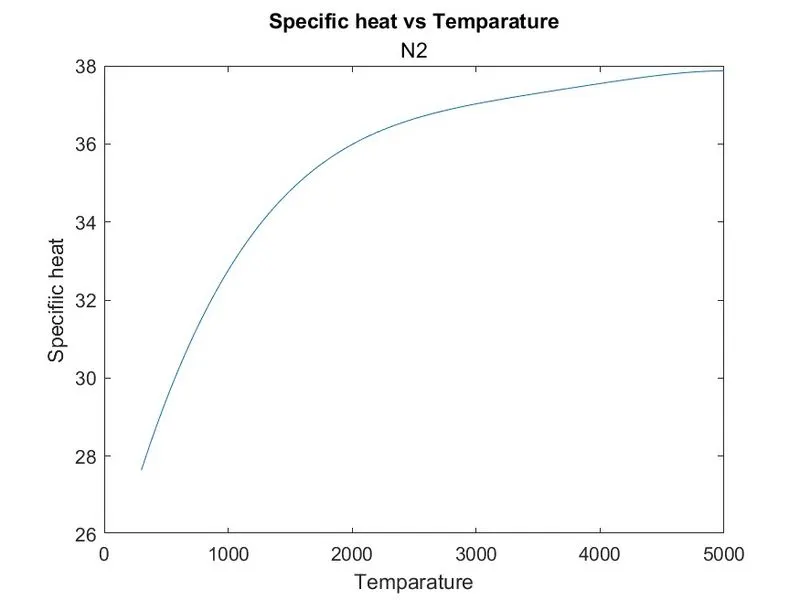
44. After calculating all three parameters we create a new file directory for species using mkdir command. And we change the present file directory to the species file directory using cd command.
45. Now, we plot three figures.
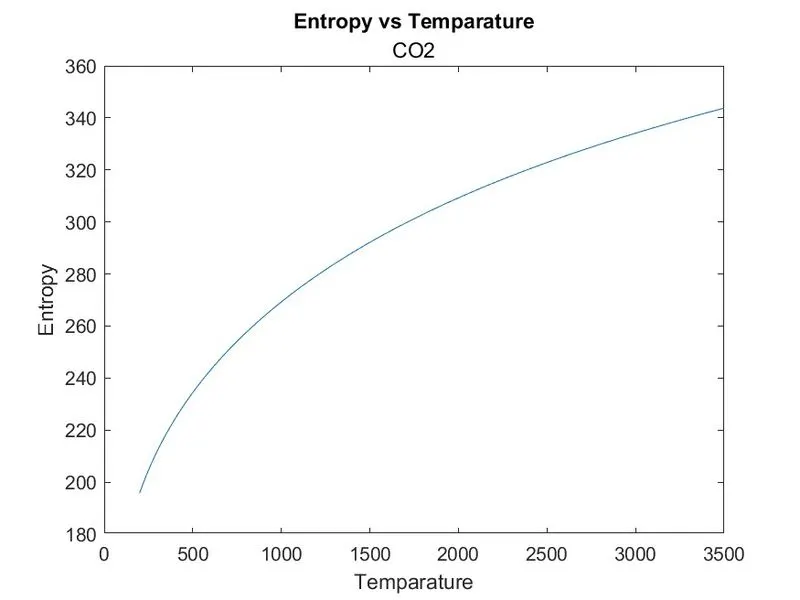
46. In figure1 the temperature vs specific heat is plotted, In figure2 temperature vs enthalpy is plotted and in the figure3 temperature vs entropy is plotted.
47. Using saveas command each plot is directly saved in jpg format in the respective folder of the species.
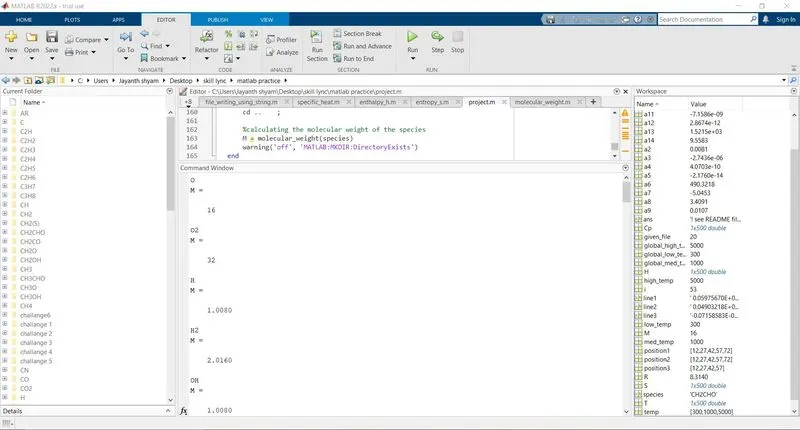
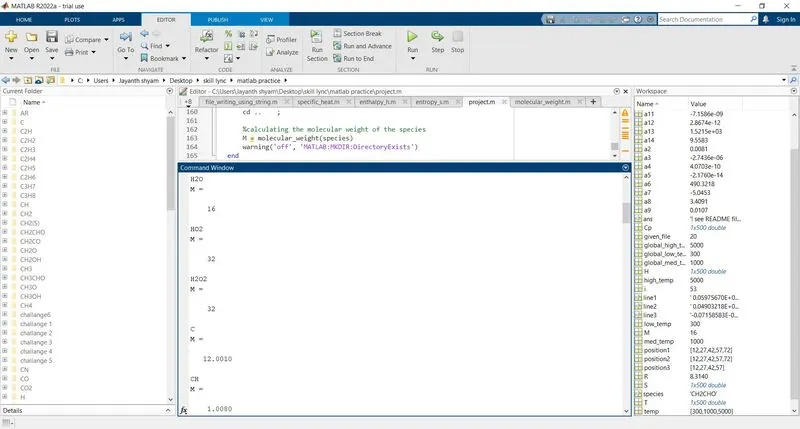
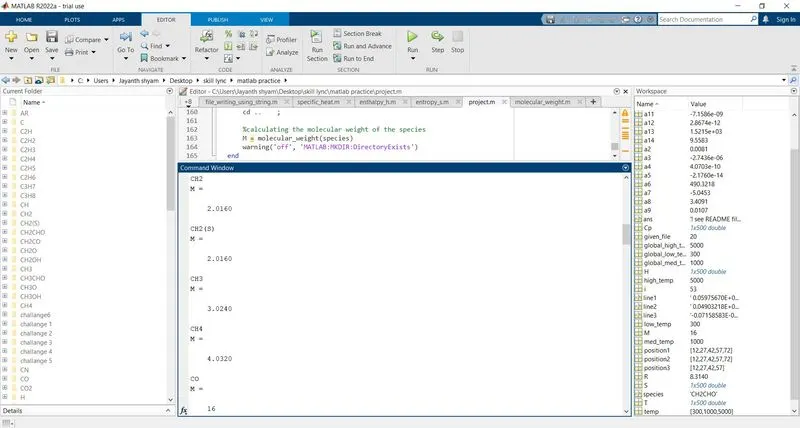
48. Now to calculate the molecular weight of the species we use the function command where the name of the function is given as 'molecular weight' and the input value is species.
49. As all the species contain certain base elements, we create an array of base elements namely H,C,N,O and Ar.
50. The molecular weight of the base elements is given as an array.
51. After that we use the 'for' loop where 'i' can take values from 1 to length of the species.
52. And in the second for loop 'j' takes the values from 1 to length of base elements.
53. Now, using the If condition we compare the species and the base elements using strcmp command.
54. After comparing if the condition gets satisfied, values for weight are generated using the mass of the elements.
55. As the values are in string format we use str2double command to convert them into numbers.
56. The converted numbers are given a name 'number'
57. Using the 'if' condition we calculate the molecular weight of the species.
58. If the number is greater than one then the molecular weight of the species is calculated as shown in the code.
59. Using the fprintf command we print each of the species names while getting the results in the command window.
60. By following the above steps, all the required parameters are calculated and plotted. The code, plots, images are attached below.
The main code for the above explanation is given below:
clear all
close all
clc

%opening the given file using fopen command
given_file = fopen('THERMO.dat','r');

%to skip the first line and getting the next line
a = fgetl(given_file);

%given global temparatures
temp = fgetl(given_file);
%converting the temperature values string to number using str2num command
temp = str2num(temp);

%seperating the global temparature values
%low temperature
global_low_temp = temp(1);
%high temperature
global_high_temp = temp(3);
%medium temperature
global_med_temp = temp(2);

%universal gas constant value
R = 8.314;

%to skip the first three lines in the data
%using for loop
for i=1:3
    fgetl(given_file);
end

%extracting the species from the data
%using the for loop to extract 53 species
for i = 1:53
    %first line is given name as temp line
    temp_line = fgetl(given_file);
    %removing the spaces between the data in the temp line
    %using strsplit command to remove the spaces
    A = strsplit(temp_line,' ');

    %species of the data
    species = A{1};

    %getting the local temperatures for each species
    low_temp = str2num(A{end-3});
    med_temp = str2num(A{end-1});
    high_temp = str2num(A{end-2});

    %creating temparature values between low temp  and high temp
    %getting 500 values between two temperatures using linspace command
    T = linspace(low_temp,high_temp,500);

    %finding the coefficients of the species
    %first line is taken as line1
    line1 = fgetl(given_file);

    %finding the position of the coefficients
    %taking E as the seperating element
    %using findstr command to find E in the line1
    position1 = strfind(line1,'E');

    %getting the coefficients for high temperature (a1,a2,a3,a4,a5) from first line
    %coefficient1
    a1 = str2num(line1(1:position1(1)+3));
    %coefficient2
    a2 = str2num(line1(position1(1)+4:position1(2)+3));
    %coefficient3
    a3 = str2num(line1(position1(2)+4:position1(3)+3));
    %coefficient4
    a4 = str2num(line1(position1(3)+4:position1(4)+3));
    %coefficient5
    a5 = str2num(line1(position1(4)+4:position1(5)+3));

    %getting the coefficients from second line
    line2 = fgetl(given_file);
    %taking E as the seperating element
    %using findstr command to find E in the line2
    position2 = strfind(line2,'E');
    %coefficient6
    a6 = str2num(line2(1:position2(1)+3));
    %coefficient7
    a7 = str2num(line2(position2(1)+4:position2(2)+3));

    %getting the low temp coefficients
    %coefficient8
    a8 = str2num(line2(position2(2)+4:position2(3)+3));
    %coefficient9
    a9 = str2num(line2(position2(3)+4:position2(4)+3));
    %coefficient10
    a10 = str2num(line2(position2(4)+4:position2(5)+3));

    %getting values from line 3
    line3 = fgetl(given_file);
    position3 = strfind(line3,'E');
    %finding the remaining coeffs
    %coefficient11
    a11 = str2num(line3(1:position3(1)+3));
    %coefficient12
    a12 = str2num(line3(position3(1)+4:position3(2)+3));
    %coefficient13
    a13 = str2num(line3(position3(2)+4:position3(3)+3));
    %coefficient14
    a14 = str2num(line3(position3(3)+4:position3(4)+3));

    %calculating specific heat using function
    Cp = specific_heat(a1,a2,a3,a4,a5,a8,a9,a10,a11,a12,med_temp,T,R);

    %calculating enthalpy using function
    H = enthalpy_h(a1,a2,a3,a4,a5,a6,a8,a9,a10,a11,a12,a13,med_temp,T,R);

    %calculation of entropy using function
    S = entropy_s(a1,a2,a3,a4,a5,a7,a8,a9,a10,a11,a12,a14,med_temp,T,R);

    %changing the directory of the species
    %creatinig a new folder for species
    mkdir(species);
    cd(species);

    %plotting
    %in figure 1
    figure(1);
    %plotting temp and specific heat
    plot(T,Cp);
    %labelling the axis
    xlabel('Temparature');
    ylabel('Specifiic heat');
    %title of the plot
    title('Specific heat vs Temparature',sprintf('%s',species));
    %saving the plot in jpg format
    saveas(figure(1),'Cp vs T.jpg');

    %plotting
    %in figure 2
    figure(2);
    %plotiing temp and enthalpy
    plot(T,H);
    %labelling the axis
    xlabel('Temparature');
    ylabel('Enthalpy');
    %title of the plot
    title('Enthalpy vs Temparature',sprintf('%s',species));
    %saving the plot in jpg format
    saveas(figure(2),'H vs T.jpg');

    %plotting
    %in figure 3
    figure(3);
    %plotiing temp and entropy
    plot(T,S);
    %labelling the axis
    xlabel('Temparature');
    ylabel('Entropy');
    %title of the plot
    title('Entropy vs Temparature',sprintf('%s',species));
    %saving the plot in jpg format
    saveas(figure(3),'S vs T.jpg');

    %reverting back to the program
    cd ..    ;

    %calculating the molecular weight of the species
    M = molecular_weight(species)
    %to shutoff the warning 'already file exists in directory'
    warning('off', 'MATLAB:MKDIR:DirectoryExists')
end
using function command to solve specific heat
the code for specific heat is as follows:
%using function command
%to solve the specific heat with the given formula
%formula for cp is Cp/R = al + a2 T + a3 T*2 + a4 T*3 + a5 T*4
%inputs for the function are a1,a2,a3,a4,a5,a8,a9,a10,a11,a12,med_temp,T,R

function [Cp] = specific_heat(a1,a2,a3,a4,a5,a8,a9,a10,a11,a12,med_temp,T,R)
         %calculation of cp with high temperature coeffs and low temp coeffs
         %using if condition
         if (T<=med_temp)
             %calculating for low temp coeffs
             Cp = R*(a8+(a9*T)+(a10*(T).^2)+(a11*(T).^3)+(a12*(T).^4));
         else
             %calculating for high temp coeffs
             Cp = R*(a1+(a2*T)+(a3*(T).^2)+(a4*(T).^3)+(a5*(T).^4));

         end
end
using the function command to calculate the enthalpy
the code for enthalpy is as follows:
%using function command to find enthalpy of the species
%giving file name as enthalpy_h
%inputs of the function are a1,a2,a3,a4,a5,a6,a8,a9,a10,a11,a12,a13,med_temp,T,R

function [H] = enthalpy_h(a1,a2,a3,a4,a5,a6,a8,a9,a10,a11,a12,a13,med_temp,T,R)
         %calculation of H with high temp and low temp coeffs
         %using if condition
         if (T<=med_temp)
             %formula for enthalpy
             %H/RT = al + a2 T /2 + a3 T*2 /3 + a4 T*3 /4 + a5 T*4 /5 + a6/T

             %calculating for low temp coeffs
             H = R*T.*(a8+((a9*T)/2+((a10*(T).^2)/3)+((a11*(T).^3)/4)+((a12*(T).^4)/5)+((a13./T))));
         else
             %calculating for high temp coeffs
             H = R*T.*(a1+((a2*T)/2+((a3*(T).^2)/3)+((a4*(T).^3)/4)+((a5*(T).^4)/5)+((a6./T))));

         end
end
using the function command to solve entropy
the code for entropy is as follows:
%calculation of entropy using the function command
%giving file name as entropy_s
%inputs of the function are a1,a2,a3,a4,a5,a7,a8,a9,a10,a11,a12,a14,med_temp,T,R
function [S] = entropy_s(a1,a2,a3,a4,a5,a7,a8,a9,a10,a11,a12,a14,med_temp,T,R)
         %using if condition to find S for high temp and low temp coeffs
         if (T<=med_temp)
             %formula for entropy
             %S/R = a1 lnT + a2 T + a3 T*2 /2 + a4 T*3 /3 + a5 T*4 /4 + a7
             %calculating for low temp coeffs
             S = R*(a8*log(T)+(a9*T)+(a10*(T.^2)/2)+(a11*(T.^3)/3)+(a12*(T.^4)/4)+(a14));
         else
             %calculating for high temp coeffs
             S = R*(a1*log(T)+(a2*T)+(a3*(T.^2)/2)+(a4*(T.^3)/3)+(a5*(T.^4)/4)+(a7));
         end

end
using function command to calculate the molecular weight of the species
the code for molecular weight is as follows:
%using function command to solve the molecular weight of the species
function [M] = molecular_weight(species)
         %creating array of base elements
         Base_elements = ['H','C','O','N','Ar'];
         %creating an array of mass of base elements
         mass_of_elements = [1.008 12.001 16 14.007 40];
         %initial weight
         initial_weight = 0;

         %using for loop
         for i = 1:length(species)
             for j = 1:length(Base_elements)
                 %using strcmp to compare species and elements
                 if strcmp(species(i),Base_elements(j))
                     %weight of the elements after comparing with species
                     Weight = initial_weight + mass_of_elements(j);
                     position_of_elements = j;
                 end
             end
             %converting the values of species to numbers
             number = str2double(species(i));
             %calculating the molecular weight
             if (number>1)
                 Weight = Weight+(mass_of_elements(position_of_elements)*(number-1));
             end
             M = Weight;
         end
         fprintf(species)
end
Screenshot of the window of the saved folders:

Plots of O2, N2 and CO2 species:
Plot of O2 species:
1. Temp vs Cp
2. Temp vs H
3. Temp vs S
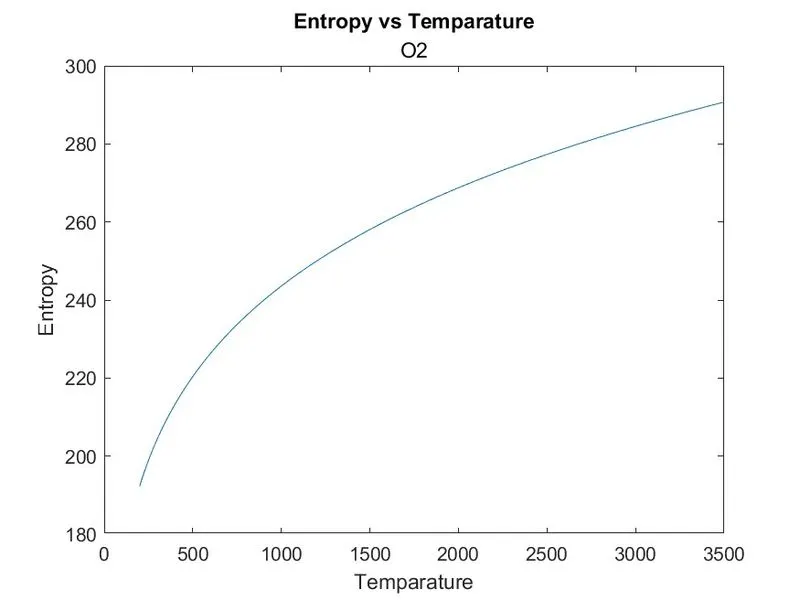
2. Plots of N2 species:
1. Temp vs Cp
2. Temp vs H
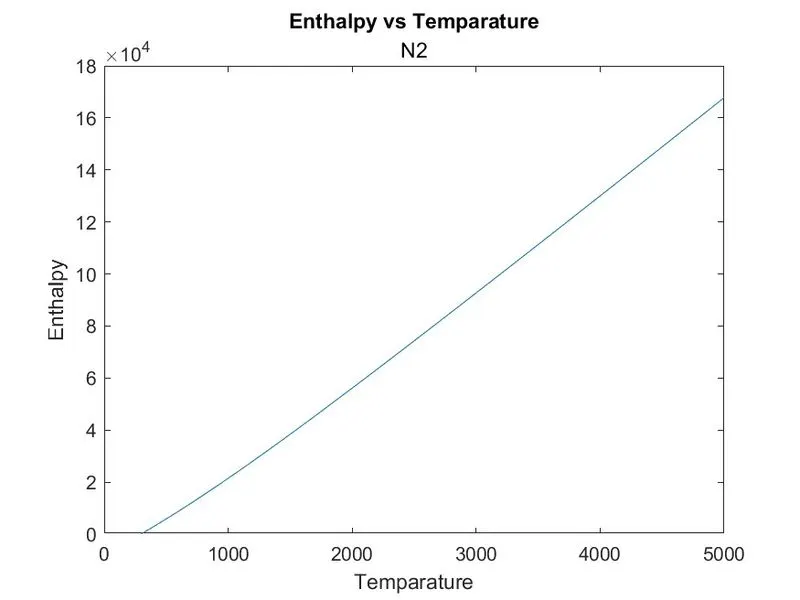
3. Temp vs S
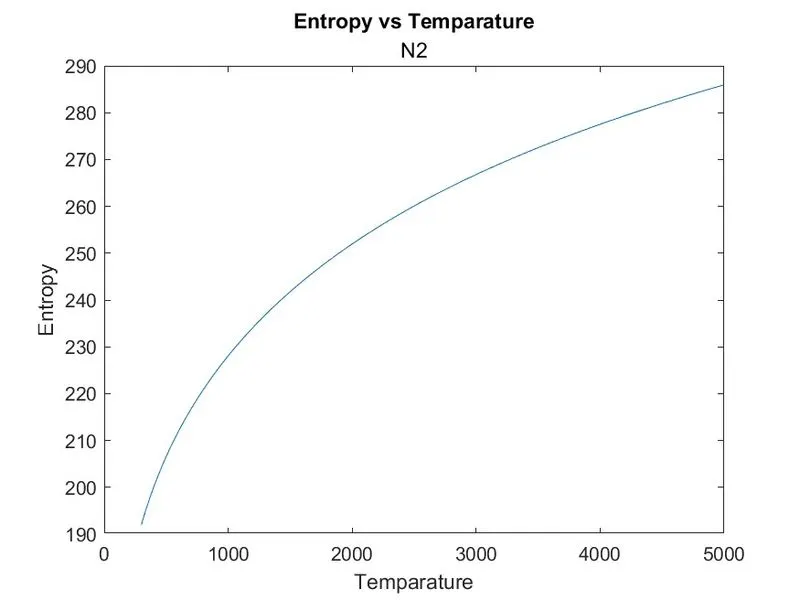
3. Plots of CO2 species:
1 Temp vs Cp
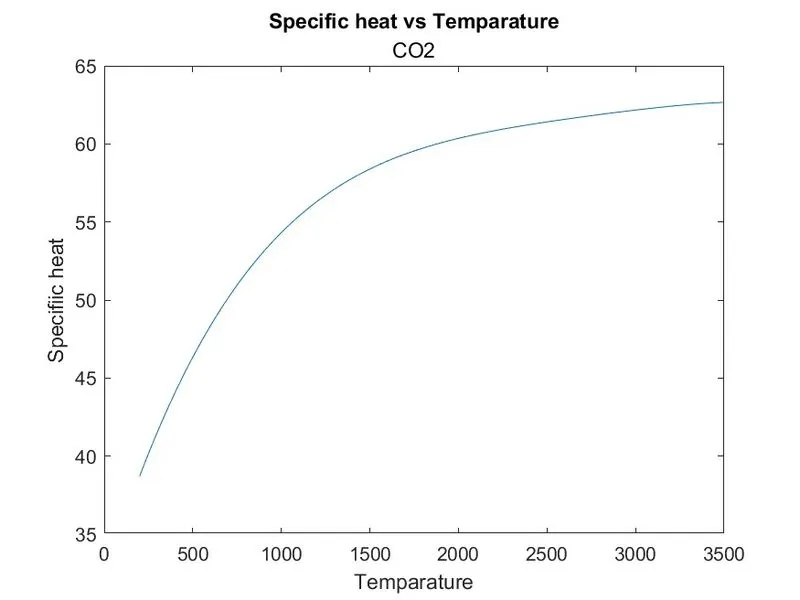
2. Temp vs H
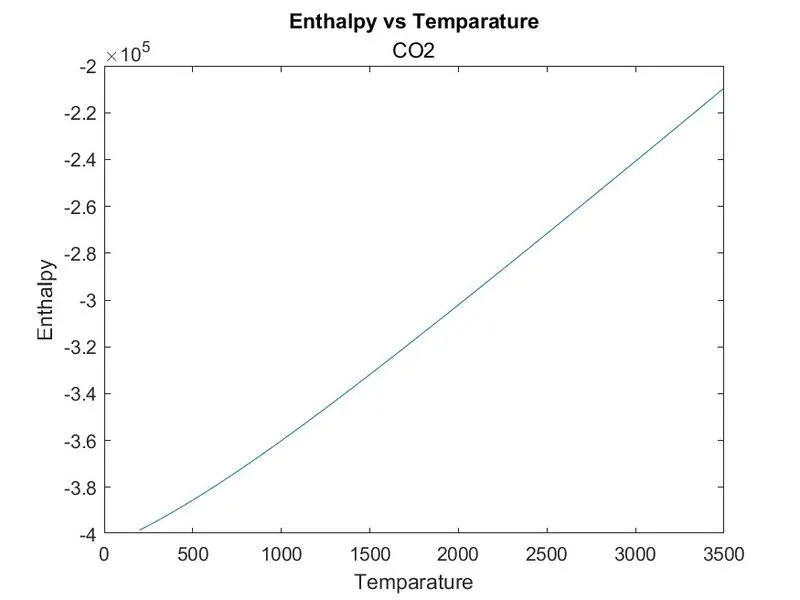
3. Temp vs S
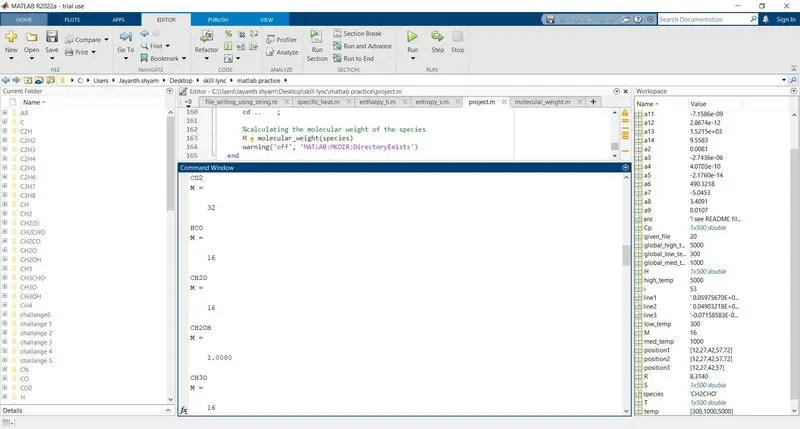
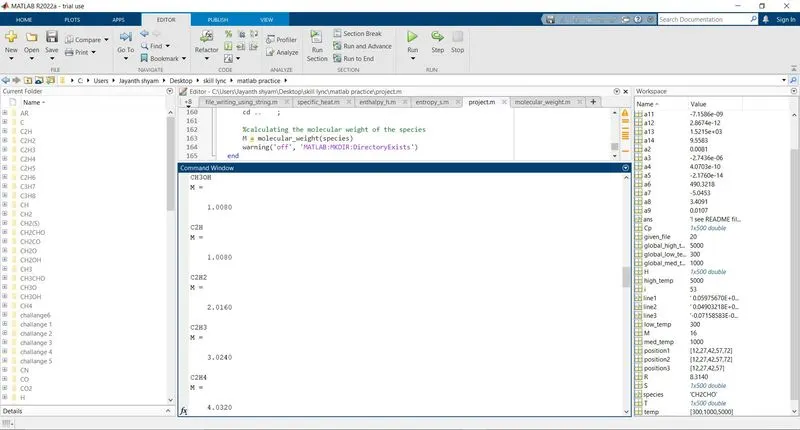
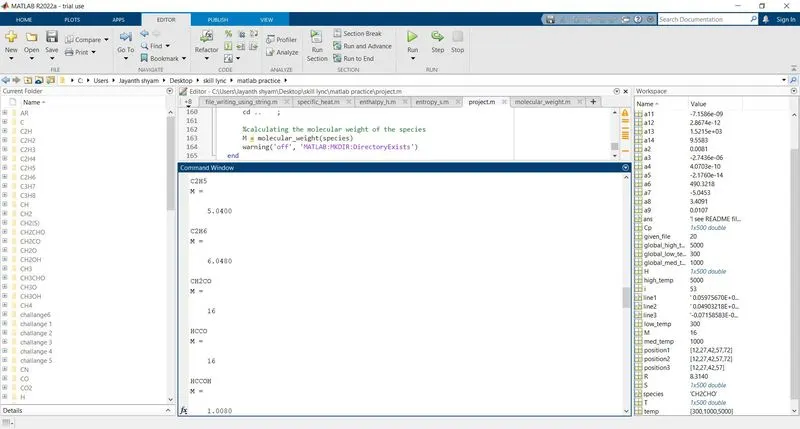
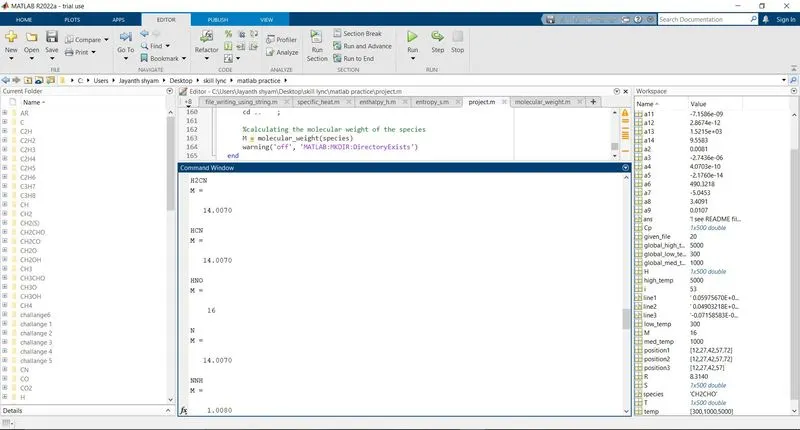
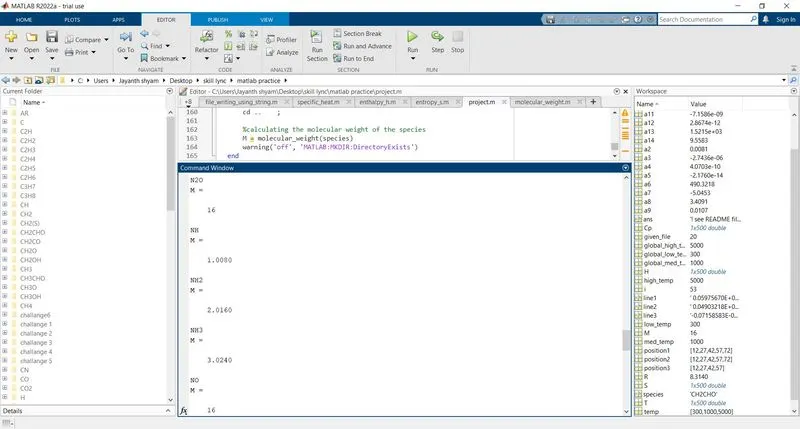
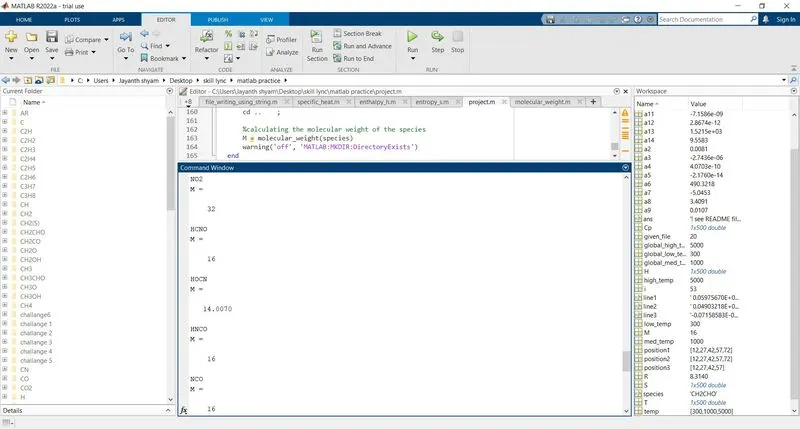
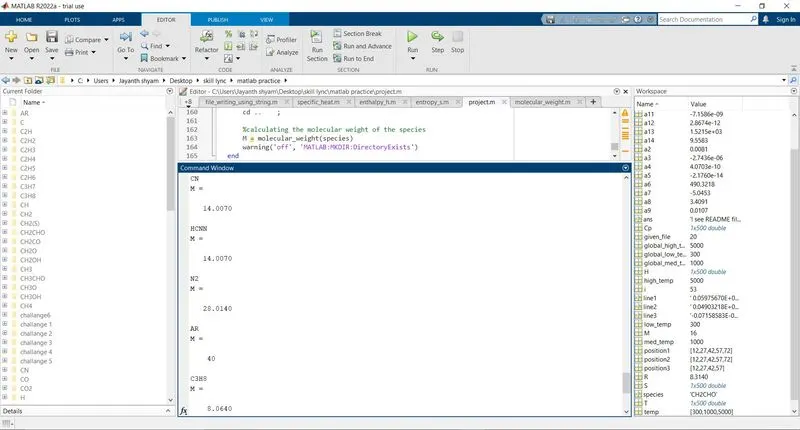
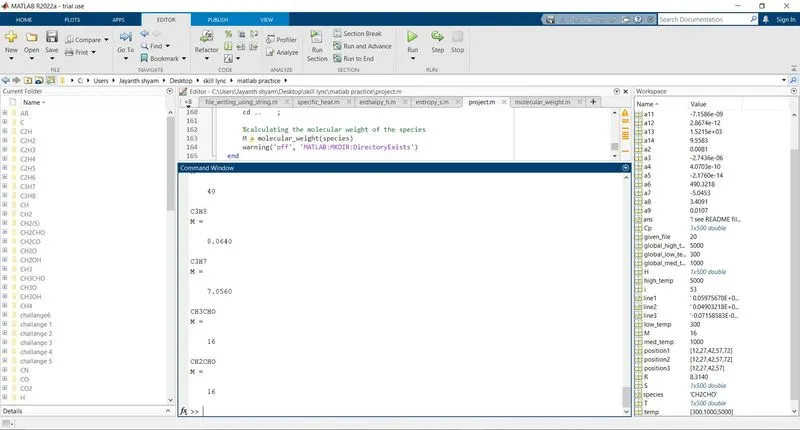
Images of molecular weight of all the species in the command window:
End of the report.