Project 1 - Parsing NASA thermodynamic data using MATLAB
AIM:
To write a Code to Parse the NASA thermodynamic data file and calculate the thermodynamic properties of various gas species using MATLAB.
Challenge expectations:
- Write a function that extracts the co-efficient and calculates the enthalpy, entropy, and specific heats for all the species in the data file.
- Calculate the molecular weight of each species and display it in the command window.
- plot the Cp, Enthalpy, and Entropy for the local temperature range specified for each species.
- Save all the species with suitable names automatically in appropriate folders.
CONCEPT:
- Specific Heat:
Specific heat is the quantity of heat required to raise the temperature of one gram of a substance by one Celsius degree. The units of specific heat are usually calories or joules per gram per Celsius degree. It is denoted as Cp. - Enthalpy:
The sum of the Internal Energy and the product of the pressure and volume of a thermodynamic system. When a process takes place at constant pressure, the heat absorbed or released is equal to the Enthalpy change. Enthalpy is sometimes known as “heat content”, but “enthalpy” is an interesting and unusual word, so most people like to use it. Etymologically, the word “entropy” is derived from the Greek, meaning “turning” and “enthalpy” is derived from the Greek meaning “warming”. As for pronunciation, Entropy is usually stressed on its first syllable, while enthalpy is usually stressed on the second. It is denoted by H.
Enthalpy H can be written as,
H = U + pV
Where, H = Enthalpy of the system
U = Internal energy of the system
p = Pressure of the system
V = Volume of the system
UNITS- The Enthalpy is expressed as,
H = Energy/Mass
- Entropy:
The measure of a system’s thermal energy per unit temperature that is unavailable for doing useful work. Because work is obtained from ordered molecular motion, the amount of entropy is also a measure of the molecular disorder, or randomness, of a system. It is denoted by S. - Parsing:
The process of transforming the data from one format to another is called Parsing. This process can be accomplished by the parser. The parser is a component of the translator that helps to organize linear text structure following the set of defined rules which is known as grammar.
There are two types of Parsing:
- The Top-down Parsing
- The Bottom-up Parsing
- Gas Constant:
The gas constant is a physical constant denoted by R and is expressed in terms of units of energy per temperature increment per mole. It is also known as the Ideal gas constant or molar gas constant or universal gas constant.

Molecular Weight:
Molecular weight is a measure of the sum of atomic weight values of the atoms in a molecule. Molecular weight is used in chemistry to determine stoichiometry in chemical reactions and equations.
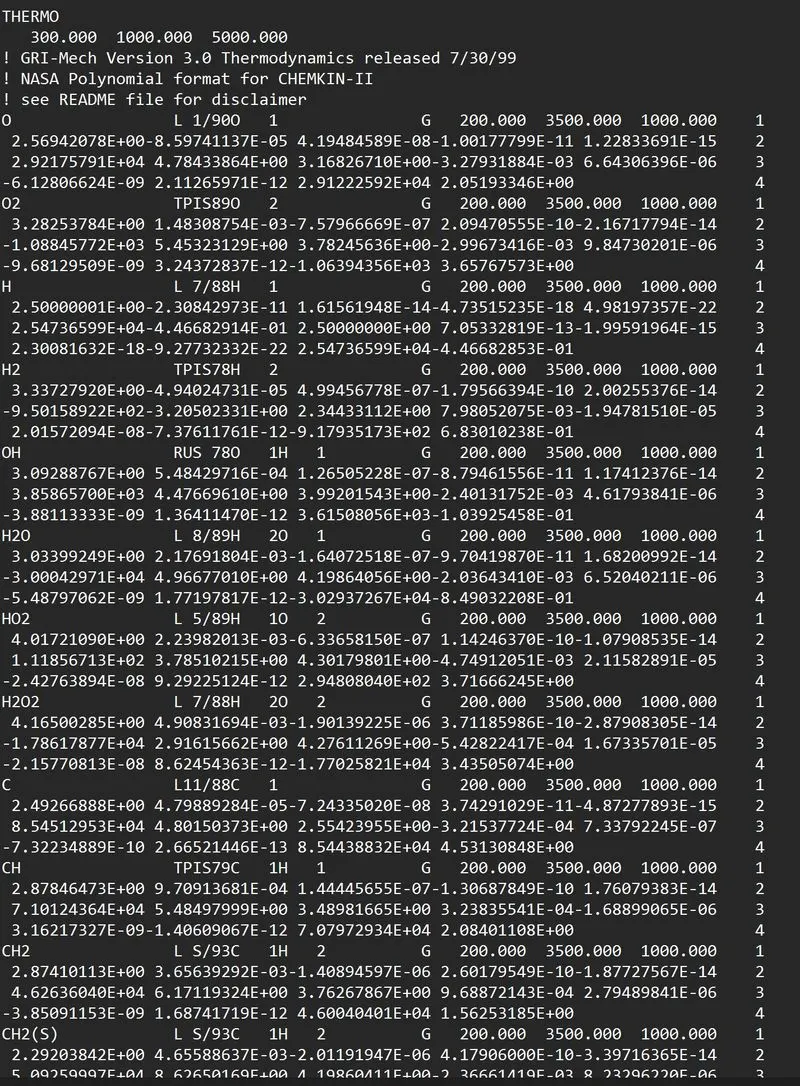
NASA thermodynamic file which is THERMO.dat file in which there are temperature ranges and 53 species are given in these data and each species contain 14 coefficients and temperature ranges and we have to parse these 14 coefficients to find specific heat. Entropy and Enthalpy using as:
where,
R = Universal Gas Constant
T = Temperature
Cp = Specific Heat(k)
H = Enthalpy(KJ/mol-k)
a(i) = coeeficents where, i = 1 to 14
The formula of specific heat, Enthalpy, and Entropy is mentioned below:
The Data File :
Steps:
- Thermo.dat file - The Input parameter.
- fgetl - we read temperature and split the temperature.
- strsplit - Convert cell into array.
- str2num - Find the lower and higher Temperatures.
- mkdir - To create file folder.
- cd - Change the directory.
PROCEDURE:
Function code-
function [c_p,H,S] = thermo_properties(a1,a2,a3,a4,a5,a6,a7,a8,a9,a10,a11,a12,a13,a14,l_mid,T)
R =8.314;

if (T>=l_mid)
    c_p = R.*(a1+a2*T+a3*T.^2+a4*T.^3+a5*T.^4);
    H = R.*T.*(a1+a2*(T/2)+a3*((T.^2)./3)+a4*((T.^3)./4)+a5*((T.^4)./5)+a6./T);
    S = R.*(a1*log(T)+a2*T+a3*((T.^2)./2)+a4*((T.^3)./3)+a5*((T.^4)./4)+a7);

else
    c_p = R.*(a8+a9*T+a10*T.^2+a11*T.^3+a12*T.^4);
    H = R.*T.*(a8+a9*(T/2)+a10*((T.^2)./3)+a11*((T.^3)./4)+a12*((T.^4)./5)+(a13./T));
    S = R.*(a8*log(T)+a9*T+a10*((T.^2)./2)+a11*((T.^3)./3)+a12*((T.^4)./4)+a14);

end
Explanation: For Function Code
- We start with writing the function command for Cp, H, and S.
- Then we introduce the If and Else command to the conditional statement to pass the right coefficients to find the specific heat and then end the statement with the end command hence closing the function.
Main code-
clear all
close all
clc

% Opening the file and extracting data
f1 = fopen('THERMO.dat','r')
 d = fgetl(f1);
A = strsplit(fgetl(f1),' ');

% Extracting Global Temperatures
global_low_temp = str2double(A{2});
global_mid_temp = str2double(A{3});
global_high_temp = str2double(A{4});
fgetl(f1);
fgetl(f1);
fgetl(f1);

% Getting input from user
n = input('Enter the compound name: ','s');

while ~feof(f1)

    % Extracting the local temperatures
    line1 = strsplit(fgetl(f1), ' ');
    if strcmpi(line1,'END')==1
        break
    end

    species_name = line1{1};
    if strcmpi(n,species_name)==1
        r=length(line1);
        l_low = str2num(line1{r-3});
        l_mid = str2num(line1{r-1});
        l_high = str2num(line1{r-2});

        % Extracting Co-efficients
        line2 = fgetl(f1);
        strpos12 = strfind(line2,'E');
        a1 = str2num(line2(1:strpos12(1)+3));
        a2 = str2num(line2(strpos12(1)+4:strpos12(2)+3));
        a3 = str2num(line2(strpos12(2)+4:strpos12(3)+3));
        a4 = str2num(line2(strpos12(3)+4:strpos12(4)+3));
        a5 = str2num(line2(strpos12(4)+4:strpos12(5)+3));


        line3 = fgetl(f1);
        strpos13 = strfind(line3,'E');
        a6 = str2num(line2(1:strpos13(1)+3));
        a7 = str2num(line2(strpos13(1)+4:strpos12(2)+3));
        a8 = str2num(line2(strpos13(2)+4:strpos12(3)+3));
        a9 = str2num(line2(strpos13(3)+4:strpos12(4)+3));
        a10 = str2num(line2(strpos13(4)+4:strpos12(5)+3));

        line4 = fgetl(f1);
        strpos14 = strfind(line4, 'E');
        a11 = str2num(line4(1:strpos14(1)+3));
        a12 = str2num(line4(strpos14(1)+4:strpos14(2)+3));
        a13 = str2num(line4(strpos14(2)+4:strpos14(3)+3));
        a14 = str2num(line4(strpos14(3)+4:strpos14(4)+3));

        T = linspace(l_low,l_high,100);

        for i = 1:length(T)
            [c_p,H,S] = thermo_properties(a1,a2,a3,a4,a5,a6,a7,a8,a9,a10,a11,a12,a13,a14,l_mid,T)
        end

        % Changing directory and saving the plots in that directory

        mkdir(species_name)
        cd(species_name)

        % Creating the plots
        figure(1)
        plot(T,c_p,'linewidth',1.5,'color','r')
        xlabel('Temperature(K)');
        ylabel('Specific Heat (J/kgK)');
        title('Specific Heat vs Temperature Plot')
        grid on
        m1 = 'Specific Heat of %s';
        m2 = species_name;
        m3 = sprintf(m1,m2);
        saveas(figure(1),sprintf('%s.png',m3))

        figure(2)
        plot(T,H,'linewidth',1.5,'color','g')
        xlabel('Temperature(K)');
        ylabel('Enthalpy (J/mol)');
        title('Enthalpy vs Temperature Plot')
        grid on
        m4 = 'Enthalpy (H) of %s';
        m5 = species_name;
        m6 = sprintf(m4,m5);
        saveas(figure(2),sprintf('%s.png',m6))

        figure(3)
        plot(T,S,'linewidth',1.5,'color','b')
        xlabel('Temperature(K)');
        ylabel('Entropy (J/K)');
        title('Entropy vs Temperature Plot')
        grid on
        m7 = 'Entropy of %s';
        m8 = species_name;
        m9 = sprintf(m7,m8);
        saveas(figure(3),sprintf('%s.png',m9))

        % Changing back to directory
       cd 'C:UsersRAJDesktoptemp programprojectsProject-1'


        % Calculating the molecular weight
        [molecular_wt]=mw(species_name);
    end
end

% Closing the File
fclose(f1);
Explanation: For Main Code Basic commands are used
-
clear all - To clear all the variables from the current workspace.
-
clc - Clear all the texts from the command window.
-
close all - Close all figures whose handles are visible.
-
plot - This command is used to Plot Graph.
- Linewidth - The line width command is given to the width of the line which is going
to be plotted on a graph.
-
title - For giving title to the graph.
-
legend - It is used for indication of the line.
-
xlabel - labeling X-axis.
-
ylabel - labeling Y-axis.
- fopen - It opens the file, the file name for binary read access, and returns an integer file identifier equal to or greater than 3.
- fgetl - It returns an output that displays in one line.
- str2num - Converts a character into an array or string scalar to a numeric matrix.
- linspace - The linspace function generates linearly spaced vectors.
- strsplit - It is used to split a string. We should enter the String Id and delimiter.
- {A1} - It is used for indexing in a cell array. After string splitting A becomes a cell array.
- Findstr - It is used to find a particular string in a collection of strings.
- cp - To change the directory.
- mkdir - It is used to create a new folder.
- color - To give a required color for the graphical representation.
- Reading and storing the values of the global temperature into a simple value and creating an array for temperature now writing the universal Gas constant value(R), creating a variable for storing the species name.
- Now defining the Local temperatures, extracting and storing coefficients from the dat file, and calling the function (Cp, H, S)
- Now Plotting the graph for respective Plots.
Molecular code-
function [molecular_wt] = mw(species_name)

elements = ['H','C','N','O','A'];
atomic_wt = [1,12,14,16,40];
molecular_wt = 0;

for i = 1:length(species_name)
    for j = 1:length(elements)
        if strcmpi(species_name(i),elements(j))
            position = j;
        end
    end
    f = str2double(species_name(i));
    if f>1
        molecular_wt = molecular_wt + atomic_wt(postion)*(f-1);
    end
end
sprintf('The molecular weight of %s is %d', species_name, molecular-wt)
end
Explanation: For Molecular Code
- fprintf - This command displays formatted text centered on the icon and can display format specifier along with the contents of variables.
- disp - It displays the value of variable X without printing the variable code
Errors while programming
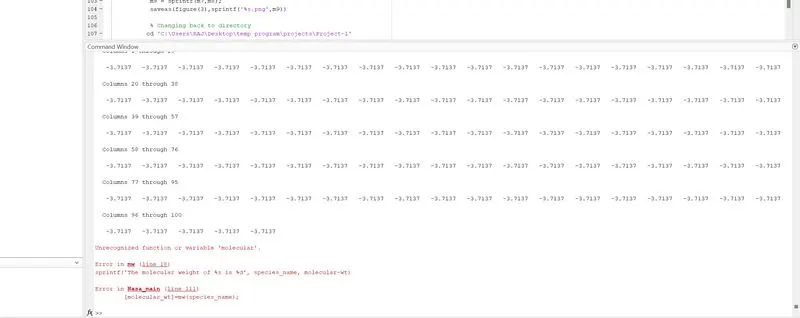
- Made a lot of typing errors in the code
Thank you guys at skill-lync for the support for this project and for helping out with this code.
RESULTS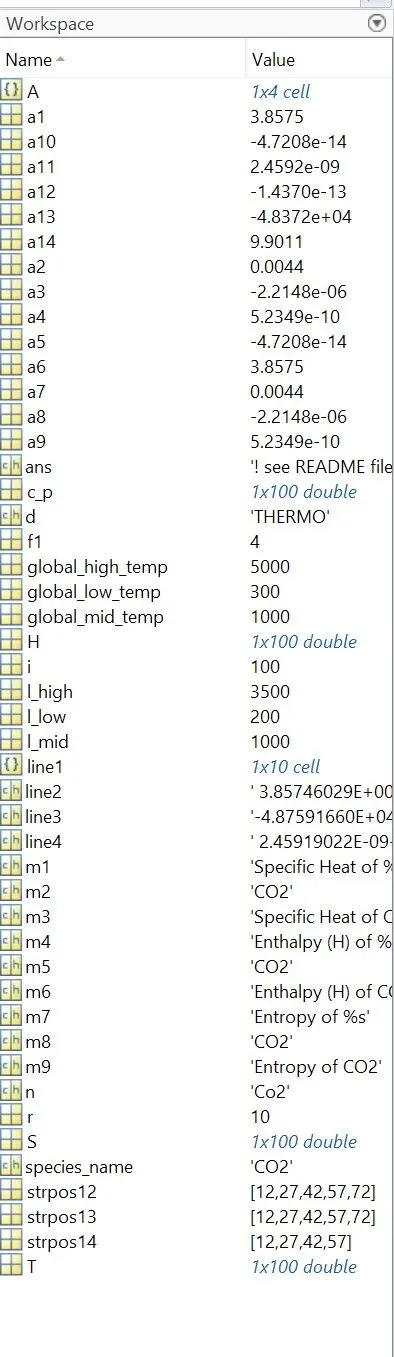
Results for 'O2':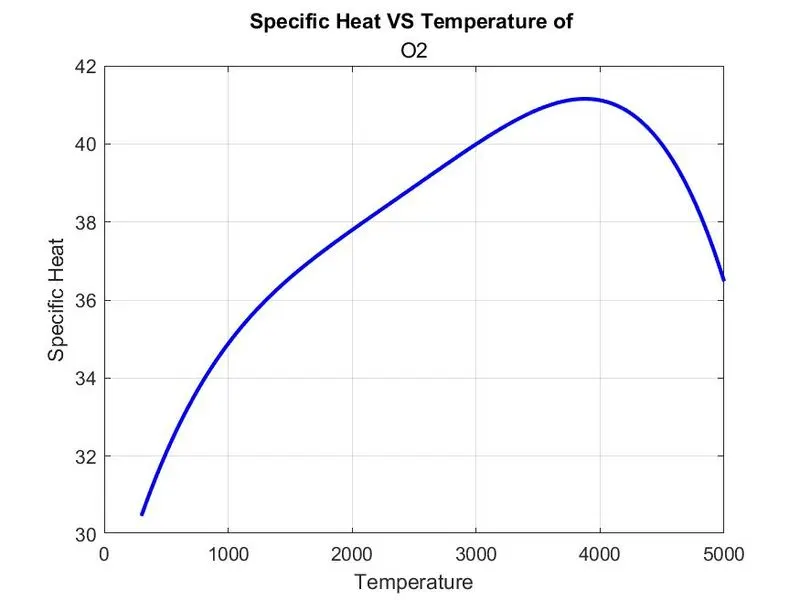
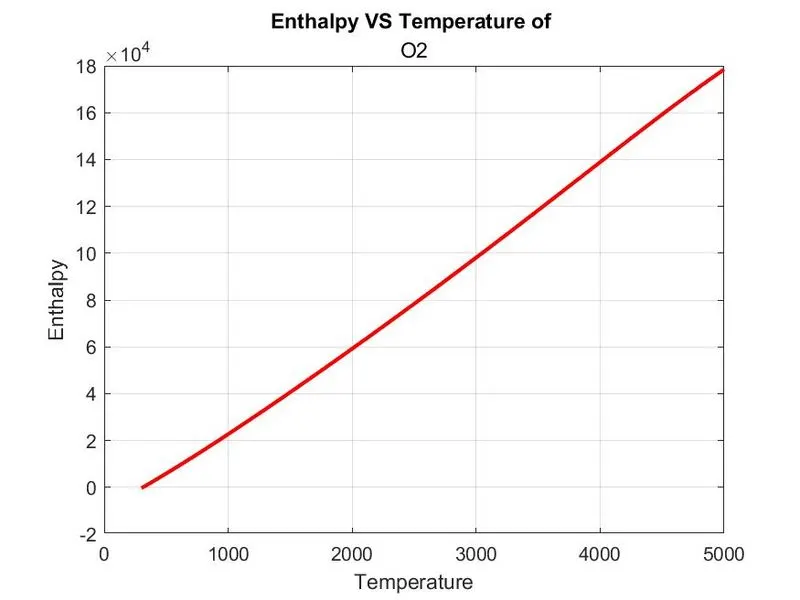
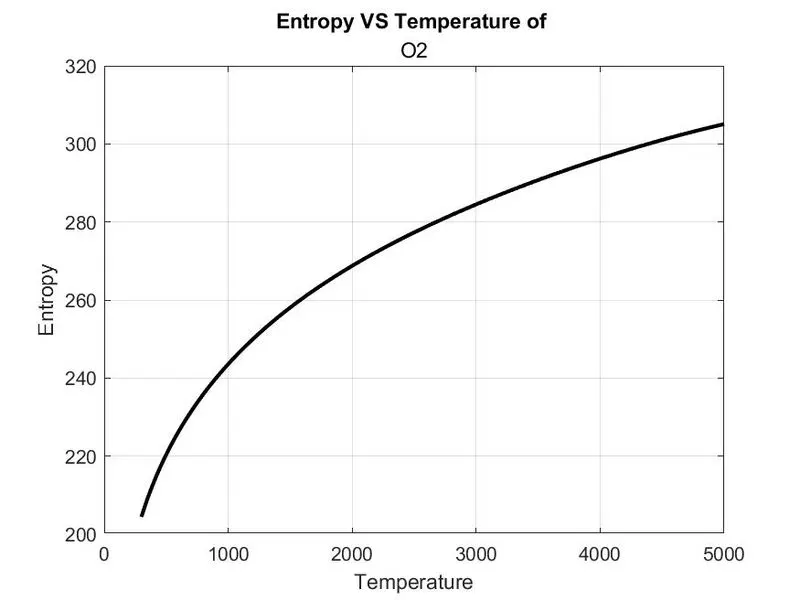
Results for 'N2':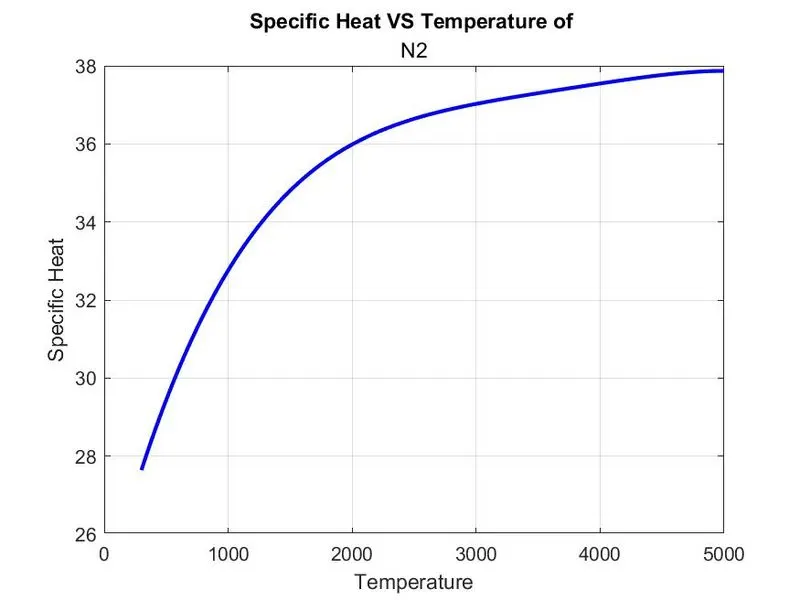
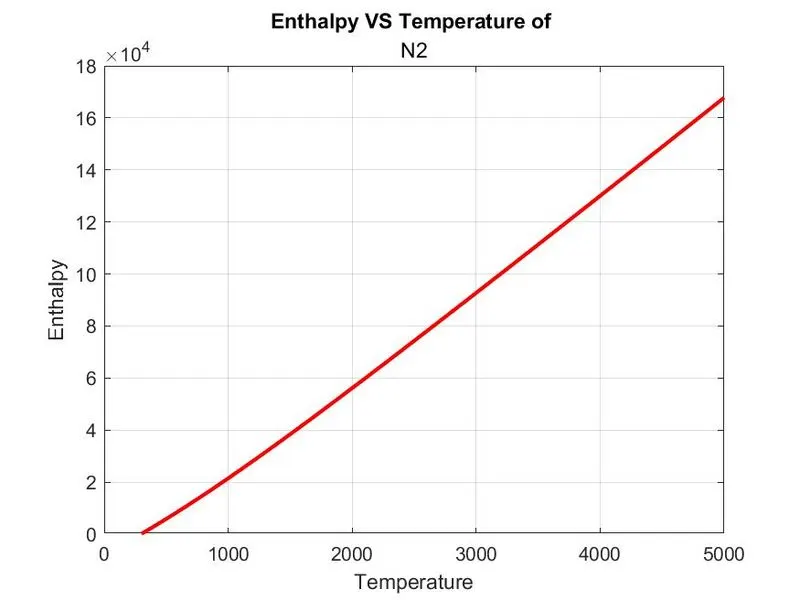
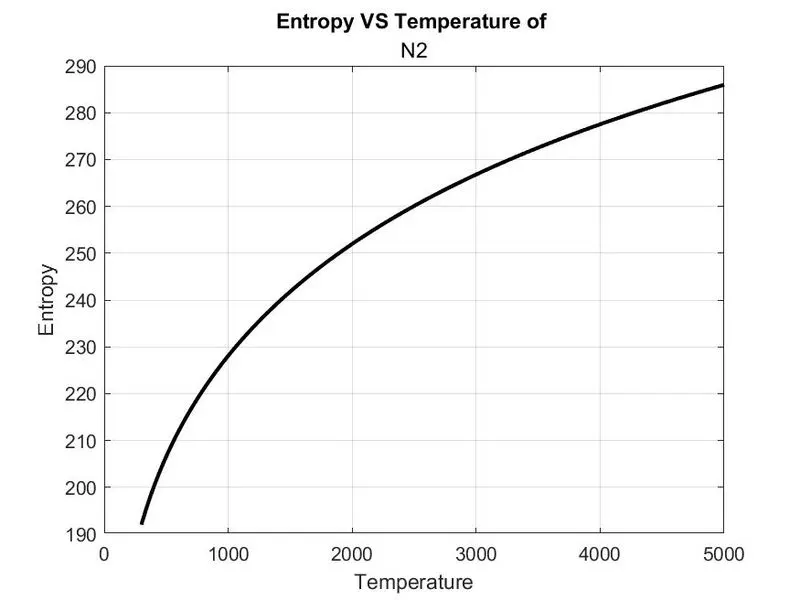
Results for 'N2':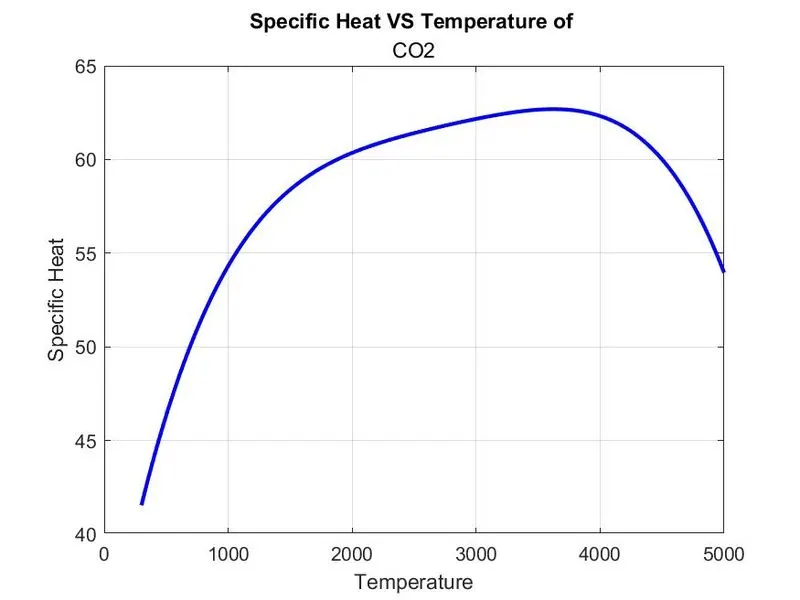
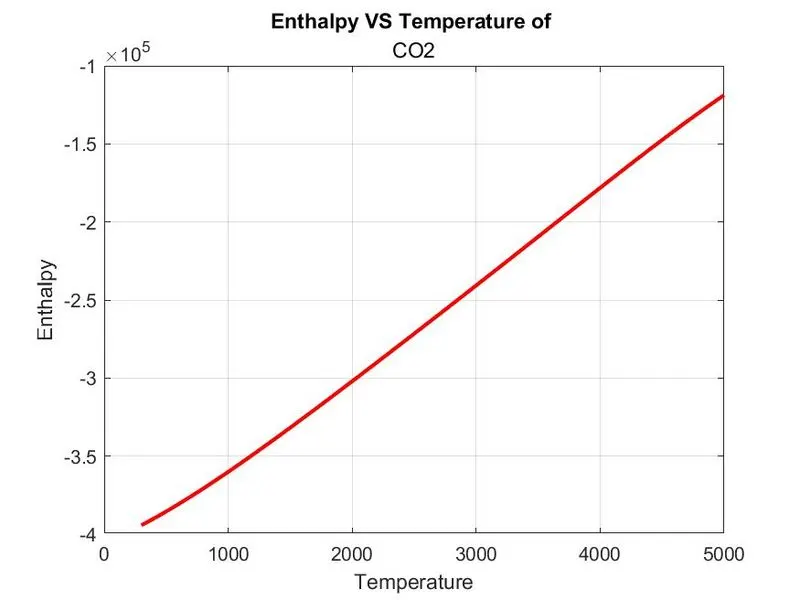
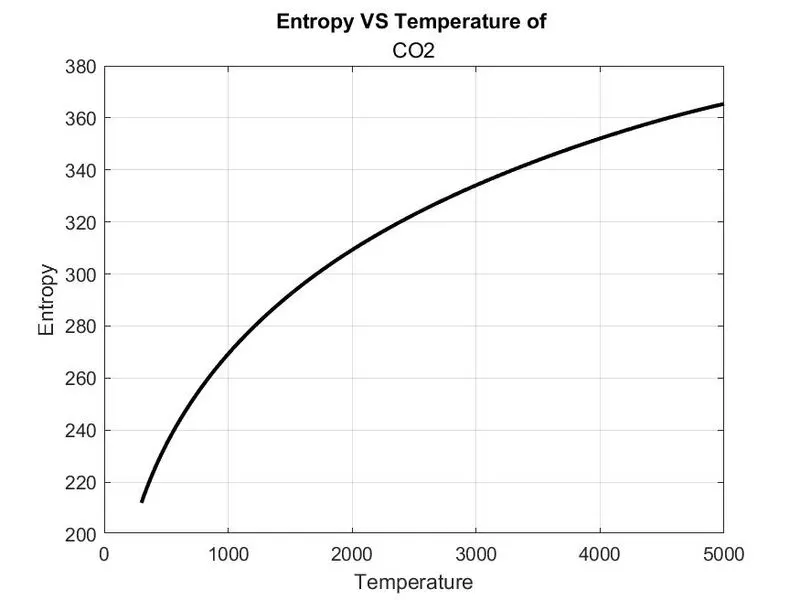
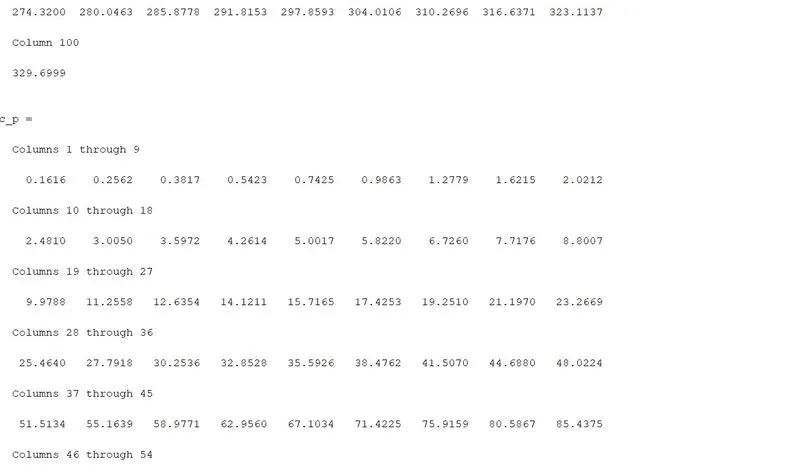
Command windows results:
Screenshot of Folder created automatically:

Drive Link:
https://drive.google.com/drive/folders/1R1lgnLY5UbliDUuFnBh_rKiJs5YgT5qU?usp=sharing
CONCLUSION:
Hence, we conclude that the code when executed the required data was extracted from the NASA thermodynamic data file. With this data, we calculated the specific heat, enthalpy, and entropy. we also plotted graphs with data. A new folder is created where all the data is saved.
REFERENCES: