Project 1 - Parsing NASA thermodynamic data
Aim:
To write a code in Matlab to parse the NASA thermodynamic data file and then calculate the thermodynamic properties of various gas species.
Objective:
To write a function that extracts the 14 co-efficients and calculates the enthalpy, entropy and specific heats for all the species in the data file. You will be reading this file NASA thermodynamic dats (Tip: use fopen and fgetl).
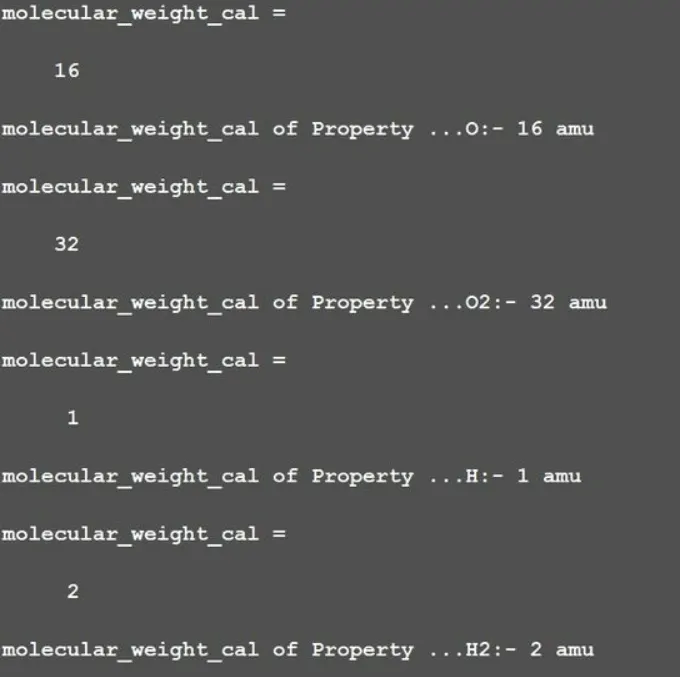
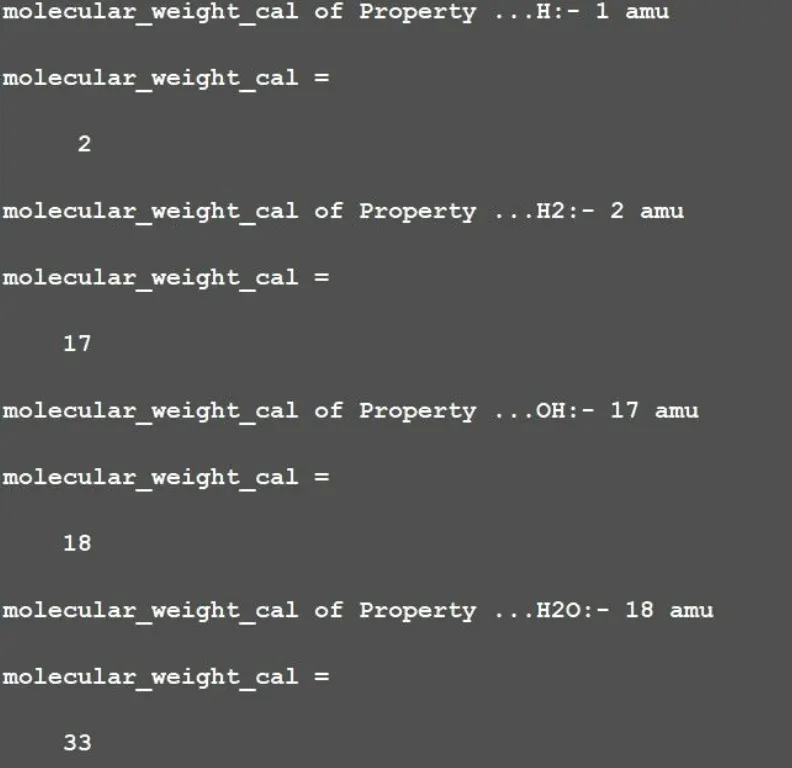
To calculate the molecular weight of each species and display it in the command window.
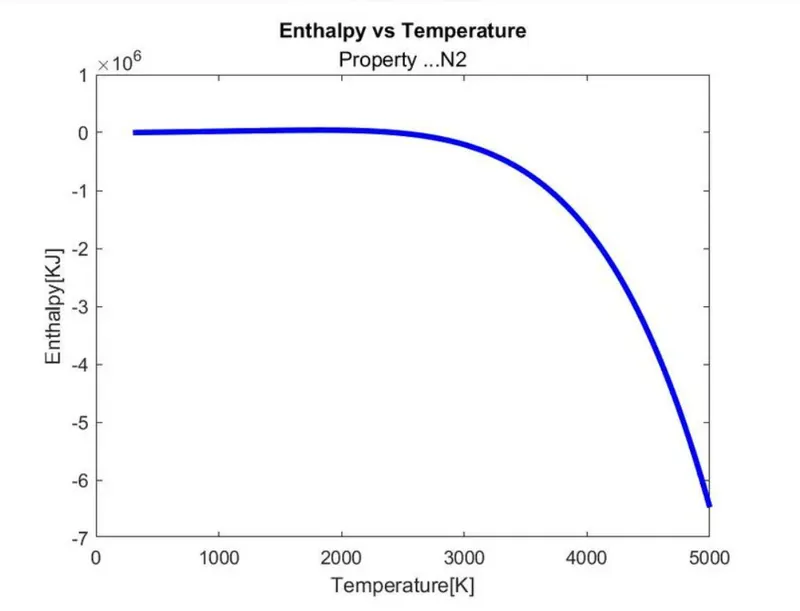
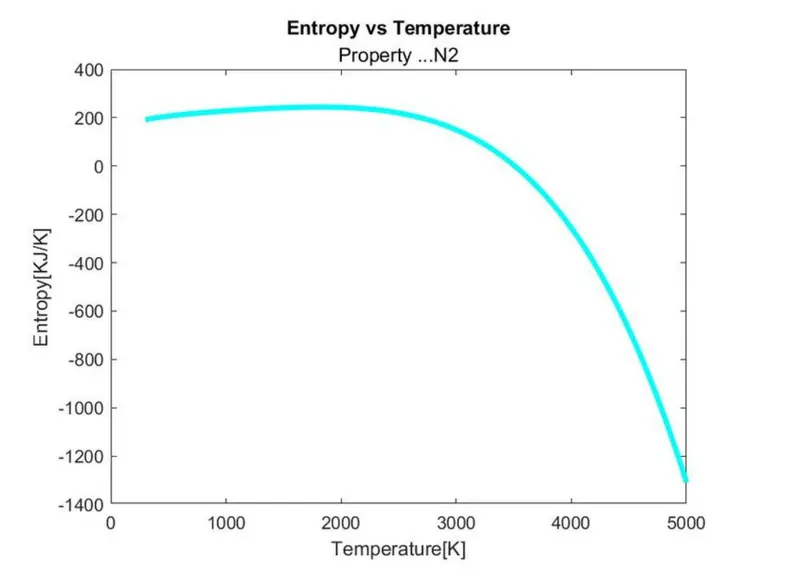
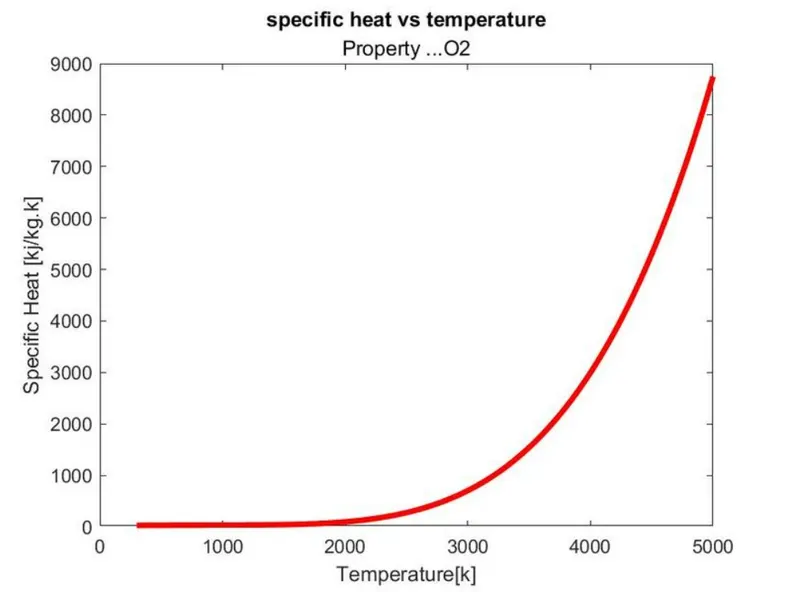
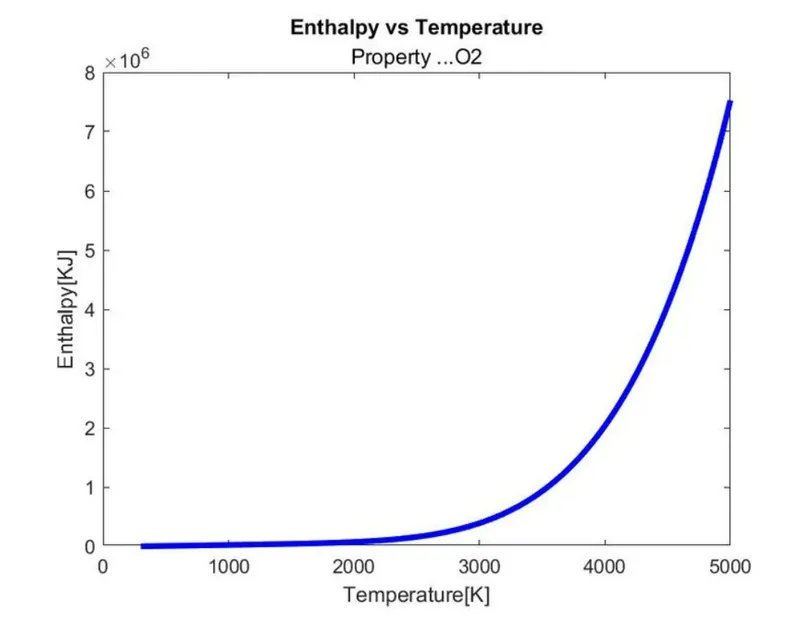
To plot the Cp, Enthalpy and Entropy for the local temperature range (low temperature : high temperature) specific for each species.
Save the plots as images with appropriate names and dump them in separate folders for each species with suitable name. All these should be generated automatically.
The main program that you will submit will just take the "THERMO.dat" file as an input and generate Cp, H and S plots.
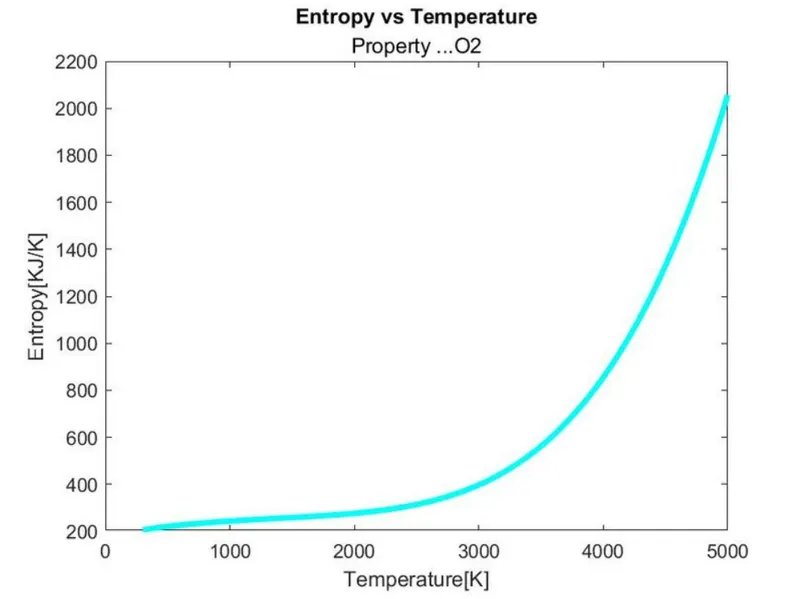
Screenshot of the window where all the folders are saved and plots for o2, N2 and Co2 species
Formula:
where,
R = Universal Gas Constant
T = Temperature
H = Enthalpy(KJ/mol)
Cp = Specific Heat(KJ)
S = Entropy(Kj/mol - k)
a(i) = Coefficients where i is 1 to 14.
Specific Heat:
Specific heat, the quantity of heat required to raise the temperature of one gram of a substance by one Celsius degree. The units of specific heat are usually calories or joules per gram per Celsius degree.
Enthalpy:
Enthalpy, a property of a thermodynamic system, is the sum of the system's internal energy and the product of its pressure and volume. It is a state function used in many measurements in chemical, biological, and physical systems at a constant pressure, which is conveniently provided by the large ambient atmosphere

H = enthalpy
E = internal energy
P = pressure
V = volume
Entropy:
Entropy, the measure of a system’s thermal energy per unit temperature that is unavailable for doing useful work. Because work is obtained from ordered molecular motion, the amount of entropy is also a measure of the molecular disorder, or randomness, of a system.
File Parsing:
Parsing a file means reading in a data stream and building a memory model of the content of that data. This aims at facilitating perfoming some kind of transformation on the data. Parsing splits a file or other input into pieces of data that can be easily stored or manipulated. The File Parser process enables you to convert data from an external file into readable data for usage of the data. The external file can be a delimited file or a flat file. It can be a simple file with one row type or a complex file with several row types.
NASA thermodynamic file:
NASA thermodynamic data file consist of coefficients for polynomials. There were temperature range and 53 species are given in these data.Each species contains 14 coefficients and the temperature range we have to parse these coefficients to find the specific heat, entropy and enthalpy using the above formua.
Function to find Cp,H and S:
function [Cp, H, S] = coeff(a1, a2, a3, a4, a5, a6, a7, a8, a9, a10, a11, a12, a13, a14,T)
% Given conditions
R = 8.314;
for j = 1:length(T)
   if T(j) < 300

     Cp = ((a1+a2.*T+a3.*T.^2+a4.*T.^3+a5.*T.^4).*R);
      H = ((a1+(a2.*T)./2+(a3.*T.^2)./3+(a4.*T.^3)./4+(a5.*T.^4)./5+(a6./T)).*R.*T);
      S = ((a1.*log(T)+a2.*T+(a3.*T.^2)./2+(a4.*T.^3)./3+(a5.*T.^4)./4+a7).*R);
   else
     Cp = (a8+a9.*T+a10.*T.^2+a11.*T.^3+a12.*T.^4).*R;
      H = (a8+(a9.*T)./2+(a10.*T.^2)./3+(a11.*T.^3)./4+(a12.*T.^4)./5+(a13./T)).*R.*T;
      S = (a8.*log(T)+a9.*T+(a10.*T.^2)./2+(a11.*T.^3)./3+(a12.*T.^4)./4+a14).*R;
   end
end
end
Explanation:
In this function i have used the formula given above to calculate the specific heat, entropy and enthalpy. The values of the entropy , enthalpy and specific heat can be calculated at once using the for loop. The If else condition is used because we need to find the 7 coefficient of higher temperature and 7 coefficient for lower temperature.
Function to find Molecular weight:
function [molecular_weight_cal] = mole_wt(species_name)
elements = {'H', 'N','O', 'C','A'};
atomic_mass = [1 14 16 12 40];

mol_wt = 0;
for i = 1:length(species_name)
  for j = 1:length(elements)
    if strcmp(species_name(i), elements(j))
        mol_wt = mol_wt + atomic_mass(j);
        m = j;
    end
  end
  s = str2double(species_name(i));
   if s > 1
      mol_wt = mol_wt+(atomic_mass (m)*(s-1));
   end
end
molecular_weight_cal = mol_wt
fprintf('molecular_weight_cal of %s:- ', species_name)
fprintf('%d',molecular_weight_cal)
fprintf(' ')
fprintf('amu')
fprintf('n')
end
Explanation:
Here we can see that the thermodynamic data contains 5 species that are oxygen, carbon, nitrogen, Hydrogen, Argon. These are named as elements and are stored in array. Where as their atomic masses are stored in atomic mass array.The For loop is used so that the process gets repeated for each and every species. Strcmp command is used to compare the elements and corresponding atomic mass. And the molecular weight is stored in mol_wt. And Hence the molecular weight is calculated. Now this function is called to the main code.
Main Code:
%% NASA Thermodynamic Data and calculating the molecular weight
clear all
close all
clc


% Getting the header info
f1=fopen('THERMO.dat','r');

header=fgetl(f1);

% Getting the temperature data

global_temp = fgetl(f1);

x = strsplit(global_temp);

global_temp_low = str2double(x{2});
global_temp_mid = str2double(x{3});
global_temp_high = str2double(x{4});

fgetl(f1);
fgetl(f1);
fgetl(f1);

% getting the line
for i = 1:53
   line1 = fgetl(f1);
   species_name = line1(1:6);

   % getting local temp
   local_temp1 = line1(49:55);
   low_temp = str2double(local_temp1);

   local_temp2 = line1(58:65);
   mid_temp = str2double(local_temp2);

   local_temp3 = line1(68:75);
   high_temp = str2double(local_temp3);

   % Extracting the main coefficients from the data

   % coefficient
   line2 = fgetl(f1);
   line3 = fgetl(f1);
   line4 = fgetl(f1);

   a = strfind(line2, 'E');
   b = strfind(line3, 'E');
   c = strfind(line4, 'E');

   % For low temp
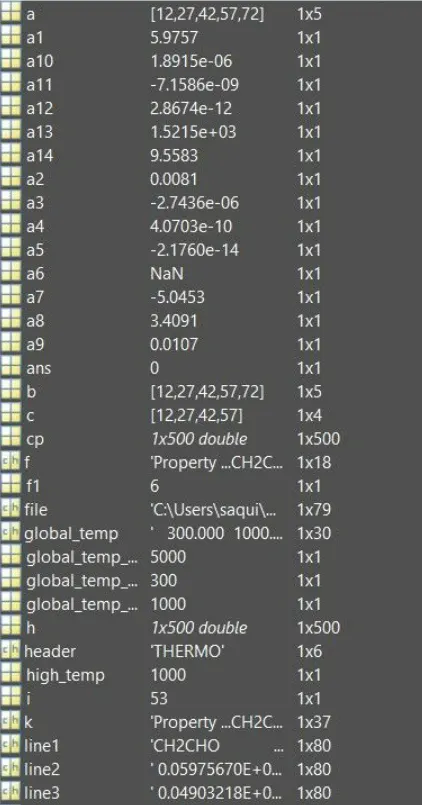
   a1 = str2double(line2(1:a(1)+3));
   a2 = str2double(line2(a(1)+4:a(2)+3));
   a3 = str2double(line2(a(2)+4:a(3)+3));
   a4 = str2double(line2(a(3)+4:a(4)+3));
   a5 = str2double(line2(a(4)+4:a(5)+3));
   a6 = str2double(line3(1:b(2)+3));
   a7 = str2double(line3(b(1)+4:b(2)+3));
   a8 = str2double(line3(b(2)+4:b(3)+3));
   a9 = str2double(line3(b(3)+4:b(4)+3));
   a10 = str2double(line3(b(4)+4:b(5)+3));
   a11 = str2double(line4(1:c(1)+3));
   a12 = str2double(line4(c(1)+4:c(2)+3));
   a13 = str2double(line4(c(2)+4:c(3)+3));
   a14 = str2double(line4(c(3)+4:c(4)+3));

   % Creating a folder 'SPECIES' to save all the species_name
   species_name = strcat('Property ...', species_name);

   file = pwd;

   % Applying universal gas constant
   R = 8.314;
   T = linspace(global_temp_low,global_temp_high, 500);

   % Calculation speicfic heat
   [Cp, H, S] = coeff(a1, a2, a3, a4, a5, a6, a7, a8, a9, a10, a11, a12, a13, a14,T);

   % Plotting the graph
   %plotting between Temperature and specific heat

   figure(1)
   plot(T,Cp, 'linewidth',3,'color', 'r')
   title('Specific heat vs Temperature', species_name);
   xlabel('Temperature[k]')
   ylabel('Specific Heat [kj/kg.k]')
   f = fullfile(species_name);
   cd(f);
   saveas(gcf,[pwd '/specific_heat vs temperature.jpg']);
   cd(file);

   %plotting between Temperature and Enthalpy

   figure (2)
   plot(T,H, 'linewidth', 3,'color', 'b')
   title('Enthalpy vs Temperature', species_name);
   xlabel('Temperature[K]')
   ylabel('Enthalpy[kj]')
   f = fullfile(species_name);
   cd(f);
   saveas (gcf,[pwd '/enthalpy vs temperature.jpg']);
   cd(file);

   %plotting between Temperature and Entropy

   figure(3)
   plot(T,S,'lineWidth',3,'color','c');
   title('Entropy vs Temperature', species_name)
   xlabel('Temperature[K]')
   ylabel('Entropy[KJ/K]')
   f = fullfile(species_name);
   cd(f);
   saveas(gcf,[pwd '/entropy vs temperature.jpg']);
   cd(file);


   molecular_weight_cal = mole_wt(species_name);
   k = sprintf('%s mol_wt = %f', species_name, molecular_weight_cal);
   disp(k);
end
fclose(f1)
Explanation:
- First for a program we need the header of the file.The given program will get the header of the file which start with clear all close all and clc .
- The command fopen is used for reading the thermodynamic data which is stored in the THERMO.dat file.
- The fgetl command returns the next line of the specified file, removing the newline characters.If the file is nonempty, then fgetl returns tline as a character vector.
- If the file is empty and contains only the end of file marker, then fgetl returns tline as -l. We need to get positive values for f1.
- The golbal temp info is stored in the file as a string we can use the command str2double so that it returns the value as string in a cell array.And the we can use str2num command to store the data as numbers. From which we can get the global temperature value. For skipping the next three comments we use fgetl command.
- The species name is stored in length of 6 for that I used linel(1:6) matlab will get the value and the same for getting the low_temp value which is on 49 to 55th location I used the command linel(49:55) matlab will get the values. As well as for higher temp and mid temp.
- Here in this section I have used the terms local_temp which shows that i need the temperature of the species. . And then converting it to the string by using str2double command. low_tmp, high_temp, mid_temp as the name of the temperature.
- To extract co-efficient of the values we can use the fgetl command and seperate the line as line2, line3, line4 and with the help of these lines we can extract the co-efficient.
- We can use the E as a constant and with the help of strfind command we can seperate each coefficients, which lies in same position at every length. And same method can be used for all the 14 co-efficient.And for the string we can use str2num command.
- In order to create a folder I have used the command mkdir which allows matlab to create a new folder to store the species data. Strcat command is used to concatenate a string to identify the name of the folder. Pwd command is used to identify the nature of the folder.
- Next to plot the graph between cp and temperature, enthalpy vs temperature, entropy vs temperature. Saving the graph by using fullfill command which store the entire data generated into the folder. Gcf command is used to handle the current figure. Cd command is used to define path to the folder where the data has to be stored.
Outputs:
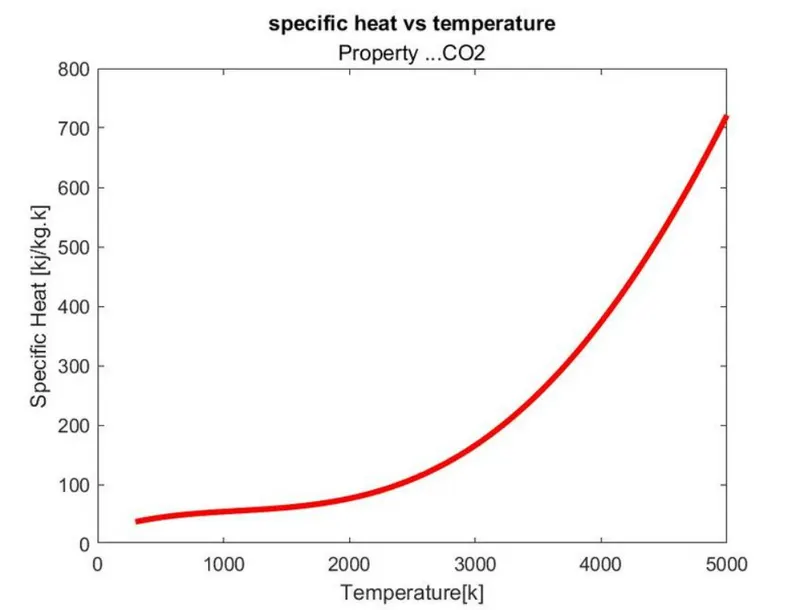
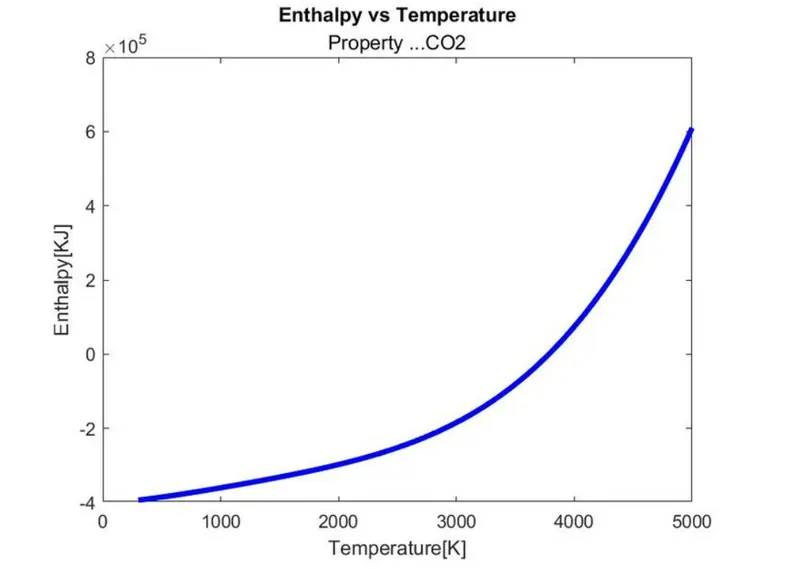
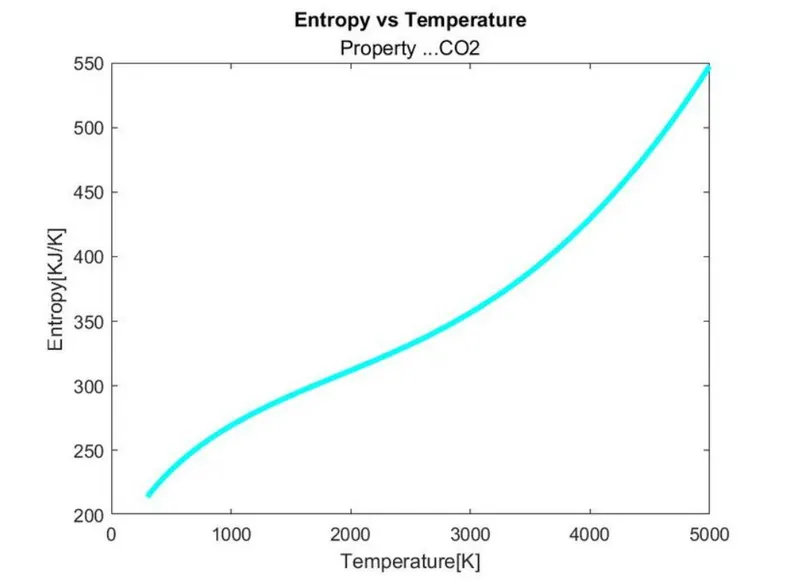
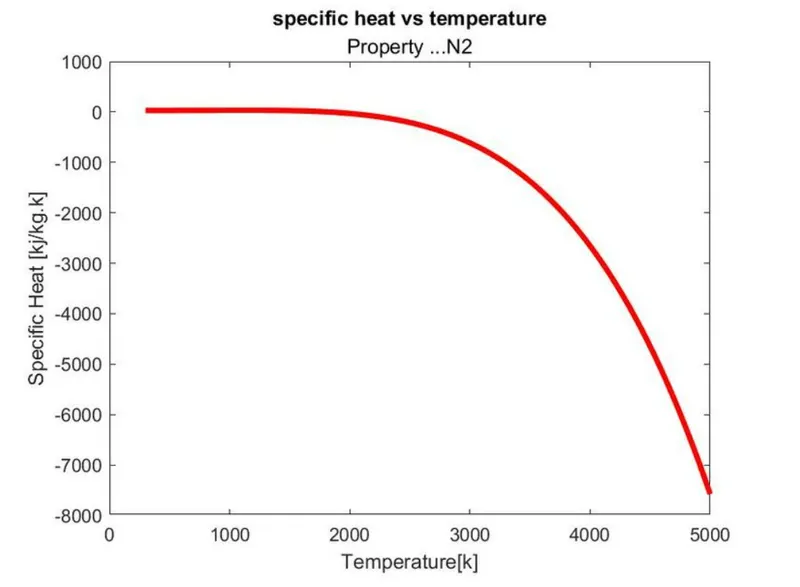
Errors:
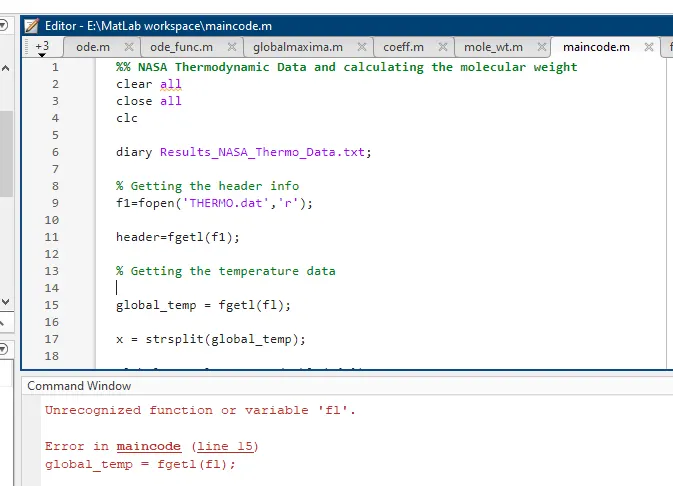
Did a typeover here instead of 1 i accidently typed l and got the following error.
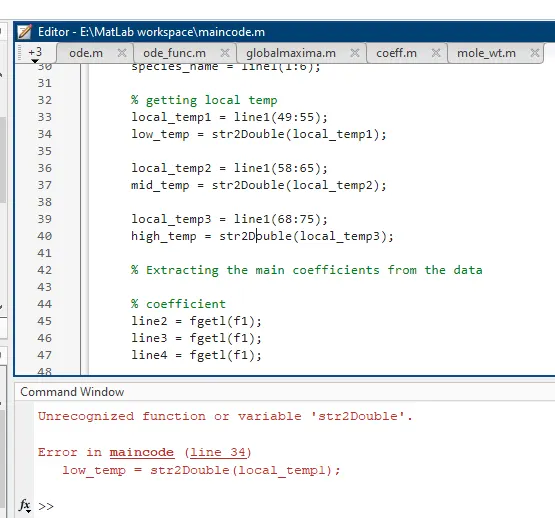
Did a mistake in typing the command name used upper case letters .
Conclusion:
We have created a function that extracts the 14 co-efficients and calculates the enthalpy, entropy and specific heats for all the species in the data file. Thus we have parsed the NASA thermodynamic data file and stored them.