Project 1 - Parsing NASA thermodynamic data
Project 1 - Program for Parsing NASA thermodynamic data
Abstract
The main objective of this project is to solve the Following Questions using matlab software.
Question 1 - calculates the following items in seperate program for all the species in the data file. (solved using function)
- enthalpy - program 1,
- entropy - program 2,
- specific heats -program 3
Question 2 -
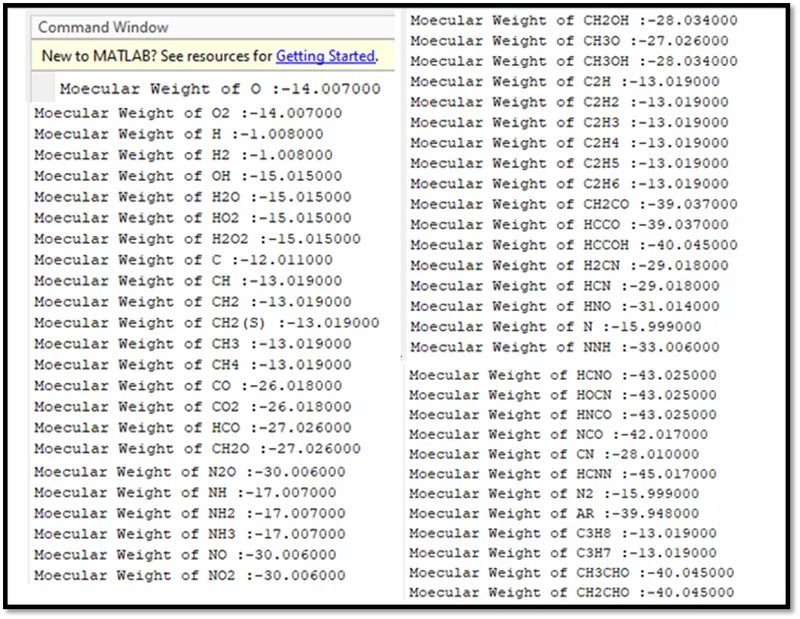
- Calculate the molecular weight of each species and display it in the command window. - Program 4 & Program 5
Question 3 -
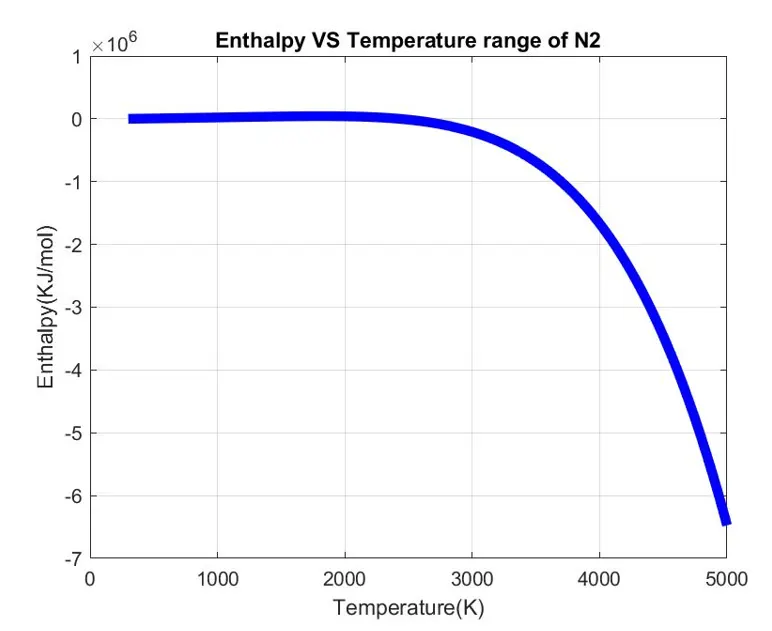
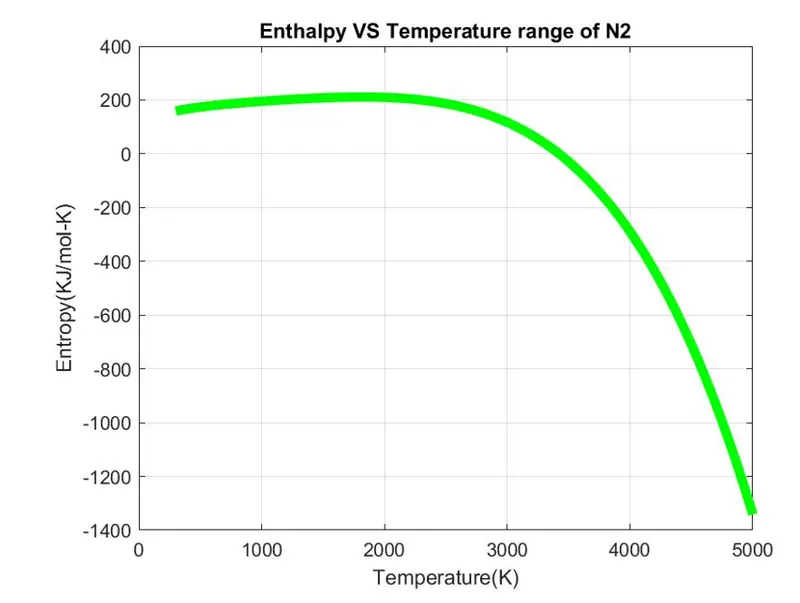
- Plot the Cp, Enthalpy and Entropy for the local temperature range - Program 5
Question 4 -
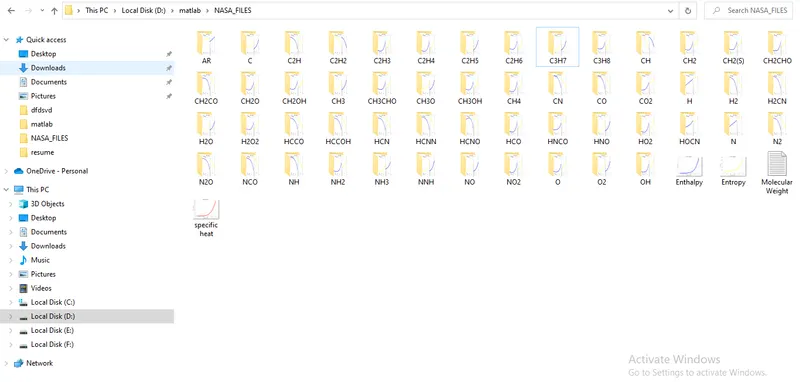
- Save the plots as images with appropriate names and dump them in separate folders. Screenshot of the window where all the folders are saved - Program 5
Question 5 -
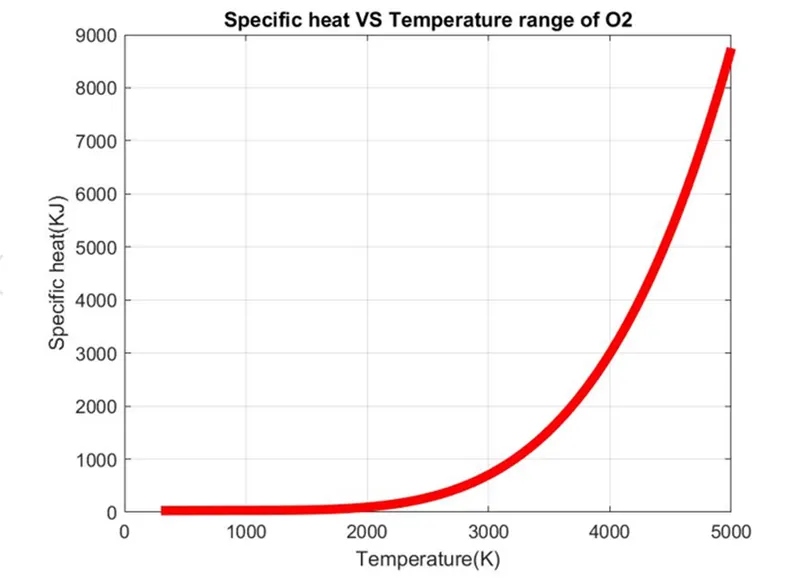
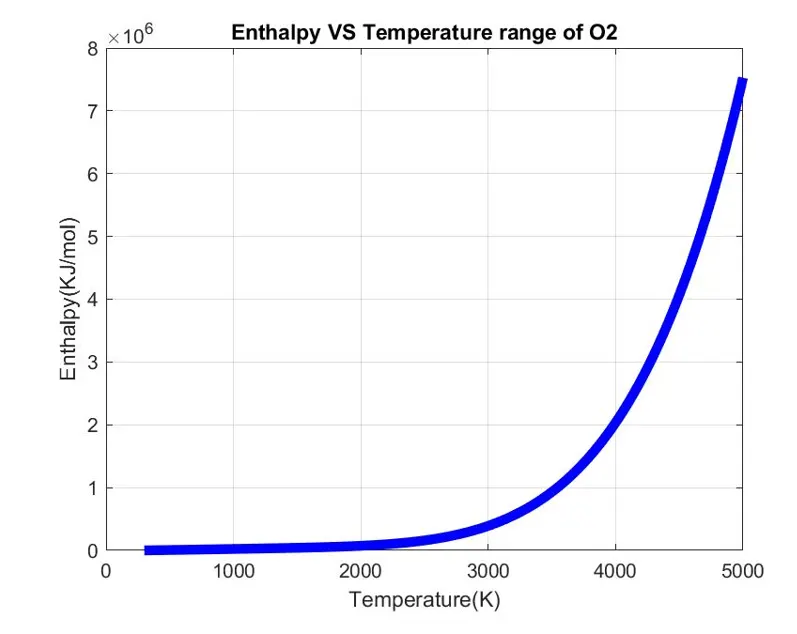
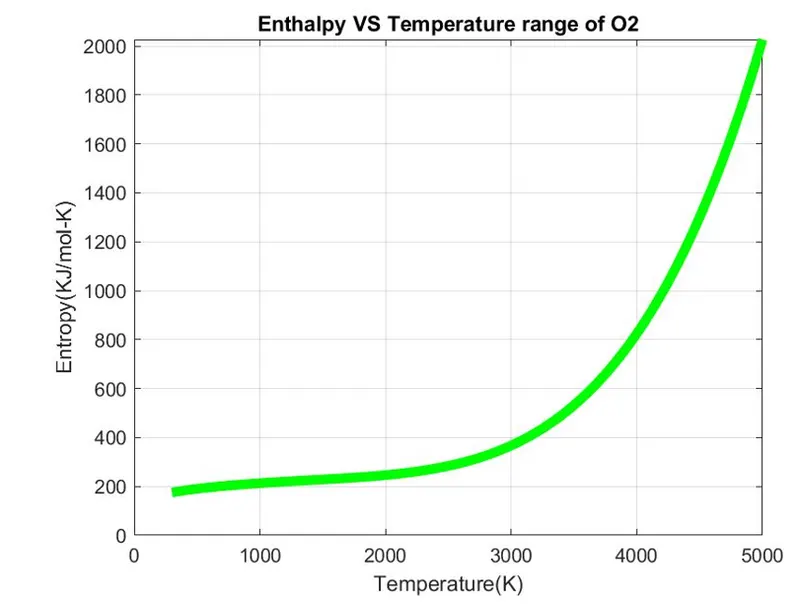
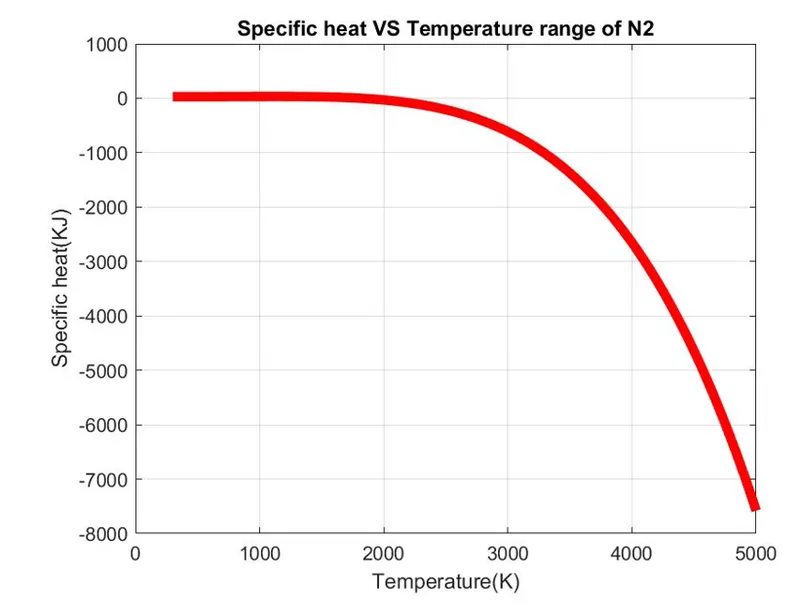
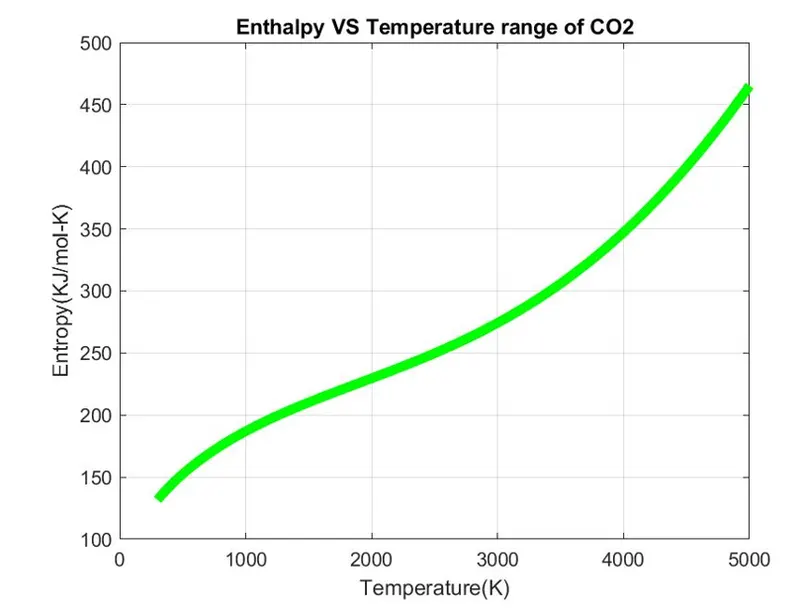
- The main program that you will submit will just take the "THERMO.dat" file as an input and generate Cp, H and S plots.Attach Plots for o2, N2 and Co2 species - Program 5
Keywords
Mat lab,Parsing,Cp, Enthalpy,molecular weight and Entropy
Input Data
NASA Thermodynamic data taken from below link,
https://drive.google.com/file/d/1AikCHDlz9s_fu8whE81qee_GD4AyYpCP/view
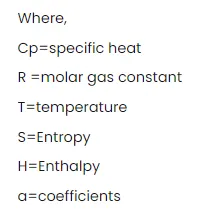
R=8.314 - MOLAR GAS CONSTANT.
Formula

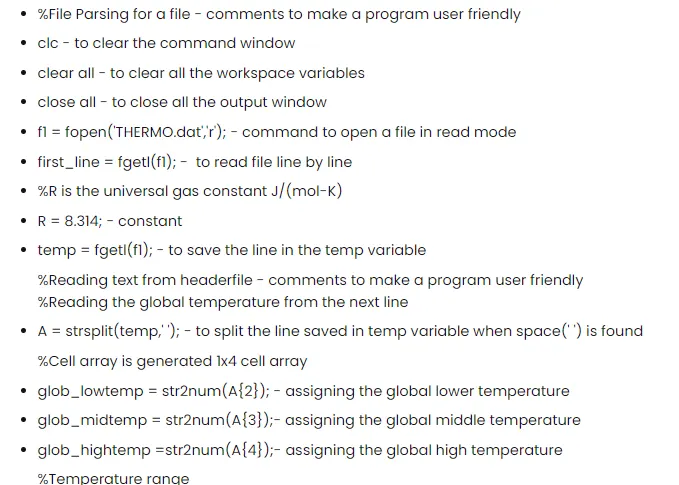
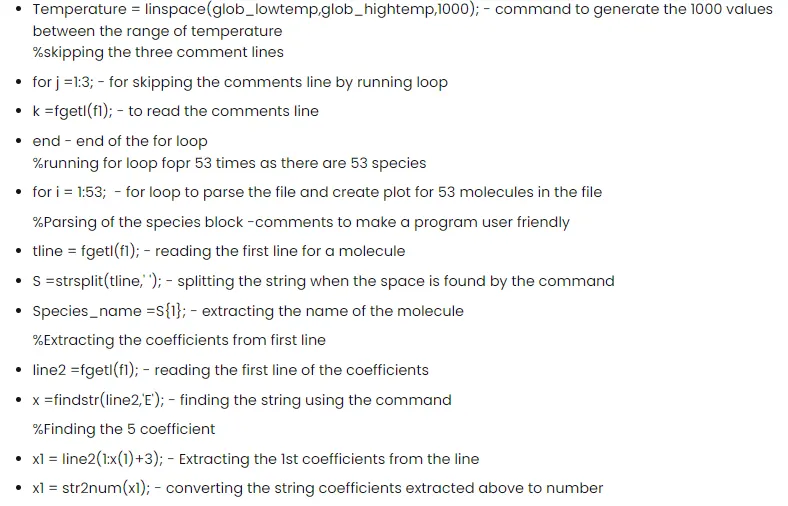
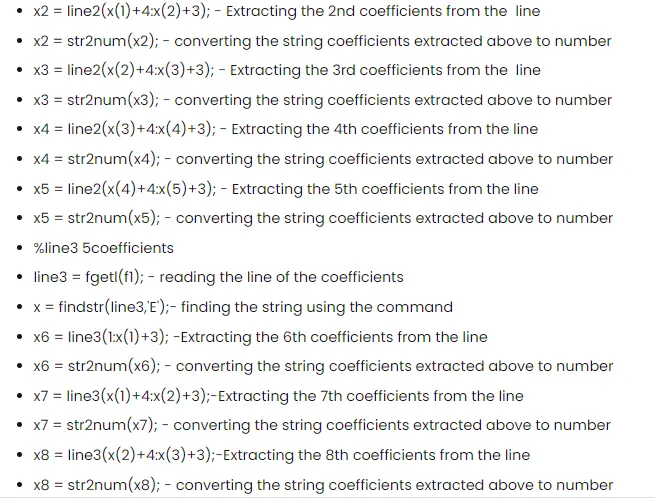
EXPLANATIONS FOR COMMANDS USED IN BELOW PROGRAM:
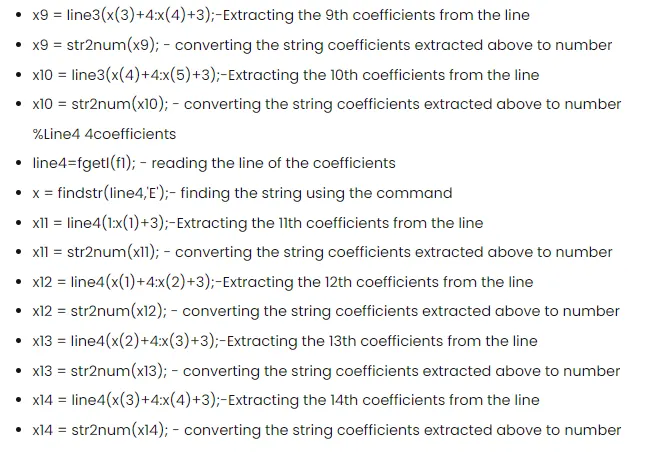
PROGRAM SOLVED USING MATLAB SOFTWARE
Program 1: ENTHALPY
function H =Enthalpy(a1,a2,a3,a4,a5,a8,a9,a10,a11,a12,a13,T,R,midtemp)
%  STEP-2(CALCULATION COMMANDS DEFINED IN PROGRAM)
% calculating Enthalpy for higher and lower temp resp
if(T>=midtemp)
    H=R*((a1*T)+((a2*(T).^2)/2)+((a3*(T).^3)/3)+((a4*(T).^4)/4)+((a5*(T).^5)/5)+a6);
else
    H=R*((a8*T)+((a9*(T).^2)/2)+((a10*(T).^3)/3)+((a11*(T).^4)/4)+((a12*(T).^5)/5)+a13);
end
end
Program 2: ENTROPY
function S =Entropy(a1,a2,a3,a4,a5,a8,a9,a10,a11,a12,a14,T,R,midtemp)
%  STEP-2(CALCULATION COMMANDS DEFINED IN PROGRAM)
% calculating Entropy for higher and lower temp resp
if(T>=midtemp)
    S=R*(a1.*log(T)+(a2*T)+((a3*(T).^2)/2)+((a4*(T).^3)/3)+((a5*(T).^4)/5)+a7);
else
    S=R*(a8.*log(T)+(a9*T)+((a10*(T).^2)/2)+((a11*(T).^3)/3)+((a12*(T).^4)/4));
end
end
Program 3: Speific Heat
function cp =specific_heat(a1,a2,a3,a4,a5,a8,a9,a10,a11,a12,T,R,midtemp)
%  STEP-2(CALCULATION COMMANDS DEFINED IN PROGRAM)
% calculating specific heat for higher and lower temp resp
if(T>=midtemp)
    cp=R*(a1+(a2*T)+(a3*(T).^2)+(a4*(T).^3)+(a5*(T).^4));
else
     cp=R*(a8+(a9*T)+(a10*(T).^2)+(a11*(T).^3)+(a12*(T).^4));
end
end
Program 4: Molecular Weight
function W=molecular_weight(species)
% STEP-2(CALCULATION COMMANDS DEFINED IN PROGRAM)
atoms=['H','C','N','O','Ar'];
atomic_weight=[1.008 12.011 15.999 14.007 39.948];
W =0;
for i=1:length(species)
    for j=1:length(atoms)
        if strcmp(species(i),atoms(j))
            W=W+atomic_weight(j);
            position=j;
        end
    end
    n=str2num(species);
    if n>1
        W=W+atomic_weight(position)*(n-1);
    end
end
fprintf('Moecular Weight of %s :-',species);
fprintf('%f',W);
disp(' ');
end
Program 4: Main Program
clear all
close all
clc

% STEP-1(INPUTS DEFINED IN PROGRAM)
% R=molar gas constant
R=8.314;

% Syntax to open the file THERMO.dat
f1=fopen('THERMO.dat','r');

% To read lines
l1=fgetl(f1);
l2=fgetl(f1);
value=strsplit(l2,' ');

% To get temp from file in number format
lowtemp=str2num(value{2});
midtemp=str2num(value{3});
hightemp=str2num(value{4});

% Temperature range
T=linspace(lowtemp,hightemp,1000);

% Skipping these 3 lines
l3=fgetl(f1);
l4=fgetl(f1);
l5=fgetl(f1);

% STEP-2(CALCULATION COMMANDS DEFINED IN PROGRAM)
% Reading species, calculating cp,H,S and plotting
for i=1:53
    tline=fgetl(f1);
    A=strsplit(tline,' ');
    species=(A{1});
    lowtemp=str2num(A{end-3});
    midtemp=str2num(A{end-2});
    hightemp=str2num(A{end-1});

    tline1=fgetl(f1);
    a=findstr(tline1,'E');

    a1=tline1(1:a(1)+3);
    a1=str2num(a1);
    a2=tline1(a(1)+4:a(2)+3);
    a2=str2num(a2);
    a3=tline1(a(2)+4:a(3)+3);
    a3=str2num(a3);
    a4=tline1(a(3)+4:a(4)+3);
    a4=str2num(a4);
    a5=tline1(a(4)+4:a(5)+3);
    a5=str2num(a5);

    tline2=fgetl(f1);
    a=findstr(tline2,'E');

    a6=tline2(1:a(1)+3);
    a6=str2num(a6);
    a7=tline2(a(1)+4:a(2)+3);
    a7=str2num(a7);
    a8=tline2(a(2)+4:a(3)+3);
    a8=str2num(a8);
    a9=tline2(a(3)+4:a(4)+3);
    a9=str2num(a9);
    a10=tline2(a(4)+4:a(5)+3);
    a10=str2num(a10);

    tline3=fgetl(f1);
    a=findstr(tline3,'E');

    a11=tline3(1:a(1)+3);
    a11=str2num(a11);
    a12=tline3(a(1)+4:a(2)+3);
    a12=str2num(a12);
    a13=tline3(a(2)+4:a(3)+3);
    a13=str2num(a13);
    a14=tline3(a(3)+4:a(4)+3);
    a14=str2num(a14);

%     Calculating cp,H,S
    cp =specific_heat(a1,a2,a3,a4,a5,a8,a9,a10,a11,a12,T,R,midtemp);
    H =Enthalpy(a1,a2,a3,a4,a5,a8,a9,a10,a11,a12,a13,T,R,midtemp);
    S =Entropy(a1,a2,a3,a4,a5,a8,a9,a10,a11,a12,a14,T,R,midtemp);

    W=molecular_weight(species);
    MW_file=fopen('Molecular Weight.txt','W');
    fprintf(MW_file,'Molecular weight of %s is %d',species,W);
    fclose(MW_file);

    cd('D:\matlab\NASA_FILES')
    mkdir(species);
    warning('off', 'MATLAB:MKDIR:DirectoryExists');
    cd(species);

%     STEP-3(PLOTING COMMANDS FOR DIFFERENT GRAPH IN PROGRAM)

%     Plotting T vs cp
    figure(1)
    plot(T,cp,'linewidth',5,'color','r')
    xlabel('Temperature(K)')
    ylabel('Specific heat(KJ)')
    grid on
    title(sprintf('Specific heat VS Temperature range of %s',species));
    saveas(figure(1),'specific heat.jpg');

  %     Plotting T vs H
    figure(2)
    plot(T,H,'linewidth',5,'color','b')
    xlabel('Temperature(K)')
    ylabel('Enthalpy(KJ/mol)')
    grid on
    title(sprintf('Enthalpy VS Temperature range of %s',species));
    saveas(figure(2),'Enthalpy.jpg');

    %     Plotting T vs S
    figure(3)
    plot(T,S,'linewidth',5,'color','g')
    xlabel('Temperature(K)')
    ylabel('Entropy(KJ/mol-K)')
    grid on
    title(sprintf('Enthalpy VS Temperature range of %s',species));
    saveas(figure(3),'Entropy.jpg');

    cd('D:\matlab\NASA_FILES')

end
EXPLANATION OF CODE
STEP-1(INPUTS DEFINED IN PROGRAM)
- Program 5:
- R=molar gas constant.
- Syntax to open the file THERMO.dat.
STEP-2(CALCULATION COMMANDS DEFINED IN PROGRAM)
- Program 5:
- Calculating cp,H,S by calling the functions.
- Program 1,2,3,4:
- Initiating the Calculations of cp,H,S by using functions.
STEP-3(PLOTING COMMANDS FOR DIFFERENT GRAPH IN PROGRAM)
- Program 5:
- plot commands used for plotting.
- xlabel,ylabel,title commands are used for better understanding of graph.
ERRORS FACED WHILE PROGRAMMING
- No Errors were found while programming
- Screenshot attached for reference.
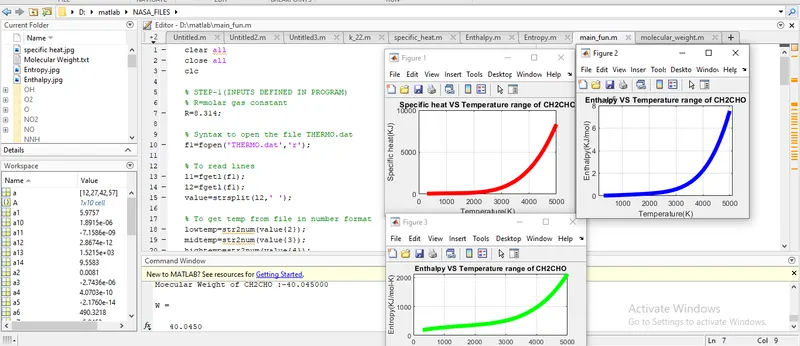
OUTPUT & RESULTS WITH CONCLUSION:
QUESTION NO :2-[Calculate the molecular weight of each species and display it in the command window]
QUESTION NO :4-[Save the plots as images with appropriate names and dump them in separate folders. Screenshot of the window where all the folders are saved]
QUESTION NO :5-[The main program that you will submit will just take the "THERMO.dat" file as an input and generate Cp, H and S plots.Attach Plots for o2, N2 and Co2 species]
O2:
N2:
CO2:
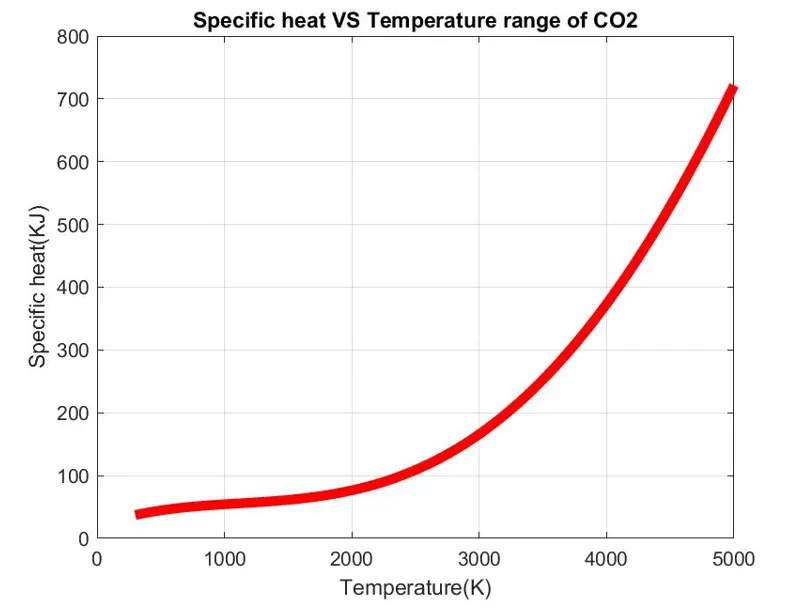
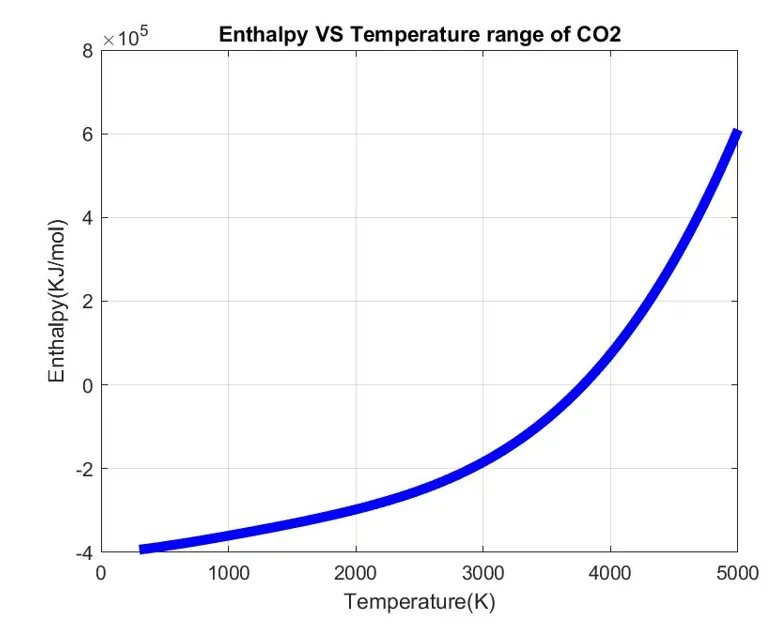
REFERENCES
https://in.mathworks.com/matlabcentral/answers/341599-create-folder-and-keep-files
https://in.mathworks.com/matlabcentral/answers/196582-best-way-to-parse-text-file