Project 1 - Parsing NASA thermodynamic data
Aim: To write a program using Matlab programming for parsing the NASA thermodynamic data file and then after calculating the thermodynamic properties of various gas species.
Objective:
Write a function to extract the 14 coefficients and calculates the enthalpy, entropy, and specific heats for all the species (53) in the NASA thermodynamic data file which is provided to us as "Thermo.dat".
The mentioned NASA polynomials have this form as shown below;

Here, R is the universal gas constant.
T is the temperature
Cp = Specific heat (KJ)
S = Entrophy(KJ/ mol-K)
H = Enthalpy (KJ/mol)
and a(i) are the respective coefficients, where i = (1 - 14)
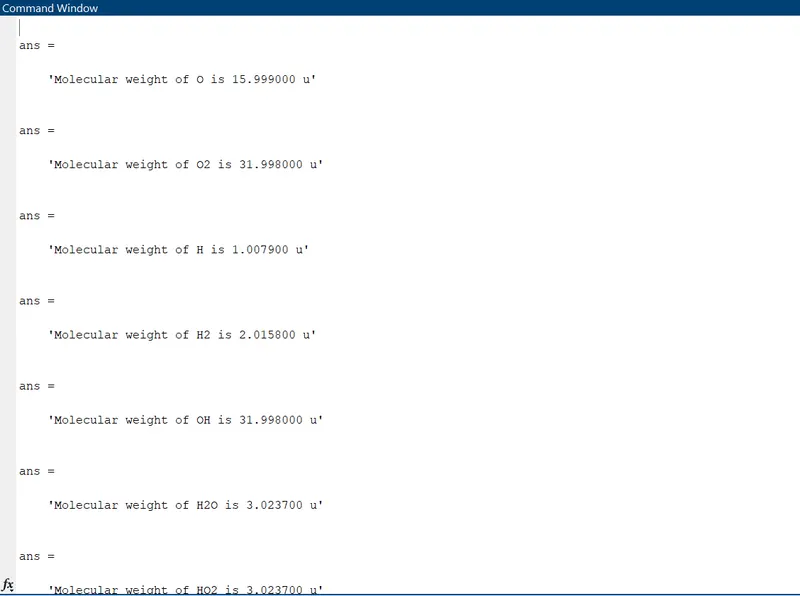
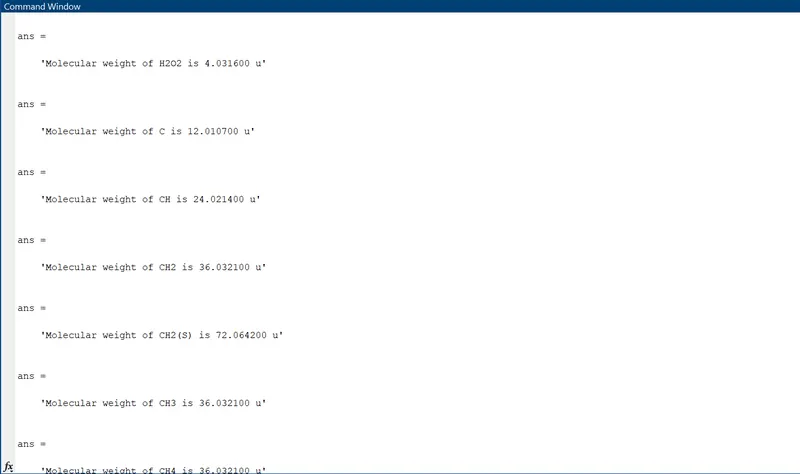
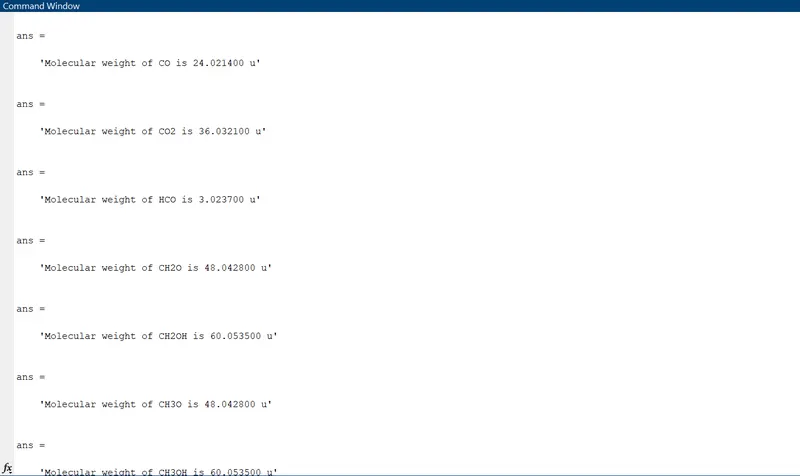
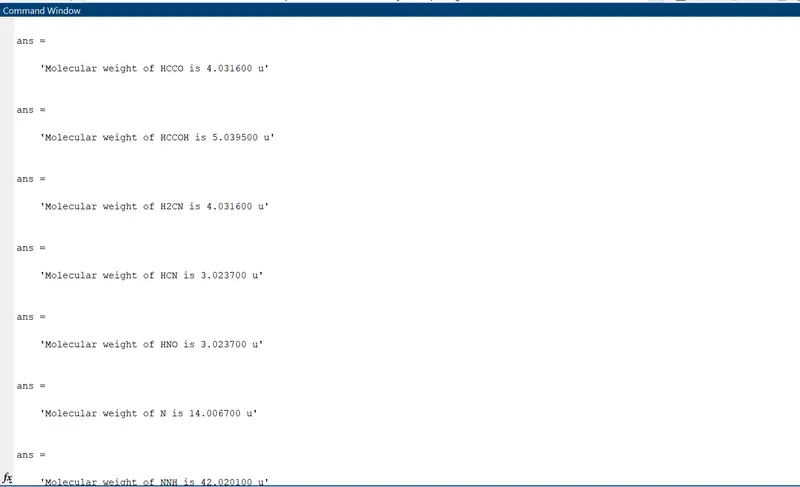
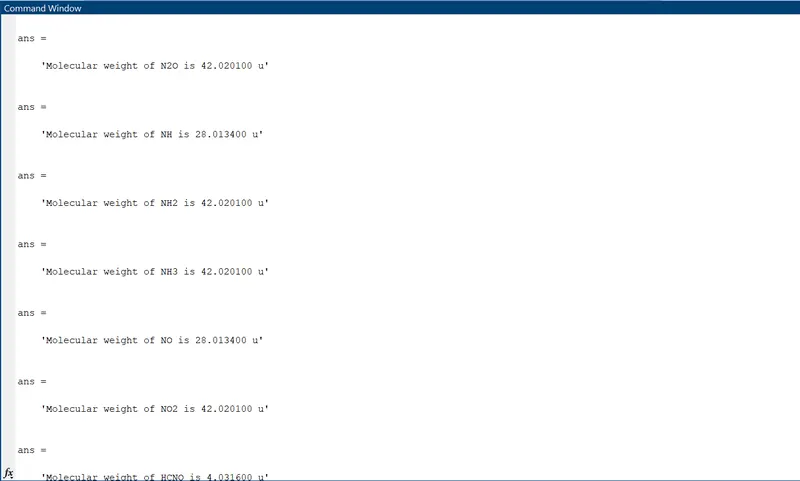
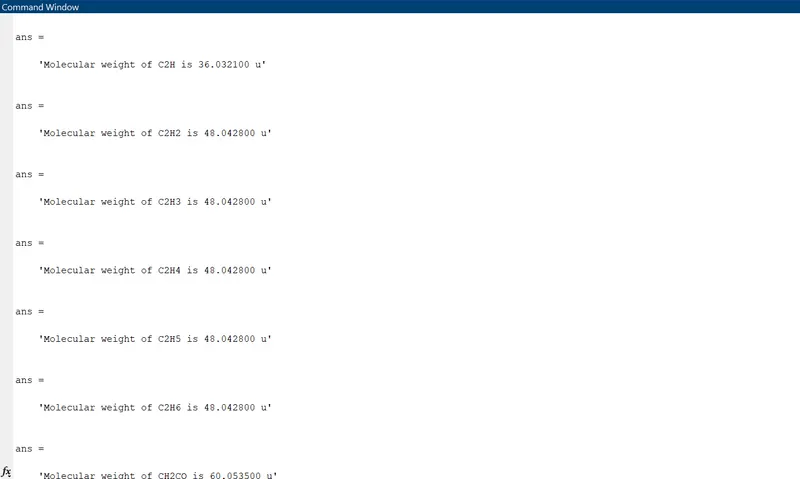
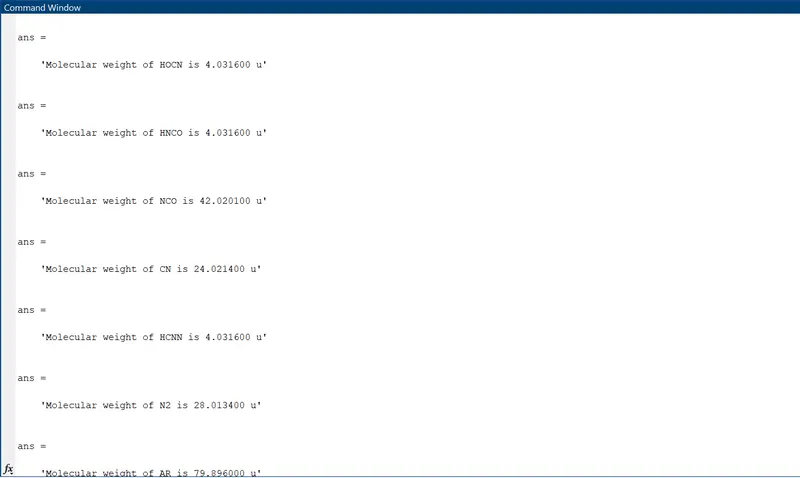
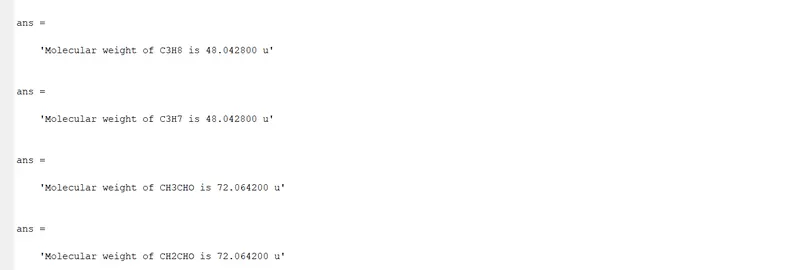
We Need to calculate the molecular weight of each species and display it in the command window.
To plot the Cp, Enthalpy, and Entropy for the local temperature range ( that is low temperature: High temperature)specific for each individual species.
Saving the plots as images with appropriate names and sorting them in separate folders which should be arranged for each species with suitable names automatically.
Writing a detailed report of explanation.
These are the objectives we need to follow and should be done in an organized way.
FILE PARSING; (the definition)
It refers to how one can read data from external files or external databases and include or use that information in our calculations. In other words, the ability to read a file and take particular data from it and storing or code useful information is very crucial and is known as File parsing.
Here, we are going to define the function and create an input parser, and set properties to adjust the parsing and use that inputs in the function.
File parsing can be used in two modes, that is file writing and file reading. Both are used according to our conditions.
GIVEN NASA THERMODYNAMIC FILE;
The given Thermodynamic file is a data file that contains 14 coefficients for 53 different element species given by NASA. These coefficients are utilized to calculate the sepcific heat, enthalpy and entropy for a particular element. Each element had its own range of local temperatures.
THE INDIVIDUAL ELEMENT SPECIES PRESENT IN "Thermo.dat" FILE:
AR C C2H C2H2 C2H3 C2H4 C2H5 C2H6 C3H7 C3H8
CH CH2 CH2(S) CH2CHO CH2CO CH20 CH2OH CH3 CH3CHO
CH3O CH3OH CH4 CN C0 CO2 H H2 H2CN H2O H2O2 HCCO
CCOH HCN HCNN HCNO HCO HNCO HNO HO2 HOCN N
N2 N20 NCO NH NH2 NH3 NNH NO NO2 O O2 OH
These are the respected species that are mentioned in the data file.
Enthalpy, Entrophy and Specific heat;
Enthalpy, Entrophy, Specific heat of various species at different temperatures are required extensively to analyze the thermodynamic process. This is similar in some other process like nozzle flow, refrigeration etc..where thses quantities are widely involved to observe the phenomenon.
Here, NASA came with certain polynomials which can be used to evaluate thermodynamic properties such as Cp, H, and S. They documented the coefficients which are further required to evaluate these polynomials for numerious species.
The polynomials form form NASA in displayed in the objective session. So, in that
R = Universal Gas Constant
T = Temperature
and the coefficients mentioned in the thermodynamic file are a1, a2, a3, a4, a5, a6, and a7. The first 7 coefficients are High-temperature coefficients (which exceeds 1000K) and the second 7 coefficients are Low-temperature coefficients ( which are below 1000K).
Specific heat:
It is the amount of energy that must be added, in the form of heat, to one unit of mass of the substance in order to cause an increase of one unit in its temperature.
Cp = (a1+(a2*T)+a3*(T).^2+a4*(T).^3+a5*(T).^4)*R
Entrophy:
It is the measure of the systems thermal energy per unit temperature that is unavailable for doing useful work. Although work is obtained from ordered molecular motion, the amount of entropy is also a measure of the molecular disorder, or randomness of a system.
S = (a1.*log(T)+(a2*T)+((a3*(T).^2/2)+((a4*(T).^3)/3)+((a5*(T).^4)/4)+a7)*R
Enthalphy:
It is a property of the thermodynamic system, is equal to the systems internal energy and the product of its pressure and volume. In a system contained so as to prevent mass transfer, for processes at constant pressure, the heat absorbed or released equals the change in enthalpy.
H = R*T.*(a1+((a2*T)/2)+((a3*(T).^2)/3)+((a4*(T).^3)/4)+((a5*(T).^4)/5)+(a6./T))
Main code:
clear all
close all
clc

f1 = fopen('THERMO.dat','r');  % Opening the file for reading
fgetl(f1);                     % Reading the comment lines
fgetl(f1);
fgetl(f1);
fgetl(f1);
fgetl(f1);

%extracting all species data

for i = 1:53

%extracting the name of species

A = fgetl(f1);                       %reading sixth line
z = strsplit(A,' ');                  %reading the species name
species_name = z{1};          %Finding out the species name

%extracting the local temperature of species

a = findstr(A,'E');               %finding string from the line
t1 = z{end-3};
t1 = str2num(t1);
t2 = z{end-2};
t2 = str2num(t2);
t3 = z{end-1};
t3 = str2num(t3);

%t1 = low remperature
%t2 = mid temperature
%t3 = high temperature

%extracting coefficients of species

B = fgetl(f1);
b = findstr(B,'E');
a1 = B(1:b(1)+3);
a1 = str2num(a1);
a2 = B(b(1)+4:b(2)+3);
a2 = str2num(a2);
a3 = B(b(2)+4:b(3)+3);
a3 = str2num(a3);
a4 = B(b(3)+4:b(4)+3);
a4 = str2num(a4);
a5 = B(b(4)+4:b(5)+3);
a5 = str2num(a5);
C= fgetl(f1);
c = findstr(C,'E');
a6 = C(1:c(1)+3);
a6 = str2num(a6);
a7 = C(c(1)+4:c(2)+3);
a7 = str2num(a7);
a8 = C(c(2)+4:c(3)+3);
a8 = str2num(a8);
a9 = C(c(3)+4:c(4)+3);
a9 = str2num(a9);
a10 = C(c(4)+4:c(5)+3);
a10 = str2num(a10);
D = fgetl(f1);
d = findstr(D,'E');
a11 = D(1:d(1)+3);
a11 = str2num(a11);
a12 = D(d(1)+4:d(2)+3);
a12= str2num(a12);
a13 = D(d(2)+4:d(3)+3);
a13 = str2num(a13);
a14 = D(d(3)+4:d(4)+3);
a14 = str2num(a14);

%first 7 are high temperature coefficients from a1 to a7
%second 7 are low temperature coefficients from a8 to a14

%creating the range of low and high values of local temperatures

T = linspace(t1,t3,1000);
R = 8.314;                   %universal gas constant

%calculation for specific heat, enthalpy and entrophy


for i = 1:length(T)

    if T(i)>t2
        Cp(i) = (a1 + a2.*T(i) + a3.*T(i).^2 + a4.*T(i).^3 + a5.*T(i).^4)*R;
        H(i) = (a1 + (a2.*T(i))/2 + (a3.*T(i)^2)/3 + (a4.*T(i).^3)/4 + (a5.*T(i).^4)/5 + (a6./T(i)))*R.*T(i);
        S(i) = a1.*log(T(i)) + a2.*T(i) + (a3.*T(i)^2)/2 + (a4.*T(i)^3)/3 + (a5.*T(i).^4)/4 + a7;
    else
        Cp(i) = (a8 + a9.*T(i) + a10.*T(i).^2 + a11.*T(i).^3 + a12*T(i).^4)*R;
        H(i) = (a8 + (a9.*T(i))/2 + (a10.*T(i).^2)/3 + (a11.*T(i).^3)/4 + (a12.*T(i).^4)/5 + (a13./T(i)))*R.*T(i);
        S(i) = a8.*log(T(i)) + a9.*T(i) + (a10.*T(i)^2)/2 + (a11.*T(i)^3)/3 + (a12.*T(i).^4)/4 + a14;
    end
end


%Molecular weights calculation

elements = ['H','C','O','N','A','S'];                               %Declaring species elements
atomic_weight = [1.0079 12.0107 15.999 14.0067 39.948 32.065];      %mentioning its atomic weights
mol_mass = 0;                                                      %declaring molecular weight '0' in intial stage

for l = 1:length(species_name)
    for m = 1:length(atomic_weight)
        if strcmp(species_name(1),elements(m))
            mol_mass = mol_mass + atomic_weight(m);
            position = m;
        end
    end
    n = str2double(species_name(1));
    if n>1
        mol_mass = mol_mass + atomic_weight(position)*(n-1);
    end
end

%printing the molecular weight of the species in the command window

sprintf('Molecular weight of %s is %f u',species_name,mol_mass)


%Creating a folder to save the plots
mkdir(species_name)         %creating a new folder with species name in main folder
cd(species_name)     %changing the directory to folder of species name

%plotting specific heat vs Temperature

figure(1)
plot(T,Cp, 'color','b','linewidth',2)
xlabel('Temperature (K)')
ylabel('SPecific heat (J/K Kg)')
title({'Specific heat vs Temperature',['Species_name = ',species_name,' & Molecular weight = ',num2str(mol_mass)]});
saveas(figure(1),'Cp vs Temp.png')

% Plotting Enthalpy vs Temperature

figure(2)
plot(T,H, 'color','r','linewidth',2)
xlabel('Temperature(K)')
ylabel('Enthalpy (J/K)')
title({'Enthalpy vs Temperature',['Species name = ',species_name,' & Molecular weight = ',num2str(mol_mass)]});
saveas(figure(2),'Enthalpy vs Temp.png')

% Plotting entropy vs Temperature

figure(3)
plot(T,S,'color','g','linewidth',2)
xlabel('Temperature (K)')
ylabel('Entropy (J/K)')
title({'Entropy vs Temperature',['Species name = ',species_name,' & Molecular weight = ',num2str(mol_mass)]});
saveas(figure(3),'Entropy vs Temp.png')
cd ..
%To change the current directory to the main folder

%oldfolder = cd('parsing_nasa_file');

end
Explanation of Code ;
The program begins with the usual commands clear all, close all and clc which can be used to free up the command window and workspace.
We will then read the data from the external NASA thermodynamci data file using fopen command which is used to open the file and fgetl command which is used to readbthe content in the file line by line.
After using the fopen command we will be assigning to the variable called f1. Thus the fgetl(f1) acts as a successor line reader. While we go on use this command, will can able to read the remaining further lines.
Now, we are going to read the first five lines which are basically comments of the THERMO.dat file. Then after we can create a loop for all the total species and extract thre coefficients.
The name of the species are found by using the fstrsplit command and for finding out the species we need to locate the string , which is present in after all the species.Then after we are finding the species name as mentioning the spiece as z{1}.
Then after we need to extract the local temperatures by mentioning their point locations of low temp, mid temp and high temp.
t1, t2, t3 are the variables assigned for the local temperatures respectively. But we need to change the values which we got from string to number by using str2num command.
Now, its time to extract the coefficients for the species in which the coefficient's locations are from the 6th line (after the comments section) . We extract the coefficients locations like similarly we have extracted the local temperatures.
By using the findstr and str2num commands, we extract every coefficient of each particular spiece. It is mentioned that a1 to a7 are high temperature coefficients and a8 to a14 are low temperature coefficients.
For extracting, we need to find or locate the string 'E' position, which is present in each co-efficient and so it is repeated for all the values in the same line and we need to proceed same for the remaining lines by heading the next line with some variable name.
Temperature range values from low temp to high temp is assigned using the linspace command.
Here, the for loop command is used to calculate the values of specific heat, enthalpy and entropy and if-else command is also used to find out the required values if the temperature below the mid temperature or above it.
Now, we need to calculate the molecular weight of the species. We declare the species elements in the form of cell array. Thier atomic mass is declared in the form of array. Then intially molecular weight is declared as '0'.
Here onwards, for loop command is used to detect if there are more than one species in the variable species_name and the respective values of the gas species values are then calculated and found.
After the nested for loop the species_name which is already in form of string is converted as number with strdouble command. Then the species_name which is greater than one, molecular weight is again calculated by having the atomic mass for the current species
The value of the molecular weight is calculated for the respective gas species and is displayed in the command window.
Now, we need to create plots for the specific heat, enthalpy, and entropy values and save it in the respective folder automatically.
For creating a new folder with a species_name we are going to use the mkdir command so that a new folder is created in the main folder. Now we need to change the current directory from the main folder to the species_name folder so the cd command is used to do the same.
To save the plots in the species_name folder, saveas command is used to save them in thier respective folder.After which to change the current directory to the main folder the oldfolder = cd() command is used. Although we can change it manually by changing their path. So we can even use this method by converting the old folder command into a comment section, which can be used later based on our use.
By this steps, we can parse the data from the given NASA data file.
Molecular weights of the species ; (command window view)
starting from O - CH2CHO (53 species)
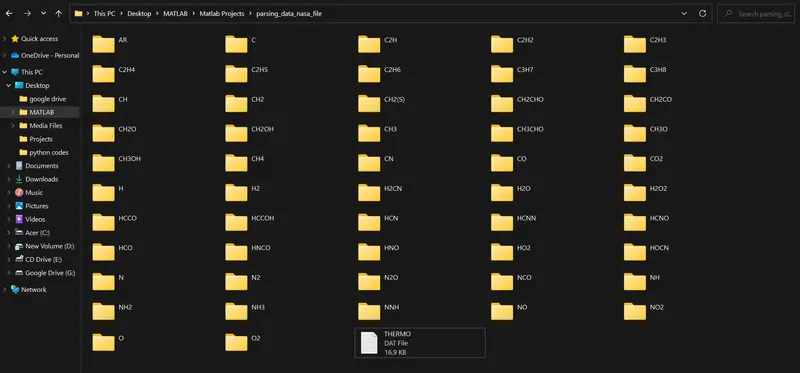
Main folder containing all the species;
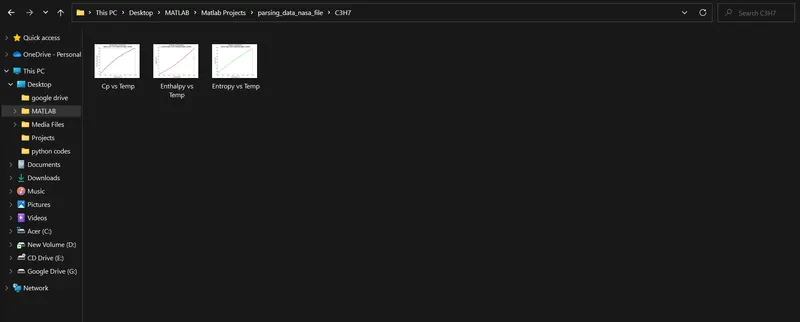
Plots inside the folder; (Cp, H, S)
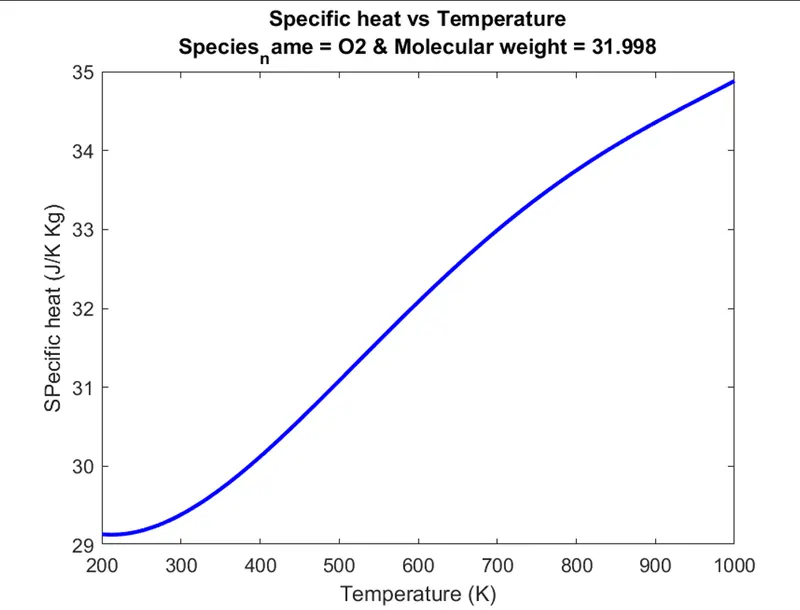
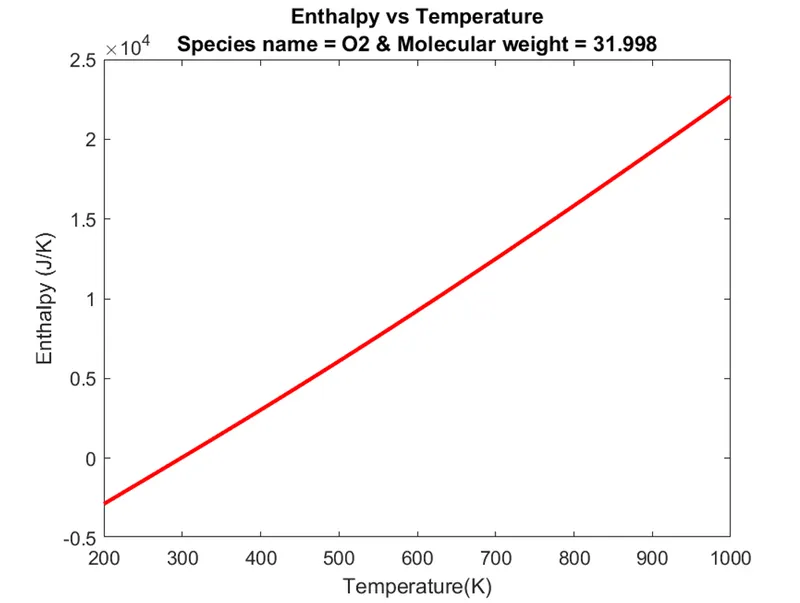
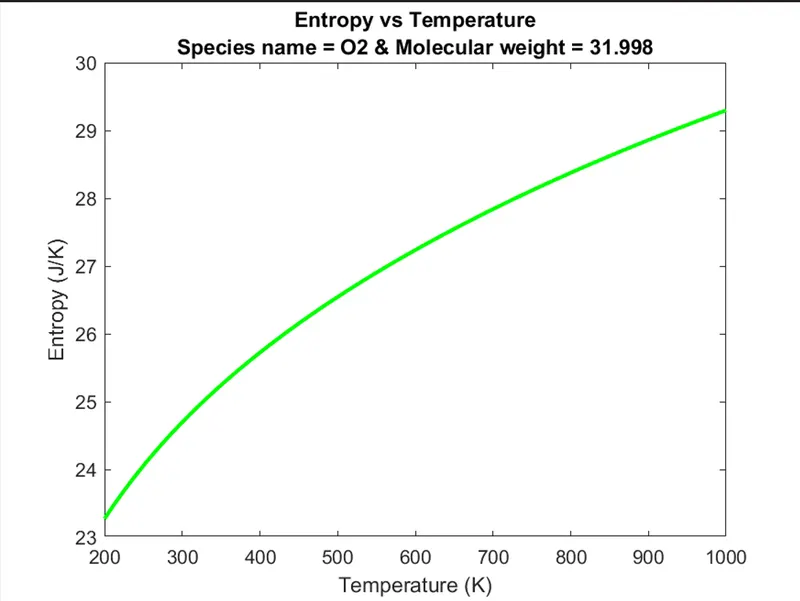
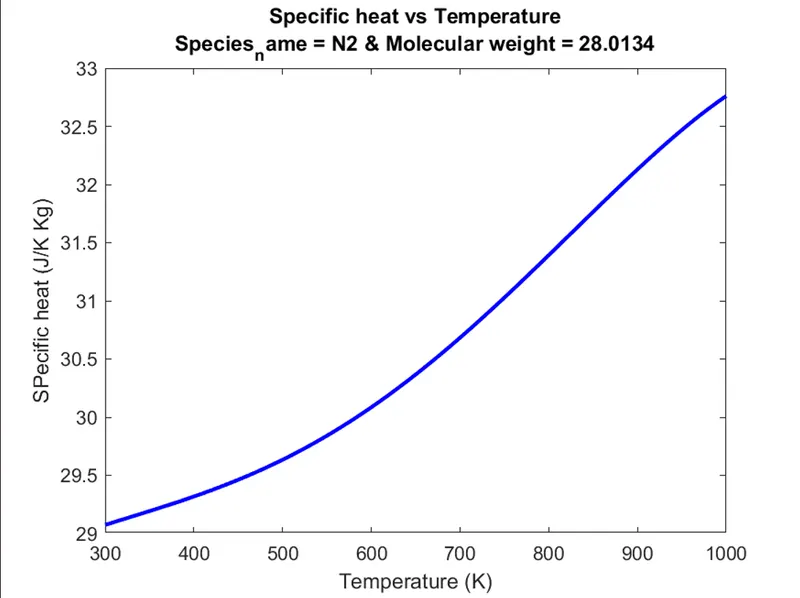
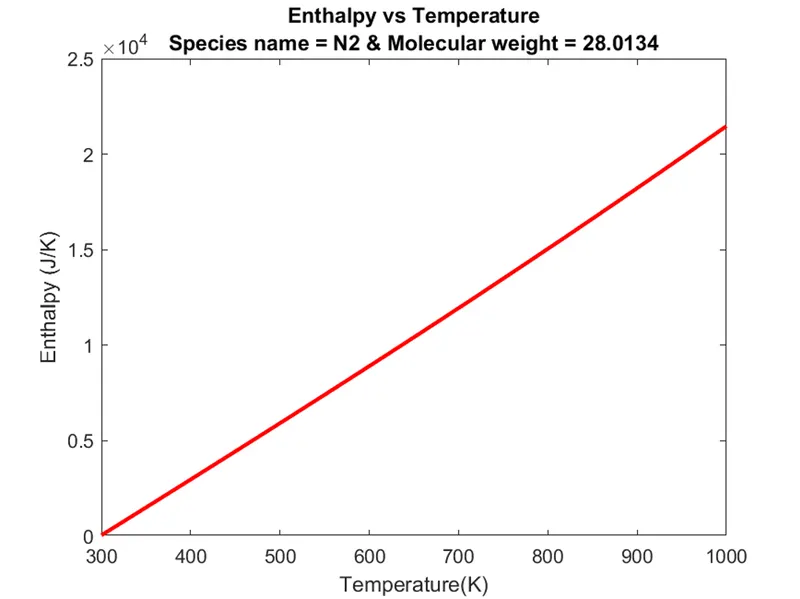
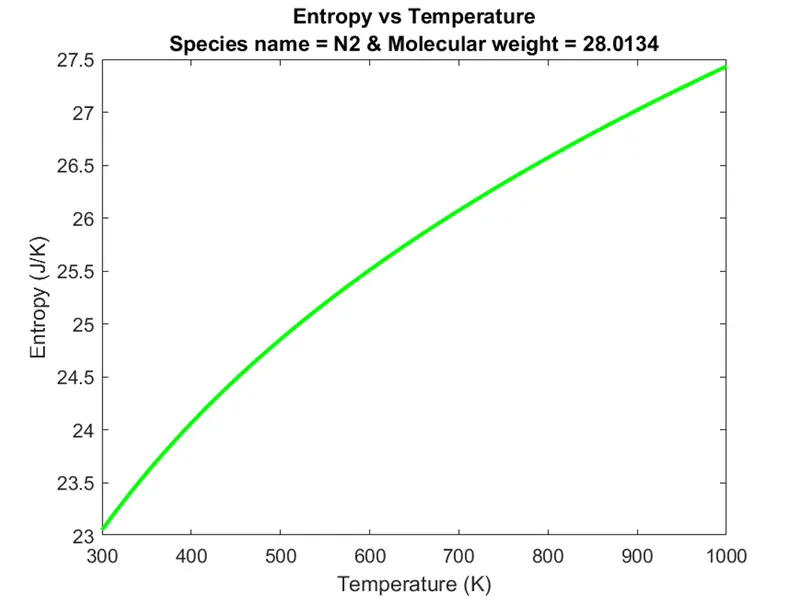
Plots for 02, N2, and CO2;
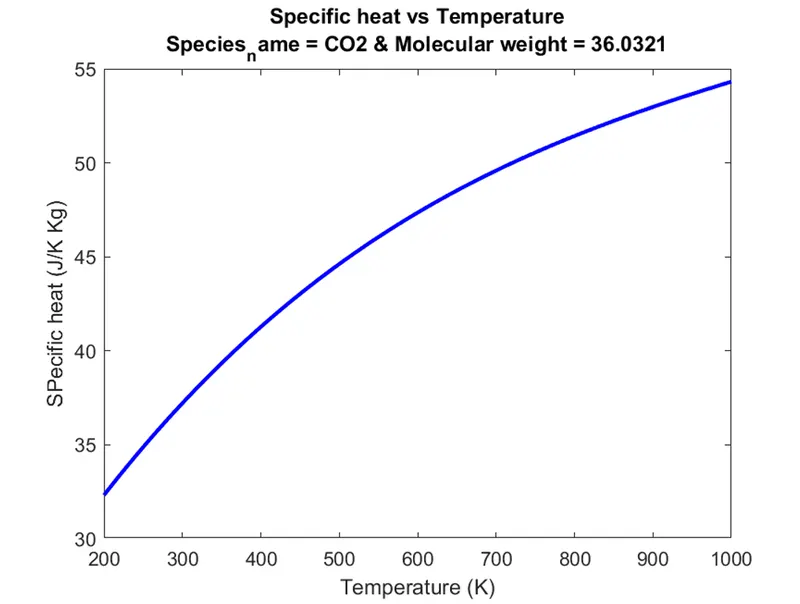
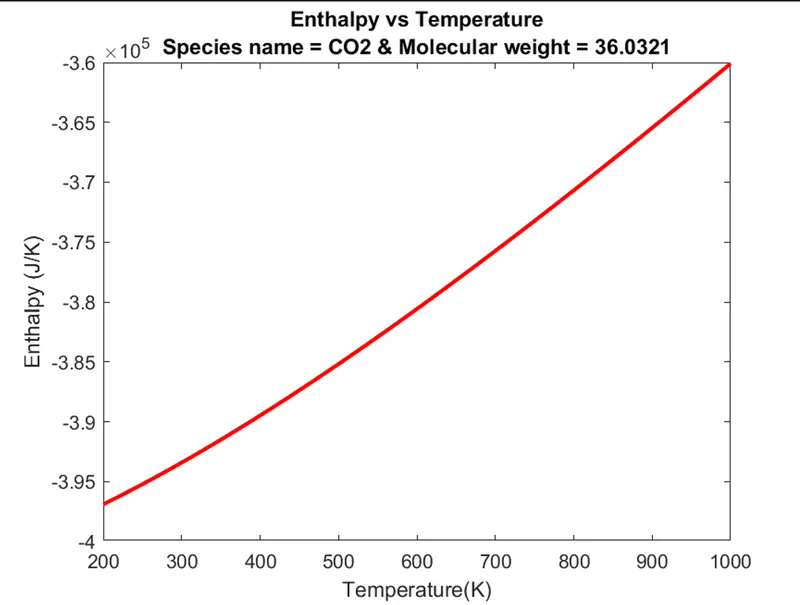
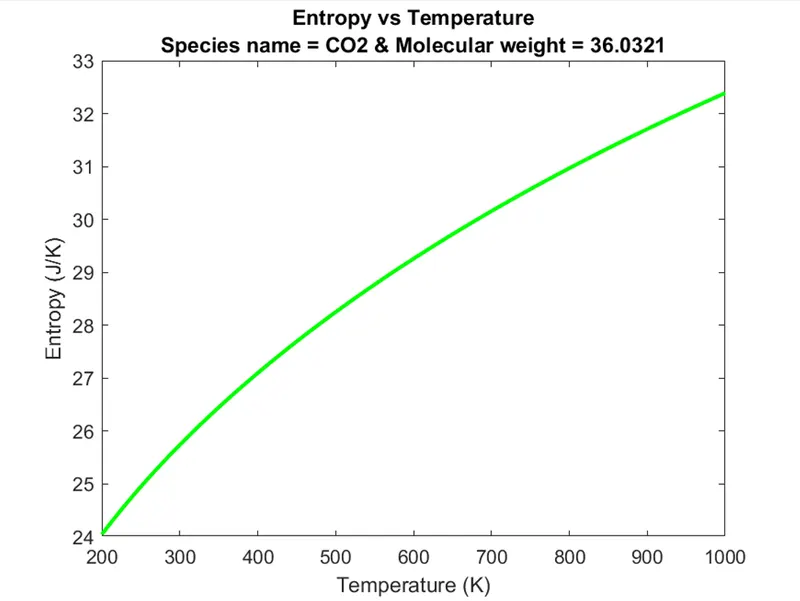
(SPecific heat, Entropy and Enthalpy) vs (Temperature);
O2 PLOTS;
N2 PLOTS;
CO2 PLOTS;
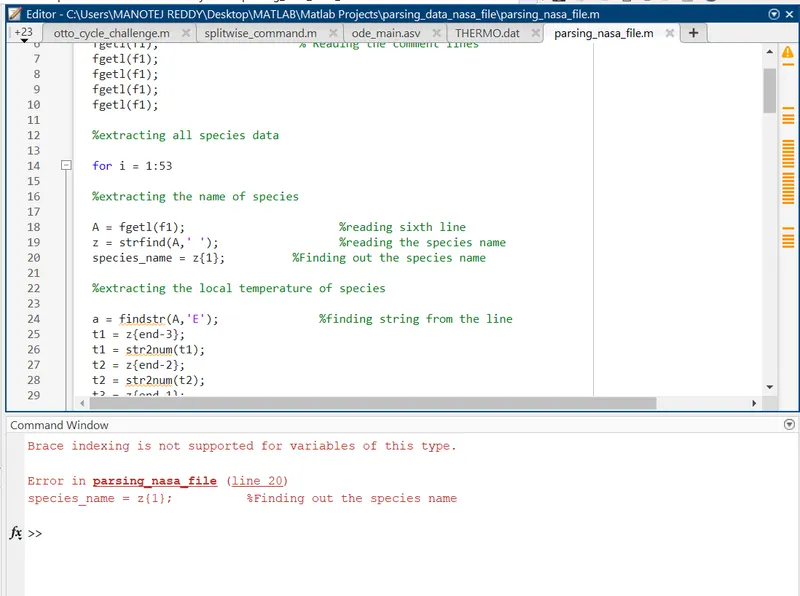
ERRORS OCCURED WHILE PARSING;
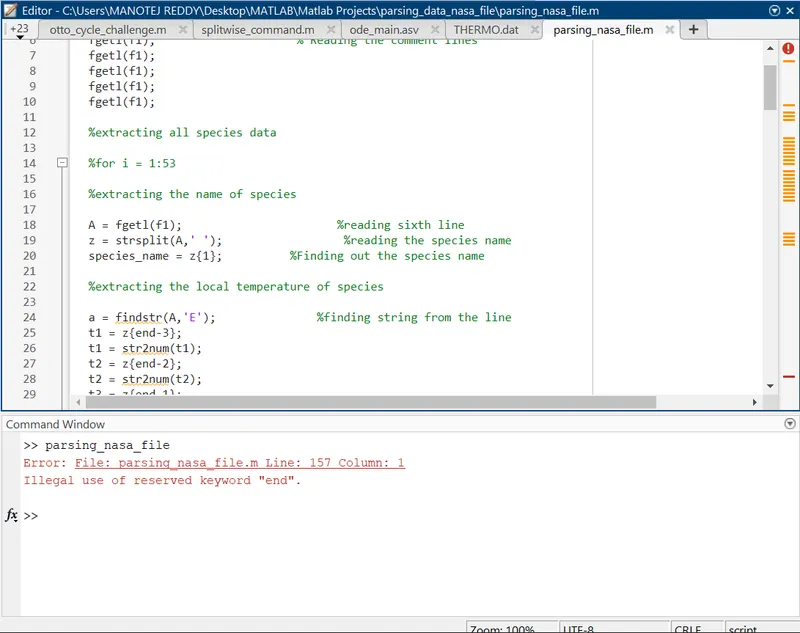
I have unnoticedly kept % for main for loop and when i execute it displayed as illegal use of end. then I removed that comment and executed and the issue got resolved.
2) I have used strfind command instead of strsplit command in reading the species name. Then is used strsplit command and the program got executed.
CONCLUSION:
Hence, we have successfully parsed the given NASA thermodynamic data file and mentioned all the molecular weights of species along with Graphs plotted for SPecific heat (Cp), Enthalpy (H) and Entropy (S). We have also dispalyed all the molecular weights from the command window and the plots of mentioned species.
References;