Project 1 - Parsing NASA thermodynamic data
AIM:
- Write a function that extracts the 14 co-efficients and calculates the enthalpy, entropy and specific heats for all the species in the data file.
- Calculate the molecular weight of each species and display it in the command window.
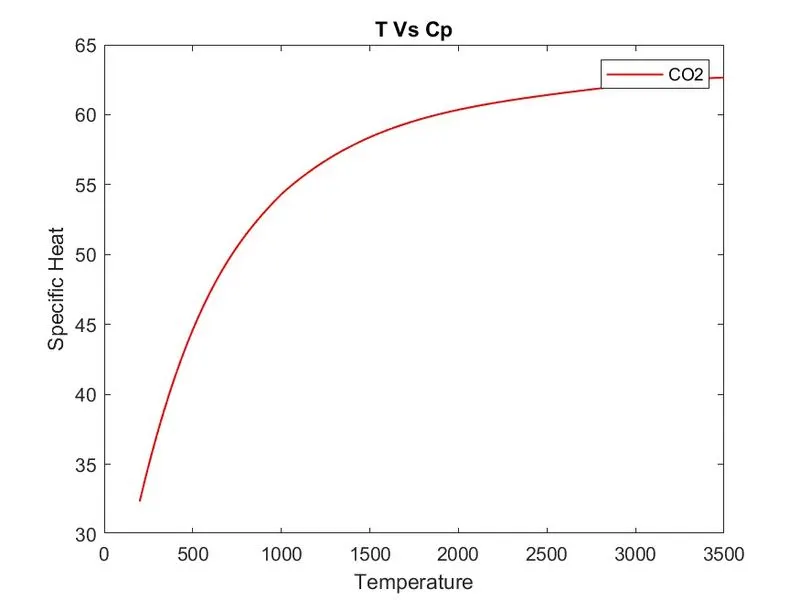
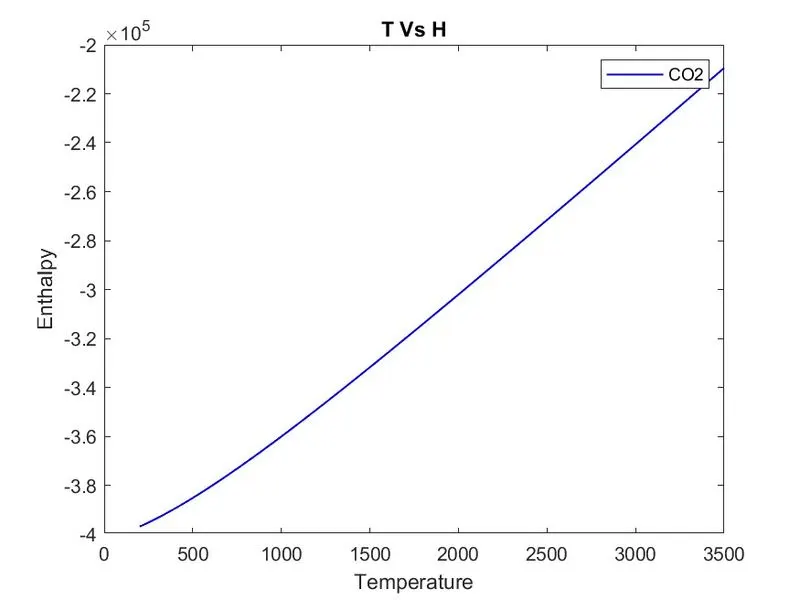
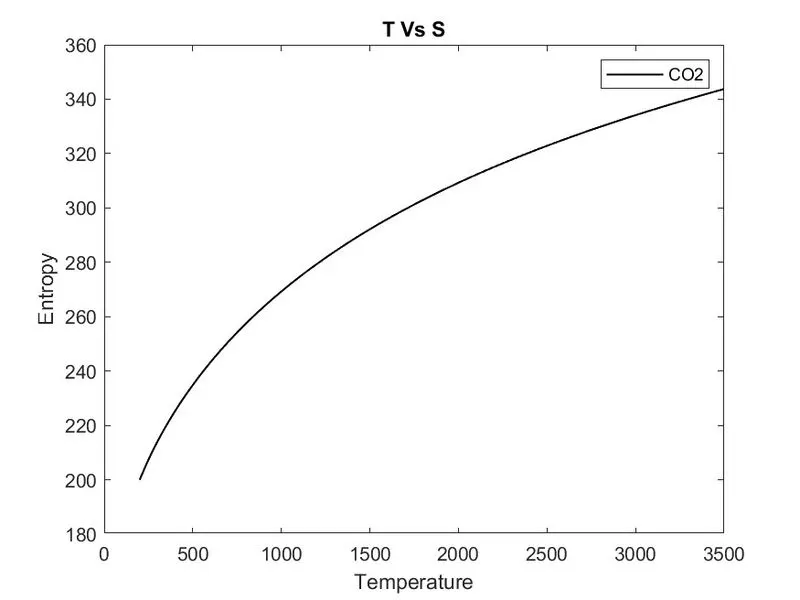
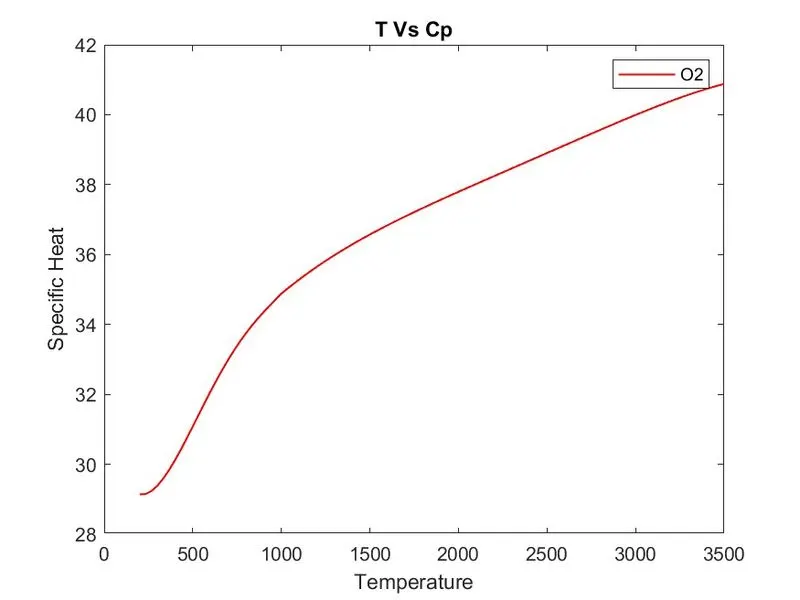
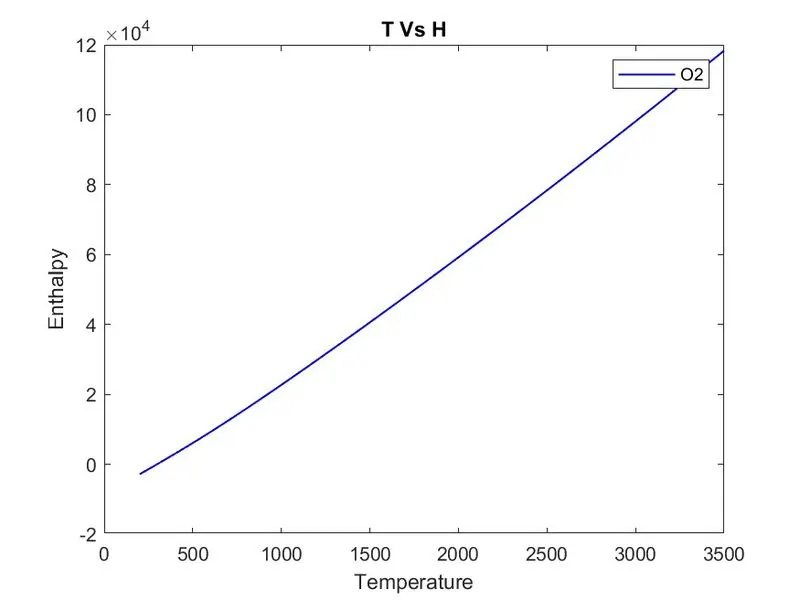
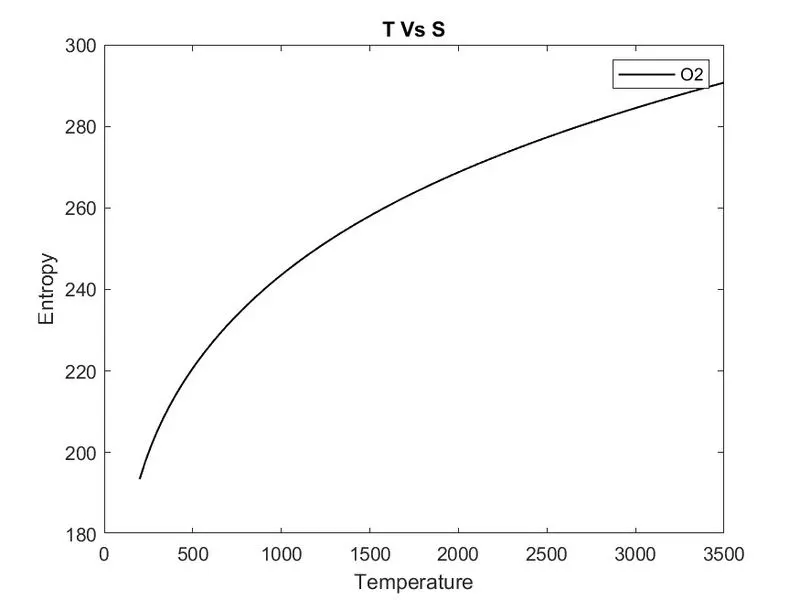
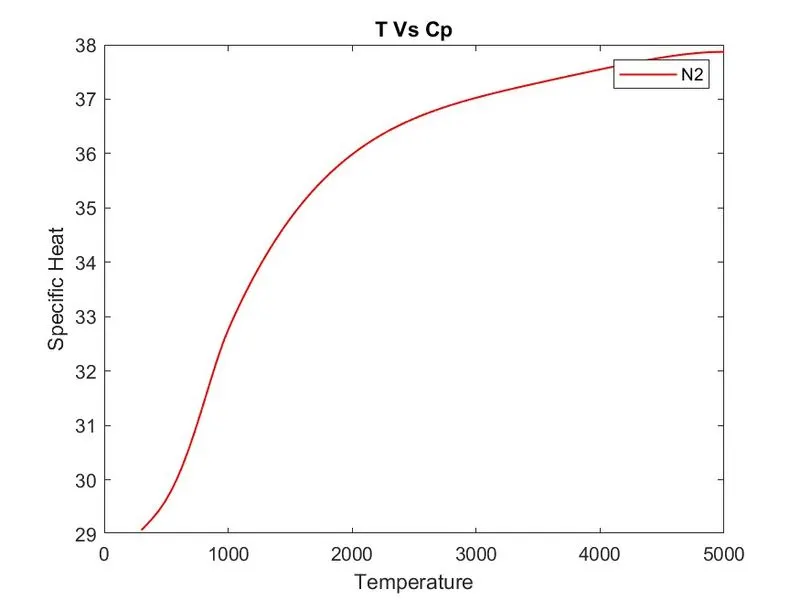
- Plot the Cp, Enthalpy and Entropy for the local temperature range (low temperature : high temperature) specific for each species.
- Save the plots as images with appropriate names and dump them in separate folders for each species with suitable name. All these should be generated automatically.
THEORY:
File parsing: It is the process to extract the relevant or meaning full section or data from the raw data of file.
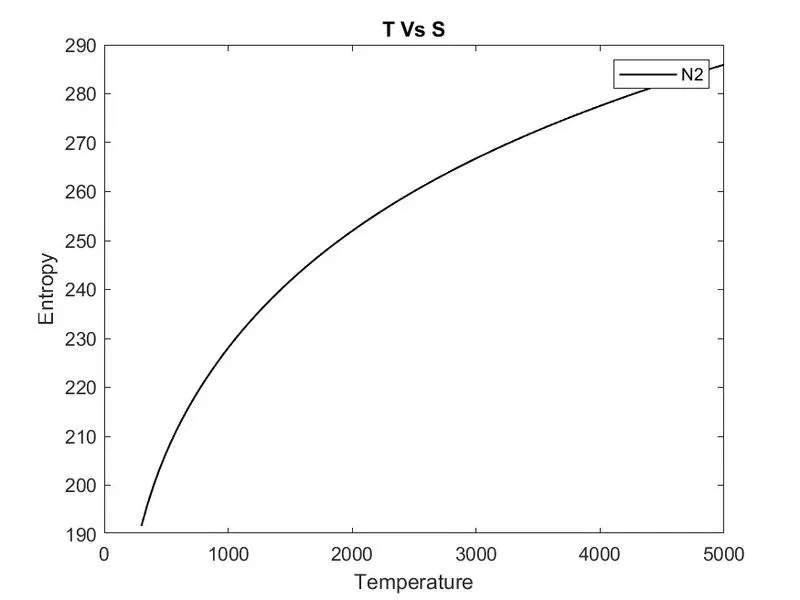
Entropy: Entropy is a thermodynamic property like pressure, temperature and volume. The degree of randomness or disorder in the system is called entropy. According to second law of thermodynamic entropy of system always increase with time. Measure of the system’s thermal energy per unit temperature that is not available for doing useful work. It is represented by symbol ‘S’ and SI unit is Joule per kilogram ‘J/kg’.
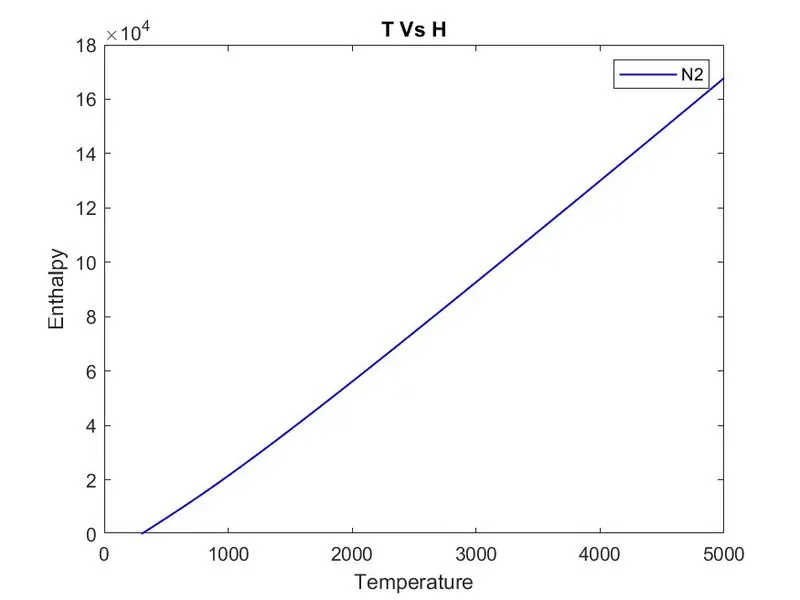
Enthalpy: Enthalpy is a thermodynamic property, is equal to the sum of system’s internal energy and product of its pressure and volume. It is a total heat content of a system. It is denoted by ‘H’. SI unit of enthalpy is Joule ‘J’.
Specific heat: Amount of heat required to change the temperature of the unit mass of an object to one degree is called specific heat. It is denoted by ‘Cp’ and SI unit is Joule per kg per Kelvin ‘J/kg-K’.
ALL COMMANDS USED OF THIS PROJECTS:
- fid= fopen (‘filename’, ’permission’): Open the file with filename and file access permission. By default, read as a permission.
- fline=fgetl (fid): To read the file line by line.
- str=strsplit (fline): Separate the string or character at specified delimiter. By default, space is as delimiter.
- linspace (X1,X2,N): Create a row array between X1 and X2 of N numbers of evenly spaced points.
- t1=str2double (str): Convert the string and character array into numeric array of double precision values.
- mkdir (‘foldername’, ’filename’): Create a folder with folder name.
- sprintf (format,An): to formate the data into to string or character vector.
- plot (X, Y,’LineWidth’,1,’color’,’r’): Create 2D plot.
- saveas (fig, filename, formattype): To save a figure fig, with filename and specified figure format type.
- fullfile (foldername, filename): To get a character vector containing the full path to the file.
- Fclose (fid): To close the opened file.
FUNCTION CODES:
1. Write a function for Calculating Specific heat, Enthalpy and Entropy for each species
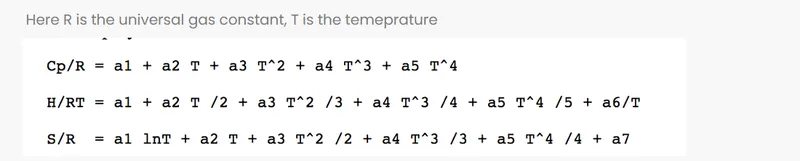
To create a function of Cp, H and S from the below formulae with following coditions:
1. The FIRST 7 coefficients are HIGH-temperature coefficients and the SECOND 7 coefficients are LOW-temperature coefficients.
2. Also use the LOCAL TEMPERATURE RANGES which is unique for each individual species, not the GLOBAL TEMPERATURE RANGE.
Code:
function [Cp,H,S]=NASA_func(a1,a2,a3,a4,a5,a6,a7,a8,a9,a10,a11,a12,a13,a14,R,T,tL,tM,tH)

T=linspace(tL,tH,100);

for i=1:length(T)
if T(i)>tM
    Cp(i)=( a1 + a2*T(i) + a3*(T(i).^2) + a4*(T(i).^3) + a5*(T(i).^4))*R;
    H(i)=(a1 + a2*(T(i)/2) + a3*(T(i).^2/3) + a4*(T(i).^3/4) + a5*(T(i).^4/5) + a6./T(i))*R.*T(i);
    S(i)=(a1*log(T(i)) + a2*T(i) + a3*(T(i).^2)/2 + a4*(T(i).^3)/3 + a5*(T(i).^4)/4 + a7)*R;
else
    Cp(i)=( a8 + a9.*T(i) + a10.*(T(i).^2) + a11.*(T(i).^3) + a12.*(T(i).^4))*R;
    H(i)=(a8 + a9*(T(i)/2) + a10*(T(i).^2/3) + a11*(T(i).^3/4) + a12*(T(i).^4/5) + a13./T(i))*R.*T(i);
    S(i)=(a8*log(T(i)) + a9*T(i) + a10*(T(i).^2)/2 + a11*(T(i).^3)/3 + a12*(T(i).^4)/4 + a14)*R;
end
end
2.Write a function For calculation of molecular weight of each species.
To calculate the molecular weight of specie:
- First create an array of atoms which are present in each species.
- Then create another array of atomic mass of their atoms at same position as same as first array.
- Now create two for loop to compare each atom of species names with atoms of A variable (first array) to get the position of matched atom of A variable.
- And then put the position of array into second array to get atomic mass to matched atom and then add the atomic mass of the atom to MM variable to get molecular weight of species.
- Now create a variable ‘p’ which is the position of last matched atom of the atoms array.
- And now convert the character array of species to numeric value to get the number atom of the specie. If the atom of the species is more than one then adds the atomic mass of that atom to MM with the help of p variable to get the final molecular weight of species.
Code:
function [MM]=calculation_of_MM(species_name)

A=['H','C','N','O','A'];  % Create an array of atoms
M=[1,12,14,16,40];        % Create an array of atomic weight of the first array of atoms at same position

MM=0;                     % fix Value of MM before loop
for i=1:length(species_name)
    for j=1:length(A)
        if strcmp(species_name(i),A(j))   % Compare atoms species with atoms of variable A
            MM=MM+M(j);                   % take the position of matches atom and put the postion to second array to get atomic mass of the matched atom.
            p=j;                          % create a position of last match atom as a variable
        end
    end
    n=str2num(species_name(i));           % Convert the character array to numeric value.
    if n>1
        MM=MM+M(p)*(n-1);                 % if value of n is greater than n then add the atomic mass of the lastmatched atom to MM
    end
end
MM;                     % Get final value of MM after the loop
end
Main code:
clear all
close all
clc

f1=fopen("THERMO.dat","r");  % Open the data file in read format

% 1. Extract name of each species, their temperatures and all coefficients.

%  Skip the first 5 lines because of not required
% creating a loop for skip the 5 lines
for i=1:5
    fgetl(f1);
end

for i=1:53  % create a loop for getting results to each species

L1=fgetl(f1); % Load the required first line from the data file

% 1.a> To extract the species name from the L1 line
s_details=strsplit(L1);   % divide the string to easily extract required part by cell no.
species_name=s_details{1}; % extract the specie name from s_details in scaler

% 1.b> To extract the local temperatures of the specie
tL=str2double(s_details{end-3});  %first extract load low temperature in string from cell array then change it into scaler
tM=str2double(s_details{end-1});  % Repeat same to get local medium and high temperature.
tH=str2double(s_details{end-2});

% 1.c> To extract all 14 coefficient of species
L2=fgetl(f1);   % load the first line of cofficient as L2 variable

% seperate the all 5 coefficient from L2 variable
p=strfind(L2,'E');
% extract the each coefficient and then convert to string into numeric array
a1=str2double(L2(1:p(1)+3));
a2=str2double(L2(p(1)+4:p(2)+3));
a3=str2double(L2(p(2)+4:p(3)+3));
a4=str2double(L2(p(3)+4:p(4)+3));
a5=str2double(L2(p(4)+4:p(5)+3));

L3=fgetl(f1);

p=strfind(L3,'E');

a6=str2double(L3(1:p(1)+3));
a7=str2double(L3(p(1)+4:p(2)+3));
a8=str2double(L3(p(2)+4:p(3)+3));
a9=str2double(L3(p(3)+4:p(4)+3));
a10=str2double(L3(p(4)+4:p(5)+3));

L4=fgetl(f1);

p=strfind(L3,'E');

a11=str2double(L4(1:p(1)+3));
a12=str2double(L4(p(1)+4:p(2)+3));
a13=str2double(L4(p(2)+4:p(3)+3));
a14=str2double(L4(p(3)+4:p(4)+3));

% 1.d> Calculate the Specific Heat, Entropy and Enthalpy of each species
R=8.314;
T=linspace(tL,tH,100);

% get the function to calculate the Specific Heat, Entropy and Enthalpy of each species
[Cp,H,S]=NASA_func(a1,a2,a3,a4,a5,a6,a7,a8,a9,a10,a11,a12,a13,a14,R,T,tL,tM,tH);

% 2> Calculating the Molecular weight of each species

[MM]=calculation_of_MM(species_name);  % Get the function for Molecular weight of each species
% display the species molecular wt. in command window of each species with specie name
sprintf('%s %s %s %4.2f','The molecular wt. of',species_name,'is',MM)

% Create a folder in the name of each species
mkdir('NASA_file',species_name);

% 3.a> Creating figure of Specific Heat, Entropy and Enthalpy with temperature range of each species
% Plot figure of Cp and T of each species
figure(1)
plot(T,Cp,'LineWidth',1,'color','r')
xlabel('Temperature')
ylabel('Specific Heat')
legend(species_name)
title('T Vs Cp')

% Plot figure of H and T of each species
figure(2)
plot(T,H,'LineWidth',1,'color','b')
xlabel('Temperature')
ylabel('Enthalpy')
legend(species_name)
title('T Vs H')

% Plot figure of S and T of each species
figure(3)
plot(T,S,'LineWidth',1,'color','k')
xlabel('Temperature')
ylabel('Entropy')
legend(species_name)
title('T Vs S')

% 3.b> Save the all figures in their species named folder with specific name
fpath=(['C:\Users\rosha\Documents\MATLAB\NASA_file\',species_name]);

saveas(1,fullfile(fpath,'Cp'),'jpg')
saveas(2,fullfile(fpath,'H'),'jpg')
saveas(3,fullfile(fpath,'S'),'jpg')

end
fclose(f1)
PROCEDURE:
- First open the data file ‘thermo.dat’ in matlab as read by using fopen command.
- Skip the first five line of the data which is not required for our parsing by creating a for loop of fgetl command at 5 iterations.
- Now create a for loop of next four line to extract each species name, its temperatures and all 14 coefficients till last specie.
- To get the species names and its temperatures, first read the sixth line of the file by using fgetl command then separate the line with ‘space’ delimiter by using strsplit command.
- Now extract the specie name and temperature by simply put the cell number of the array and convert cell arrays into character by using ‘{}’. To get numeric scalar for local temperature from character or string by str2double command.
- To extract the first five coefficient from the next line, get the line by using fgetl and then use strfind command to separate the 5 coefficients with the help of pattern ‘E’ in command and then convert the character array to numeric by using str2double command.
- Repeat the 6th process to extract the rest 9 coefficients.
- To calculate the Specific Heat 'Cp', Entropy 'S' and Enthalpy 'H' of each species, put the value of Universal gas coefficient (R) and Temperature range (T) between local low (tL) and high temperature (tH) and get the function ‘NASA_func’ further calculation.Here to get Temperature range (T) between tL and tH of 100 evenly spaced by using linspace command.
- For calculation of molecular weigth of ecah species, get the function of calculation of molecular weigth.
- To display the molecular weigth of each species by using sprintf command.
- Create a folder for each species by using mkdir command.
- Now create figures of Specific Heat, Entropy and Enthalpy of each species with temperature range by using plot command with using label, title and legend.
- To save the created figures to at the create folder with figure name by using saveas and fullfile
- Now close the file by using fclose command.
RESULTS:
1. Screenshot of the window where all the folders are saved.

2. Plots for o2, N2 and Co2 species
2. a) Plot of O2.
2. b) Plot of N2.
2. c) Plot of CO2