Project 1 - Parsing NASA thermodynamic data
AIM :
To write a function that extracts the 14 co-efficients and calculates the enthalpy, entropy and specific heats for all the species in the data file.
Here there is the term parsing it is specically defined for the files. Lets understand its definition.
File Parsing :
File Parsing means reading in a data stream and further it can be used in programming or representation of the semantic content of that data, in order to facilitate performing some kind of transformation on the data.
Now lets understand a bit about thermodynamic properties.
Specific Heat (cp) :
Specific Heat is defined as the amount of heat required to raise the temperature of 1 kg of a substance by 1 kelvin.
Enthalpy (H) :
It is property of a thermodynamic system defined as the sum of the system's internal energy & the product of its pressure & volume.
Entropy (s) :
It is the measure of a system thermal energy per unit temperature that is unavailable for doing useful work. Because work is obtained from ordered molecular motion, the entropy amount is also the measure of molecular disorder or randomness of the system.
Now lets proceed for the programming.
Matlab Coding :
%Programming to parse Nasa's Thermodynamic Data

clear all
close all
clc

%Opening & reading the given file

file = fopen('THERMO.dat','r');

%Assigning heading to the line

line1 = fgetl(file)

%Global temperature values

line2 = fgetl(file)

%Next three lines are comments

%Assigning the next line to des_1
des_1 = fgetl(file);

%Assigning the next line to des_2
des_2 = fgetl(file);

%Assigning the next line to des_3
des_3 = fgetl(file);

%Assigning the global temperatures

%Splitting the line2 using the space character as an delimiter
A = strsplit(line2,' ');

%Assigning the global low temperature from array A as a number
global_low_temp = str2num(A{2});

%Assigning the global mid temperature from array A as a number
global_mid_temp = str2num(A{3});

%Assigning the global high temperature from array A as a number
global_high_temp = str2num(A{4});

%Species Information

%Running a for loop for every molecule
for i = 1:53

%Assigning the first line of molecular data from the file to species
species = fgetl(file)

%Assigning the name to the species from the first 6 elements of the array of species
species_name = species(1:6)

%Local temperature values for each molecules

%Spliting the species using space character as an delimiter
B = strsplit(species,' ');

%Assigning the local low temperature from array B as a number
local_low_temperature = str2num(B{end-3});

%Assigning the local high temperature from array B as a number
local_high_temperature = str2num(B{end-2});

%Assigning the local mid temperature from array B as a number
local_mid_temperature = str2num(B{end-1});

%Assigning the second line to Line_1 from the molecule data file
Line_1 = fgetl(file);

%Finding the letter 'E' in Line_1 to differentiate the data
L1 = strfind(Line_1,'E');

%Assigning the high temperature co-efficients
c1 = str2num(Line_1(1:(L1(1)+3)));
c2 = str2num(Line_1((L1(1)+4):(L1(2)+3)));
c3 = str2num(Line_1((L1(2)+4):(L1(3)+3)));
c4 = str2num(Line_1((L1(3)+4):(L1(4)+3)));
c5 = str2num(Line_1((L1(4)+4):(L1(5)+3)));

%Assigning the third line to Line_2 from the molecule data file
Line_2 = fgetl(file);

%Finding the letter 'E' in Line_2 to differentiate the data
L2 = strfind(Line_2,'E');

%Assigning the High Temperature Co-efficients
c6 = str2num(Line_2(1:(L2(1)+3)));
c7 = str2num(Line_2((L2(1)+4):(L2(2)+3)));

%Assigning the Low Temperature Co-efficients
c8 = str2num(Line_2((L2(2)+4):(L2(3)+3)));
c9 = str2num(Line_2((L2(3)+4):(L2(4)+3)));
c10 = str2num(Line_2((L2(4)+4):(L2(5)+3)));


%Assigning the fourth line to Line_3 from the molecule data file
Line_3 = fgetl(file);

%Finding the letter 'E' in Line_3 to differentiate the data
L3 = strfind(Line_3,'E');

%Assigning the Low Temperature Co-efficients
c11 = str2num(Line_3(1:(L3(1)+3)));
c12 = str2num(Line_3((L3(1)+4):(L3(2)+3)));
c13 = str2num(Line_3((L3(2)+4):(L2(3)+3)));
c14 = str2num(Line_3((L3(3)+4):(L2(4)+3)));

%For the calculation purpose the temperature ranges are assumed
Temperature = linspace(local_low_temperature,local_high_temperature,100);

%Value for universal gas constant
R = 8.314;

%Based on lower & upper temperature calculation of Properties

%Running a for loop for every temperature values
for j = 1:length(Temperature)

%When the temperature is below the middle temperature

if Temperature(j)>=local_mid_temperature

cp = (c1+c2.*Temperature+c3.*(Temperature.^2)+c4.*(Temperature.^3)+c5.*(Temperature.^4)).*R;
H = (c1+c2.*(Temperature./2)+c3.*((Temperature.^2)./3)+c4.*((Temperature.^3)./4)+c5.*((Temperature.^4)./5)+c6./Temperature).*R.*Temperature;
S = (c1.*log(Temperature)+c2.*Temperature+c3.*((Temperature.^2)./2)+c4.*((Temperature.^3)./3)+c5.*((Temperature.^4)./4+c7)).*R;
else
    cp = (c8+c9.*Temperature+c10.*(Temperature.^2)+c11.*(Temperature.^3)+c12.*(Temperature.^4)).*R;
H = (c8+c9.*(Temperature./2)+c10.*((Temperature.^2)./3)+c11.*((Temperature.^3)./4)+c12.*((Temperature.^4)./5)+c13./Temperature).*R.*Temperature;
S = (c8.*log(Temperature)+c9.*Temperature+c10.*((Temperature.^2)./2)+c11.*((Temperature.^3)./3)+c12.*((Temperature.^4)./4+c14)).*R;

end
end

%Creating a character array of all constituents
Constituents = ['H', 'C', 'N', 'O', 'A']

%Creating an Array to store atomic weight of all constituents sequentially
Atomic_Weight = [1.00794 12.010 14.0067 15.9994 39.948]

%Initializing the MM Variable
MM = 0;

%Running a loop for each species
for i = 1:length(species_name)

%Running a for loop for each element of constituents array
for j = 1:length(Constituents)

%Comparing the ith char of species with jth char of constituents array
if strcmp(species_name(i),Constituents(j))

%By summation calculating the molar mass
MM = MM + Atomic_Weight(j);

%Assigning the j value in u variable
u = j;

end

end

%Calculating molecular mass when there is more than one atom is present of same type

%Converting the ith char of species to numner (if ith element is a latter then it returns as null matrix
n = str2num(species_name(i));

%When n is greater than 1 (i.e. more than one atom is present of same type)
if n>1

%Calculating molar mass by summation
MM = MM + Atomic_Weight(u)*(n-1);

end

end


fprintf('Molecular Weight of %s: ',species_name);
fprintf('%d',MM);
disp(' ');
molecular_list = fopen('molecular weight.txt','a+');
fprintf(molecular_list,'molecular weight of %s is %f \n',species_name,MM);
fclose(molecular_list);

cur_dir = pwd;
mkdir(species_name);
cd(species_name);


figure(1)
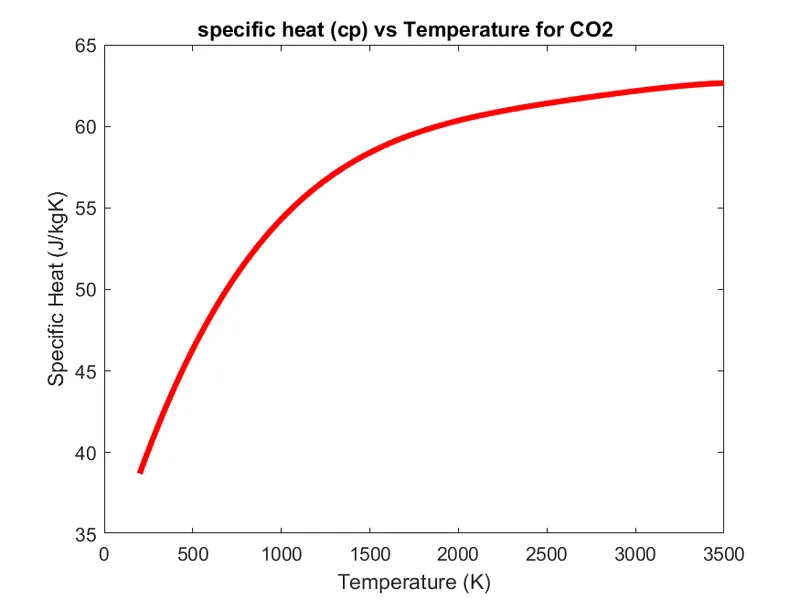
plot(Temperature,cp,'color','r','linewidth',3);
title(sprintf('specific heat (cp) vs Temperature for %s',species_name));
xlabel('Temperature (K)');
ylabel('Specific Heat (J/kgK)');
saveas(1,'specific heat.png');

figure(2)
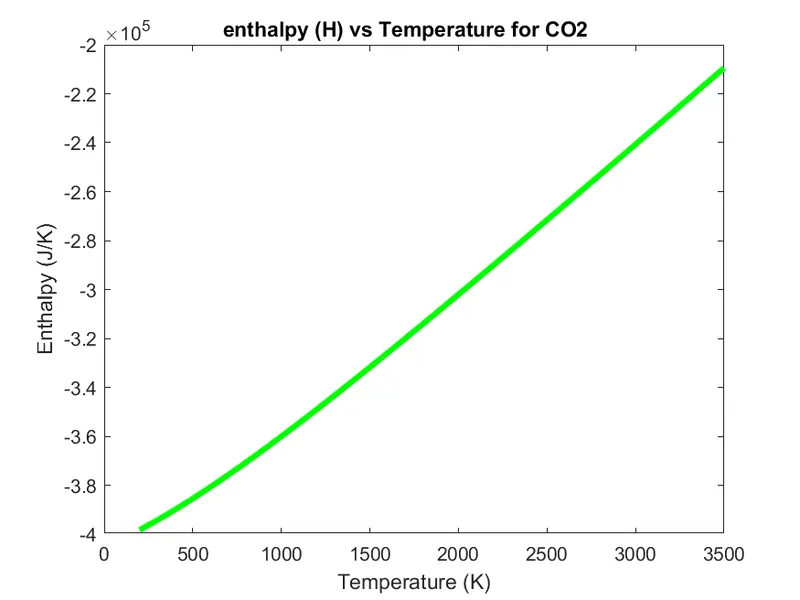
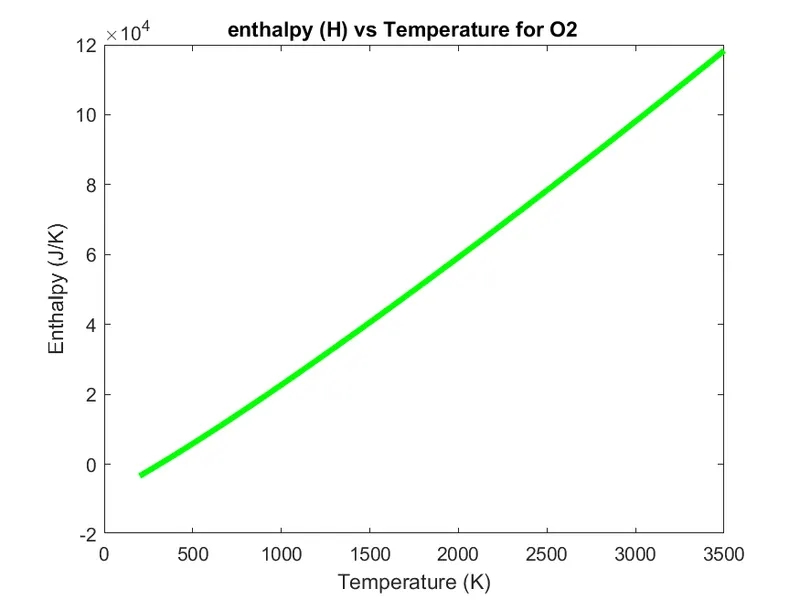
plot(Temperature,H,'color','g','linewidth',3);
title(sprintf('enthalpy (H) vs Temperature for %s',species_name));
xlabel('Temperature (K)');
ylabel('Enthalpy (J/K)');
saveas(2,'enthalpy.png');

figure(3)
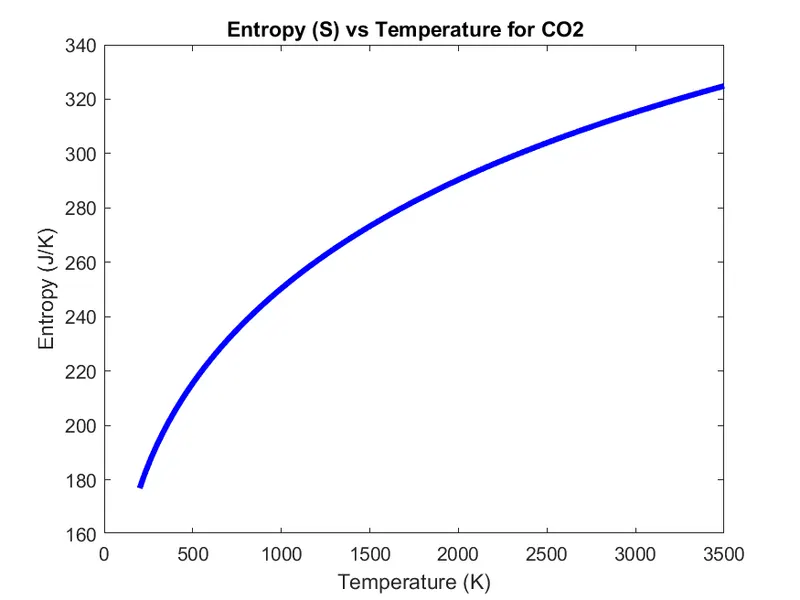
plot(Temperature,S,'color','b','linewidth',3);
title(sprintf('Entropy (S) vs Temperature for %s',species_name));
xlabel('Temperature (K)');
ylabel('Entropy (J/K)');
saveas(3,'Entropy.png');
cd(cur_dir);
end

fclose(file);
Program Explaination :
1) First of all we have opened THERMO.dat file to read.
2) In the next three lines with the help of command the file has been read for the heading & global temperatures
3) Ran a for loop for every species.
1. Got the species name.
2. Got the local temperatures & after their conversion into the number we have assigned them variables.
3. Got all the 14 co-efficients using strsplit().
4. Calculated the cp,H & S using the provided formula in the question for the two temperature range individually.
5. Plotted the graph T-S, T-H & T-cp & saved to the appropriate folder according to their species name.
6. Claculated Molecular Mass (MM).
4) Closed the file.
5) The Molecular Mass has been defined (Saved in the folder of which Screenshot is attached below).
Rest step by step description has already been given in the program.
Screenshot of the saved Folder :

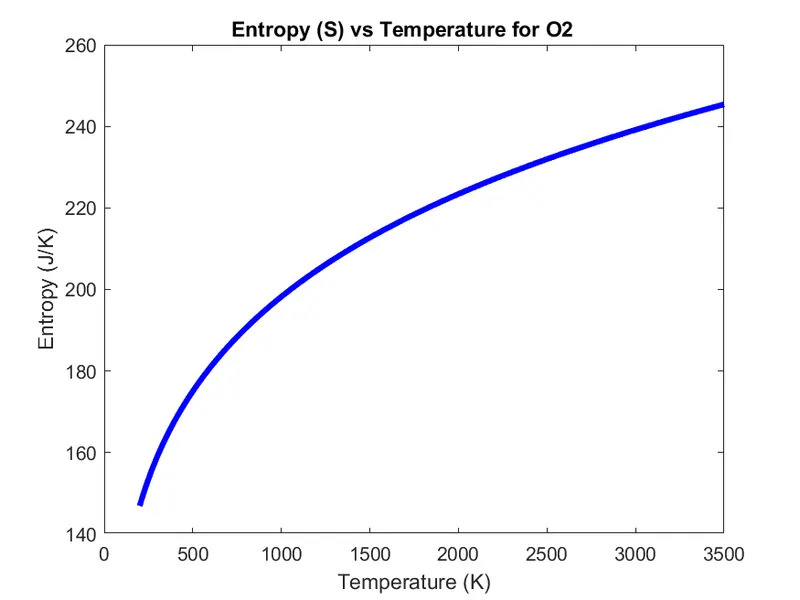
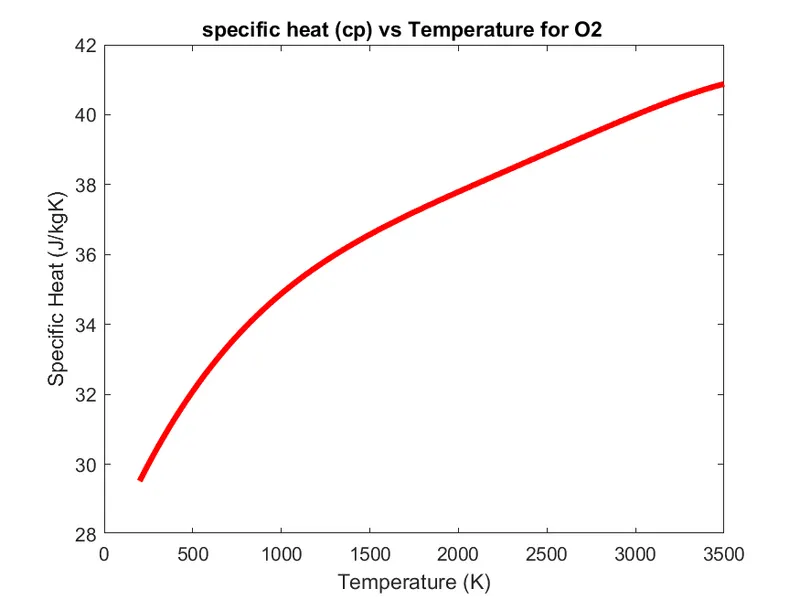
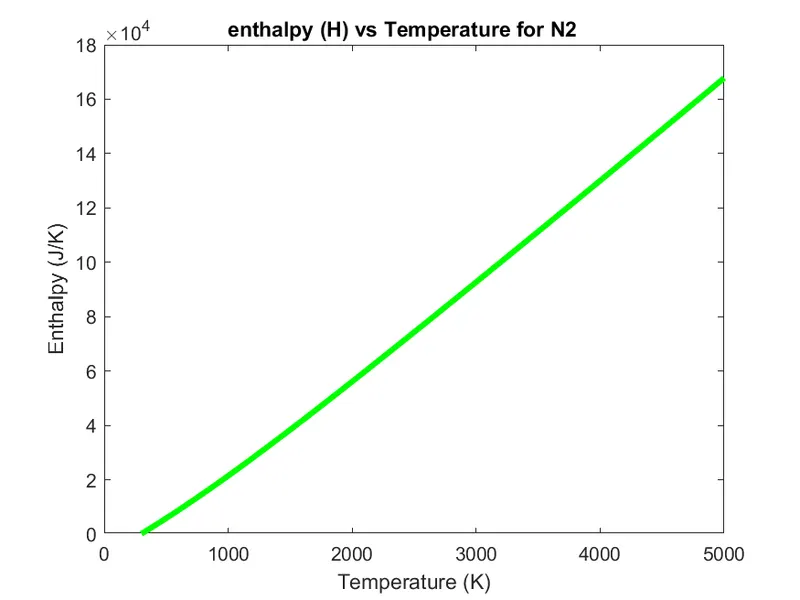
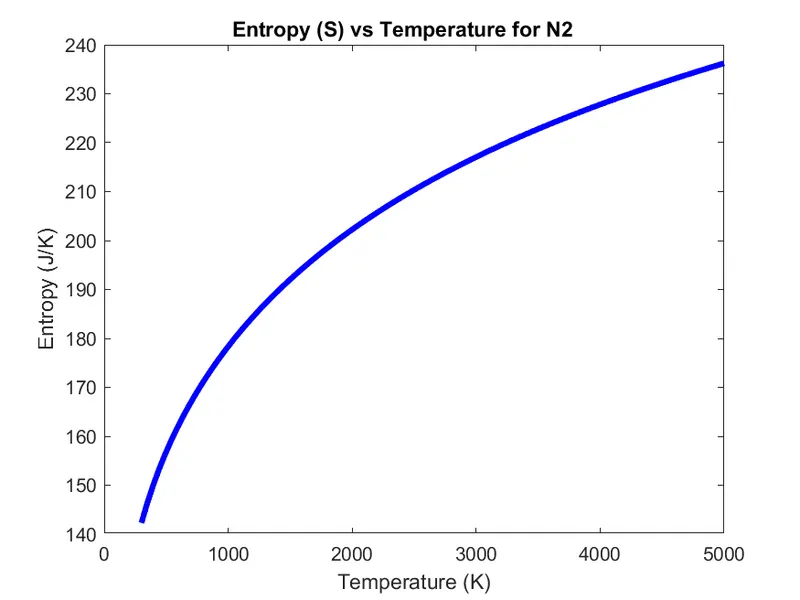
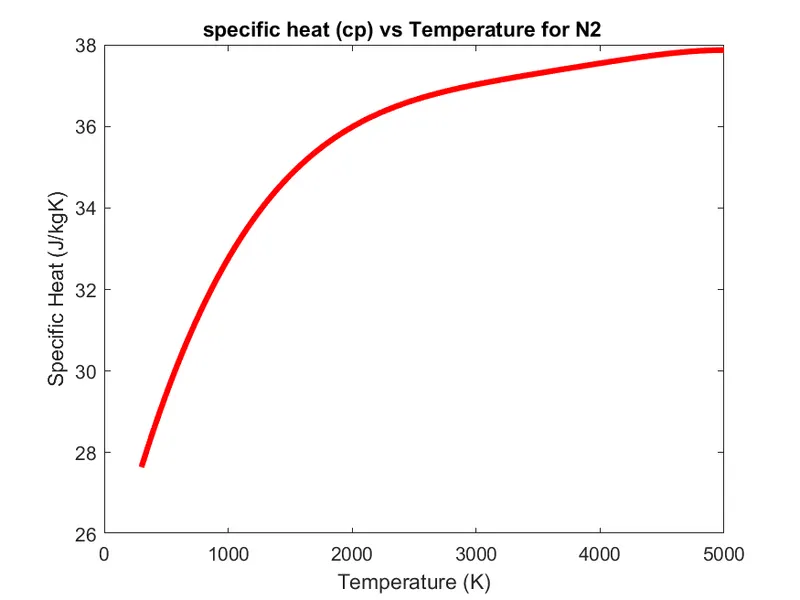
After running the program we get the graphs. The mentioned graphs for O2, N2 & CO2 are attched below.
Outputs For O2 :
Outputs for N2 :
Outputs for CO2 :