Project 1 - Parsing NASA thermodynamic data
AIM-
Write a function that extracts the 14 co-efficients and calculates the enthalpy, entropy and specific heats for all the species in the data file.
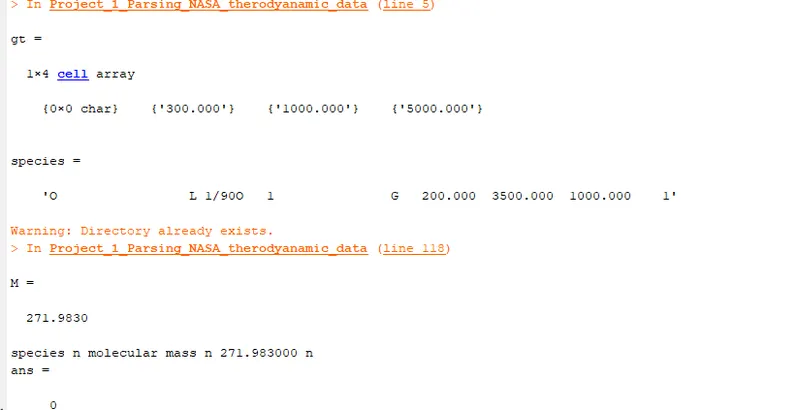
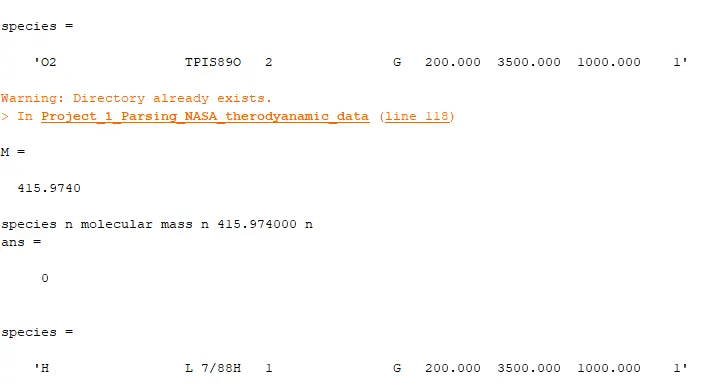
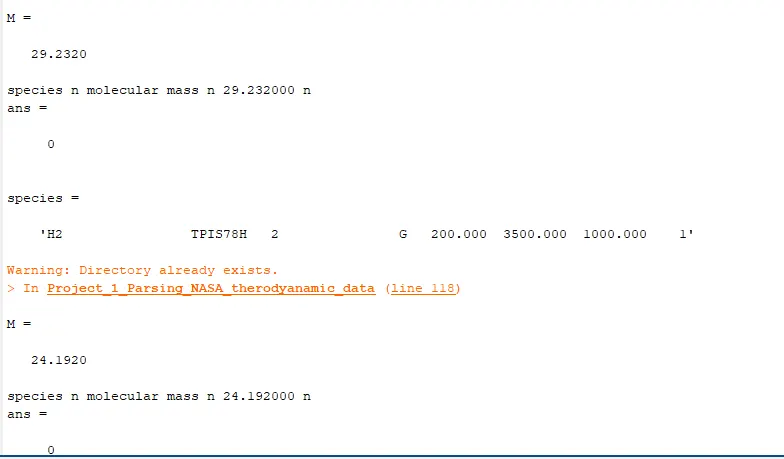
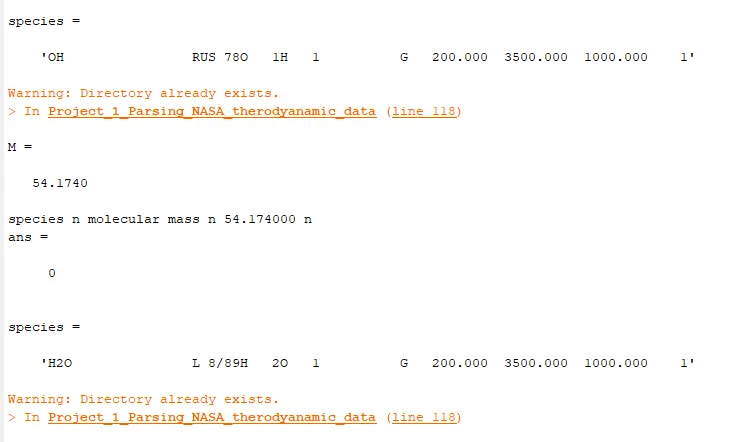
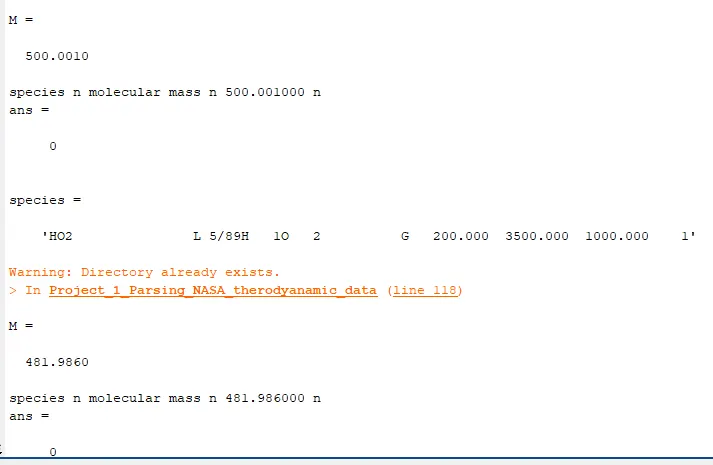
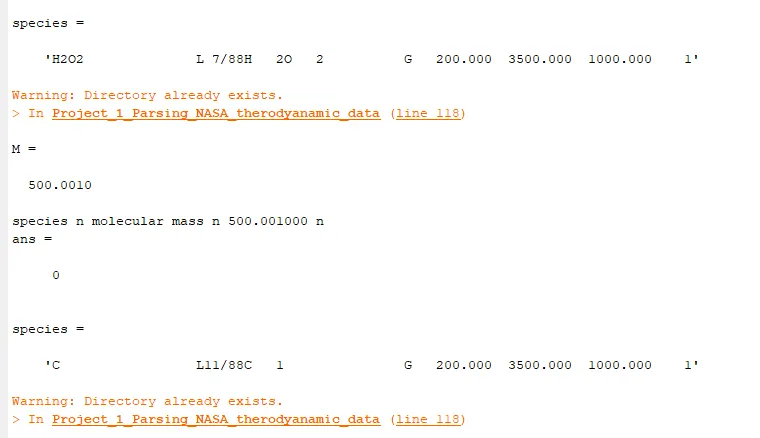
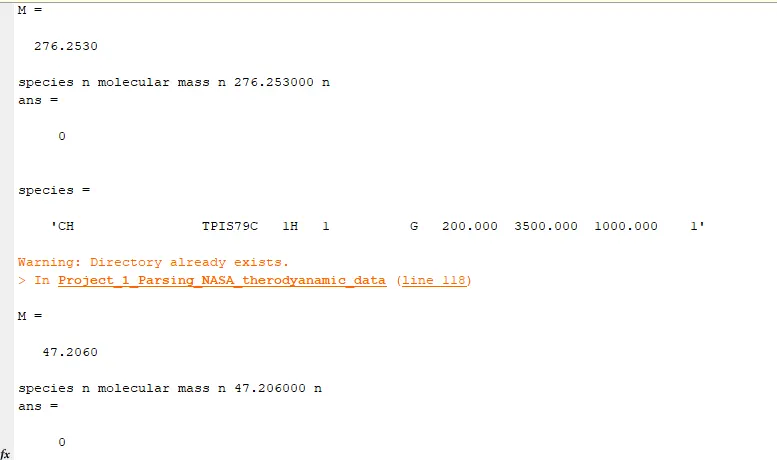
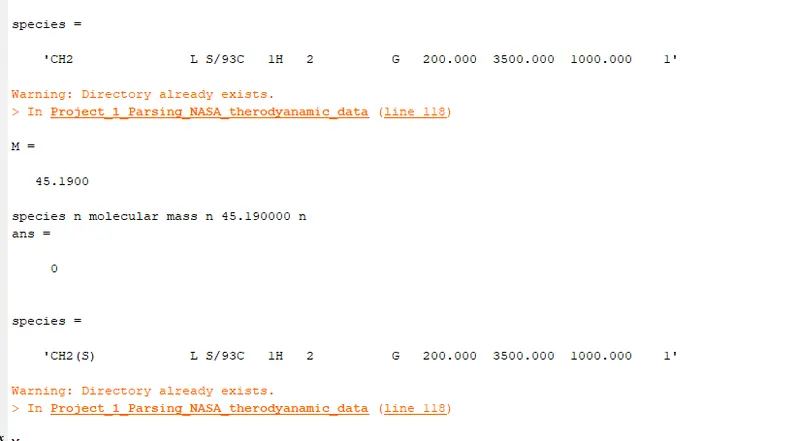
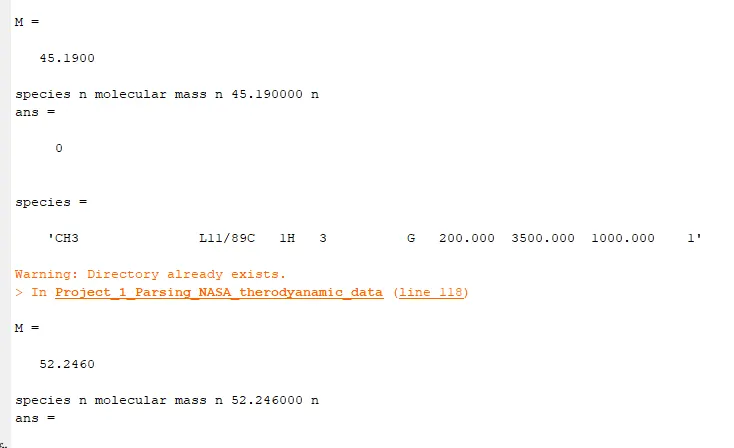
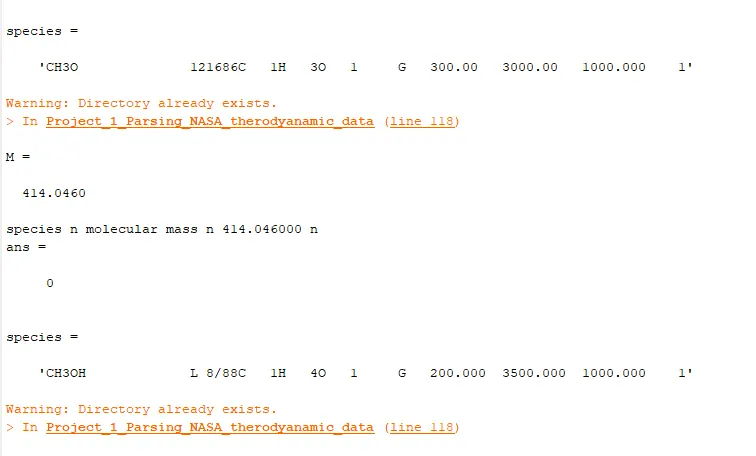
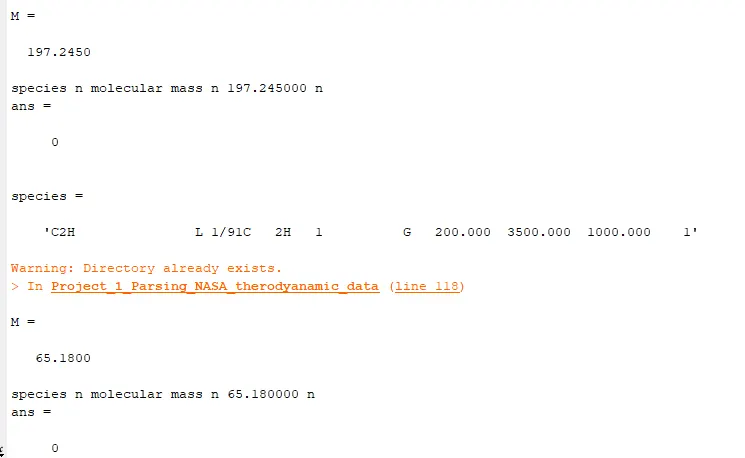
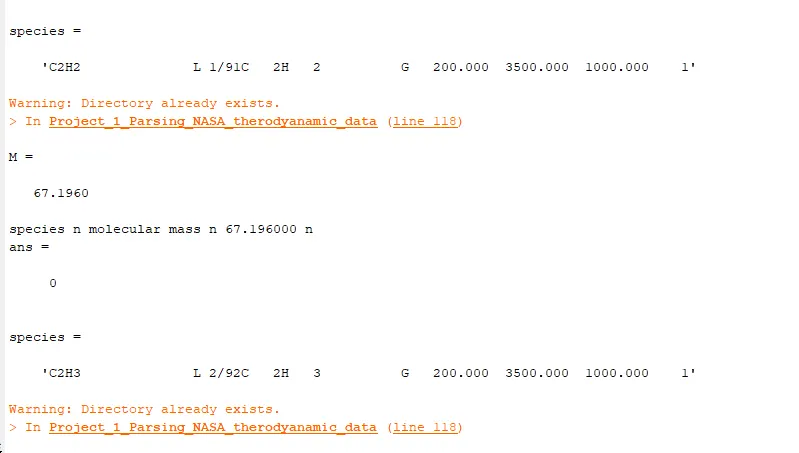
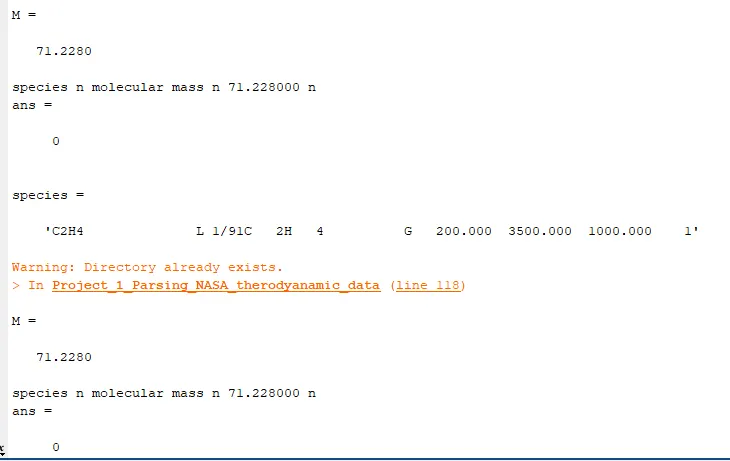
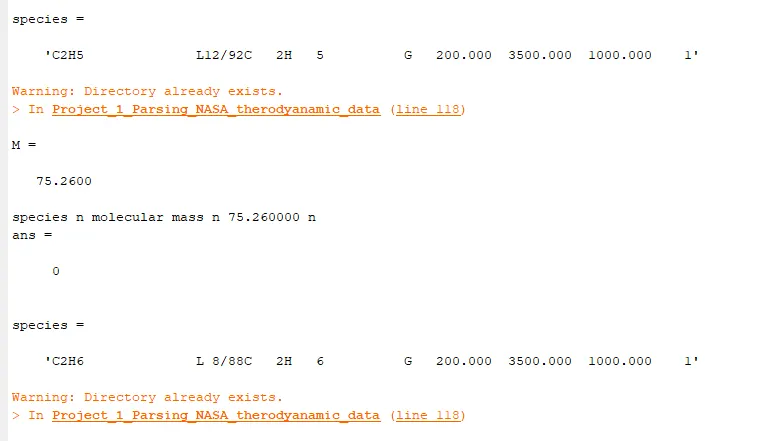
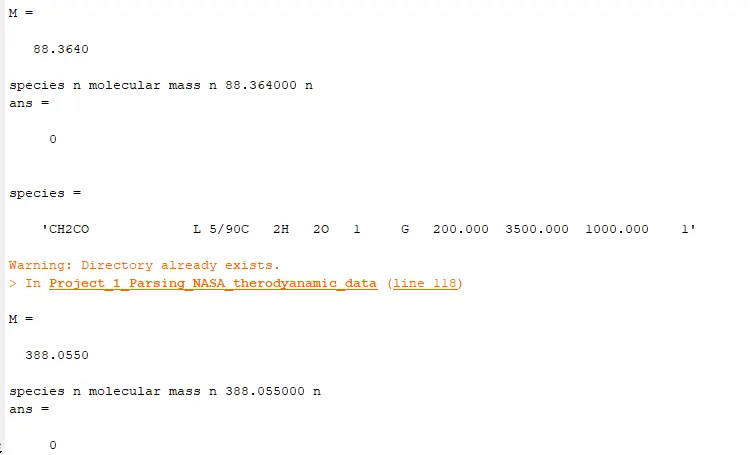
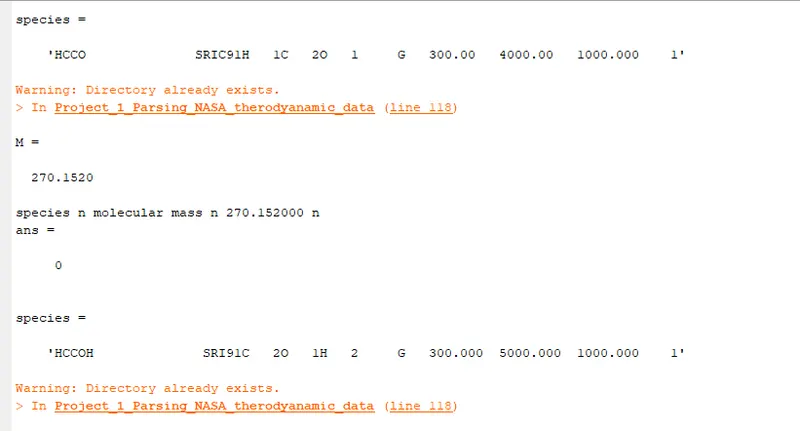
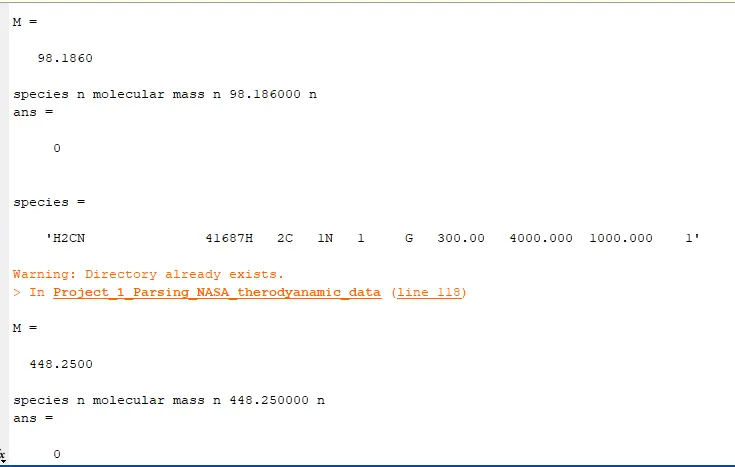
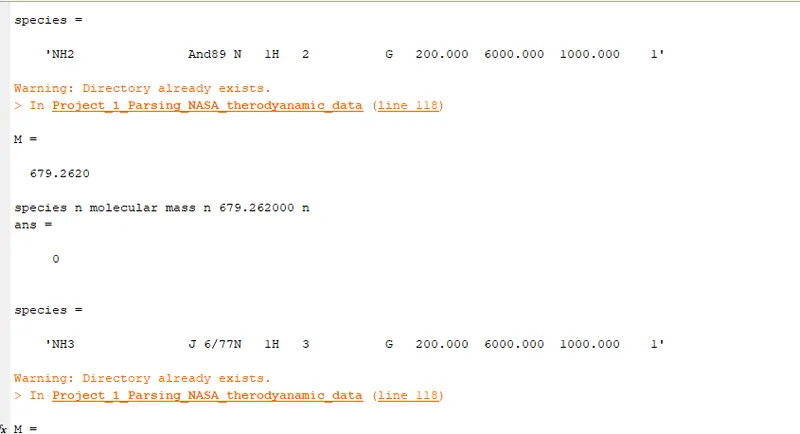
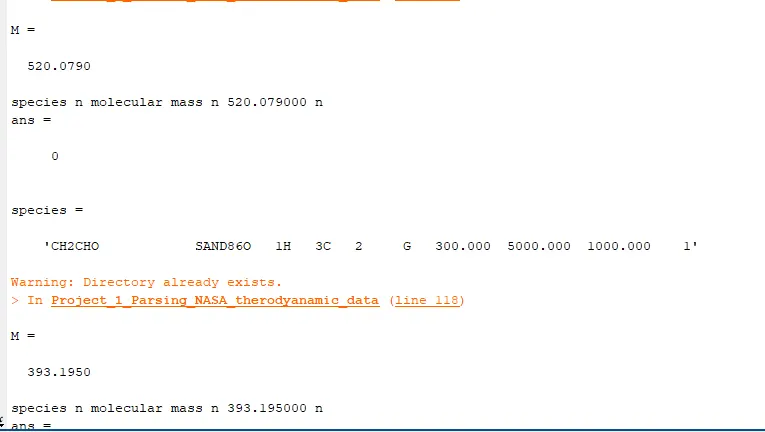
Calculate the molecular weight of each species and display it in the command window.
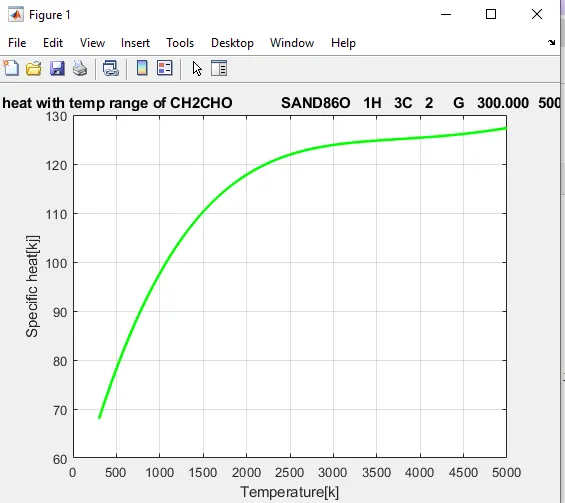
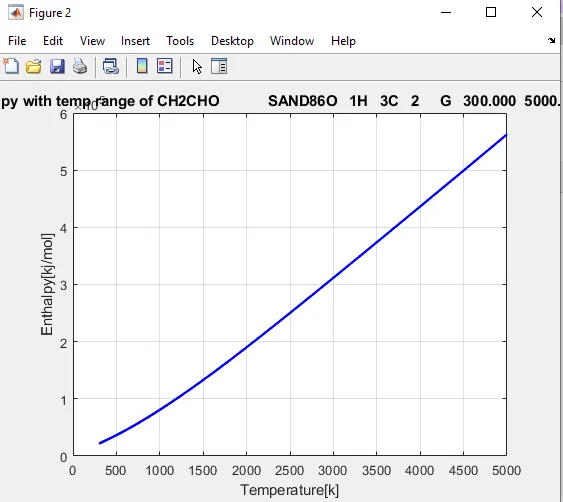
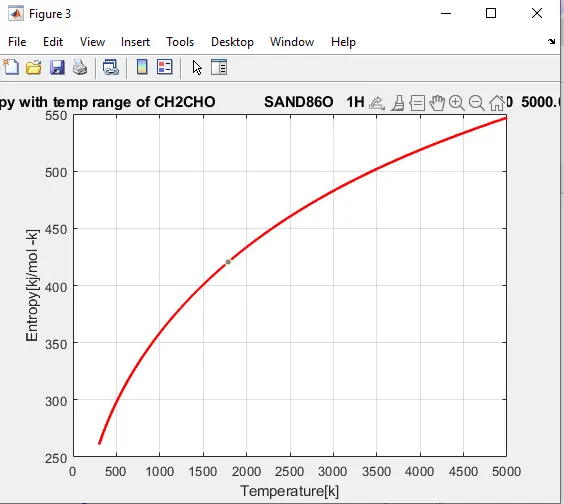
Plot the Cp, Enthalpy and Entropy for the local temperature range (low temperature : high temperature) specific for each species.
Save the plots as images with appropriate names and dump them in separate folders for each species with suitable name. All these should be generated automatically.
The main program that you will submit will just take the "THERMO.dat" file as an input and generate Cp, H and S plots.
THEORY:-
Data pursing is process of extracting data from particular file and used it for further calculation or study of data.
In this project,we are using data file from NASA.NASA came up with polynomials that can be used to evaluate thermodynamic properties such as Cp, H and S. They have also documented the co-efficients that are required to evaluate these polynomials for 1000+ species.These all coefficient are used to describe relation between specific heat,enthalpy and entropy with temperature.
Formulas are used for this as follow:
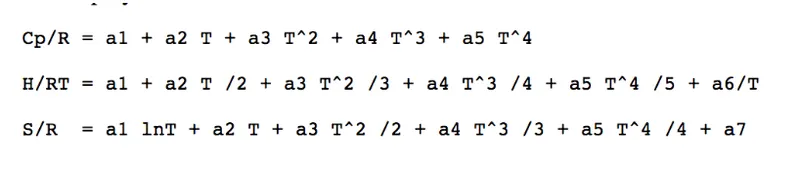
Here R is the universal gas constant, T is the temeprature
The FIRST 7 coefficients are HIGH-temperature coefficients and the SECOND 7 coefficients are LOW-temperature coefficients.
PROCEDURE:-
- As a input,we have given gas constant(R).
- we have to use fopen command to open given data file.
- By using fgetl command first line of data file is read and stored as line_1
- Again by using fgetl command, we have read next few lines.Therefore by using this command 5 types, we have extract next 5 lines and store them in variable
- Now to extract global temperature seperately, strsplit command is used.spacing between global temperature is used as indicator for split.
- By using for loop with 53 species and by fgetl command each line of species is read and coefficient values are stored in a1 to a14
- The coefficient values can be detect by using 'E'. for this we have used strfind command
- By using nested if command we have calculated cp, H and s and calculated further.
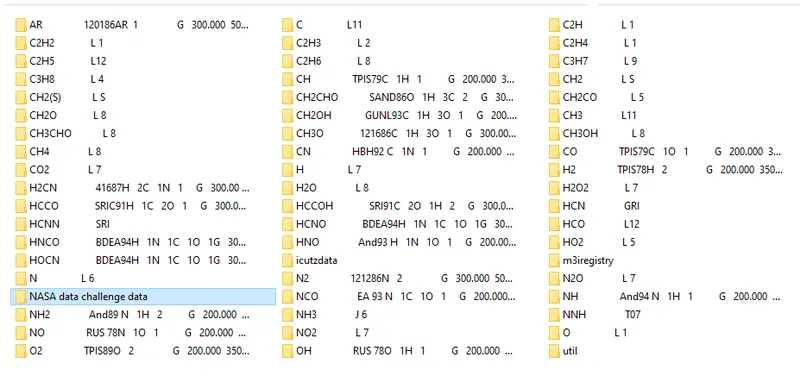
- Now by using mkdir command, we have send extracted data file into directory.
- Graphs for each species are generated by using plot command. All graph images are saved in directory by using saveas command.
- To calculate molecular weight, 'mol_wt' function is used.
NOW CREATE FUNCTIONS:-
Function for enthalpy calculation
%function for enthalpy calculation
function H=Enthalpy(a1,a2,a3,a4,a5,a6,a7,a8,a9,a10,a11,a12,a13,Temp,R,mid_gt)
%comparing with global temp
%if less than global temp- min coeff are taken
if Temp<=mid_gt
H=R*(Temp).*(a8+((a9.*Temp)/2)+((a10*(Temp).^2)/3)+((a11*(Temp).^3)/4)+((a12*(Temp).^4)/5)+(a13./Temp));
else
%max coeff are taken
H=R*(Temp).*(a1+((a2.*Temp)/2)+((a3*(Temp).^2)/3)+((a4*(Temp).^3)/4)+((a5*(Temp).^4)/5)+(a6./Temp));
end
end
Function_for_entropy_calculation
%function_for_entropy_calculation
function s=Entropy(a1,a2,a3,a4,a5,a7,a8,a9,a10,a11,a12,Temp,R,mid_gt);
%comparing with global temp
%if less than global temp-min coeff are taken
if Temp<= mid_gt
s=R.*(a8.*log(Temp)+(a9.*Temp)+(a10.*((Temp).^2)/2)+(a11.*((Temp).^3)/3)+(a12.*((Temp).^4)/4)+a14);
else
%max coeff are taken
s=R.*(a1.*log(Temp)+(a2.*Temp)+(a3.*((Temp).^2)/2)+(a4.*((Temp).^3)/3)+(a5.*((Temp).^4)/4)+a7);
end
end
Function for specific heat
%function for specific heat
function cp=specificheat(a1,a2,a3,a4,a5,a8,a9,a10,a11,a12,Temp,R,mid_gt);
%comparing global temp
%if less than global temp-min coeff are taken
if Temp<=mid_gt
cp=R*(a8+(a9*(Temp))+(a10*(Temp).^2)+(a11*(Temp).^3)+(a12*(Temp).^4));
else
cp=R*(a1+(a2*(Temp))+(a3*(Temp).^2)+(a4*(Temp).^3)+(a5*(Temp).^4));
end
Function for calculation of molecular weight
%function for calculation of molecular weight
function MW=molecularweight(species)
%automatic name
%HYDROGEN,CARBON,OXYGEN,NITROGEN,ARGON
s={'H','C','O','N','A'};
%standard automic no
automic_wt=[1.008 12.011,15.999 15.007 39.948];
%starting range of molecule
MW=0;
%adding automatic number to obtain particular value
for i=1:length(species);
for j=1:length(s)
if strcmp(species(i),s(j))
MW=MW+automic_wt(j);
position=j;
end
end
n=str2num(species(i));
if n>1
MW= MW+automic_wt(position)*(n-1);
end
end
end
MAIN PROGRAM
clear all
close all
clc
mkdir 'D:NASA data challenge data'
%Input
%Gas Constant
R=8.314;
%to load file in matlab
f1=fopen('THERMO.dat','r');
fgetl(f1);
%to read first line
global_temp=fgetl(f1);
gt=strsplit(global_temp)
low_gt=str2num(gt{2});
mid_gt=str2num(gt{3});
high_gt=str2num(gt{4});
%Temp range
Temp=linspace(low_gt,high_gt,800);
%Ignoring comments in the file
for i=1:3
gt=fgetl(f1);
end
for i=1:53
gt=fgetl(f1);
A=strsplit(gt,'');
species=(A{1})
line_1=fgetl(f1);
%to locate location of E
a=strfind(line_1,'E');
%extracting higher and lower temp coeff
%first 7 coeff. high temp coeff
%first coeff
a1=line_1(1:a(1)+3);
%second coeff
a2=line_1(a(1)+4:a(2)+3);
%third coeff
a3=line_1(a(2)+4:a(3)+3);
%fourth coeff
a4=line_1(a(3)+4:a(4)+3);
%fifth coeff
a5=line_1(a(4)+4:a(5)+3);
%to convert all these strings to numbers
a1=str2num(a1);
a2=str2num(a2);
a3=str2num(a3);
a4=str2num(a4);
a5=str2num(a5);
%for line2
line_2=fgetl(f1);
%to locate location of E
b=strfind(line_2,'E');
%coeff from 6 to 10
a6=line_2(1:b(1)+3);
a7=line_2(b(1)+4:b(2)+3);
a8=line_2(b(2)+4:b(3)+3);
a9=line_2(b(3)+4:b(4)+3);
a10=line_2(b(4)+4:b(5)+3);
%to convert all these strings to numbers
a6=str2num(a6);
a7=str2num(a7);
a8=str2num(a8);
a9=str2num(a9);
a10=str2num(a10);
%for line3
line_3=fgetl(f1);
%to locate location of E
c=strfind(line_3,'E');
%coeff from 6 to 10
a11=line_3(1:c(1)+3);
a12=line_3(c(1)+4:c(2)+3);
a13=line_3(c(2)+4:c(3)+3);
a14=line_3(c(3)+4:c(4)+3);
%to convert all these strings to numbers
a11=str2num(a11);
a12=str2num(a12);
a13=str2num(a13);
a14=str2num(a14);
%specific heat calculation
cp=specificheat(a1,a2,a3,a4,a5,a8,a9,a10,a11,a12,Temp,R,mid_gt);
%enthalpy calculation
H=Enthalpy(a1,a2,a3,a4,a5,a6,a7,a8,a9,a10,a11,a12,a13,Temp,R,mid_gt);
%entropy calculation
s=Entropy(a1,a2,a3,a4,a5,a7,a8,a9,a10,a11,a12,Temp,R,mid_gt);
%molecular weight
mol_weight(i)=molecularweight(species);
%to read and write molecular list
molecular_list=fopen('mol_weight.text','a+');
fprintf(molecular_list,'mol_weight %s is %d n',species,mol_weight);
fclose(molecular_list);
%plot of cp,H,s,Temp,species_sp)
cur_dir=pwd;
mkdir(species)
%plot1 specific heat(cp) vs Temp range(Temp)
figure(1)
plot(Temp,cp,'linewidth',2,'color','g');
xlabel('Temperature[k]')
ylabel('Specific heat[kj]')
title(sprintf('varying specific heat with temp range of %s',species));
grid on
save as(figure(1),'specific heat.jpg');
%plot2 Enthalpy(H) vs Temp range(Temp)
figure(2)
plot(Temp,H,'linewidth',2,'color','b');
xlabel('Temperature[k]')
ylabel('Enthalpy[kj/mol]')
title(sprintf('varying Enthalpy with temp range of %s',species));
grid on
save as(figure(2),'Enthalpy.jpg');
%plot3 Entropy(s) vs Temp range(Temp)
figure(3)
plot(Temp,s,'linewidth',2,'color','r');
xlabel('Temperature[k]')
ylabel('Entropy[kj/mol -k]')
title(sprintf('varying Entropy with temp range of %s',species));
grid on
save as(figure(3),'Entropy.jpg');
cd(cur_dir);
%molecular weight
M=molecularweight(species)
f2=fopen('molecular_mass','w');
fprintf('%s n %s n %f n','species','molecular mass',M)
fclose(f2)
end
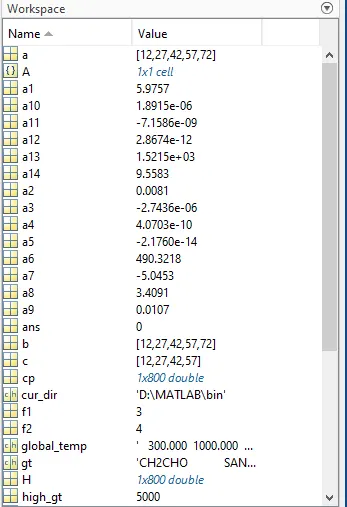
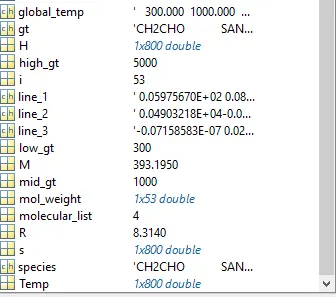
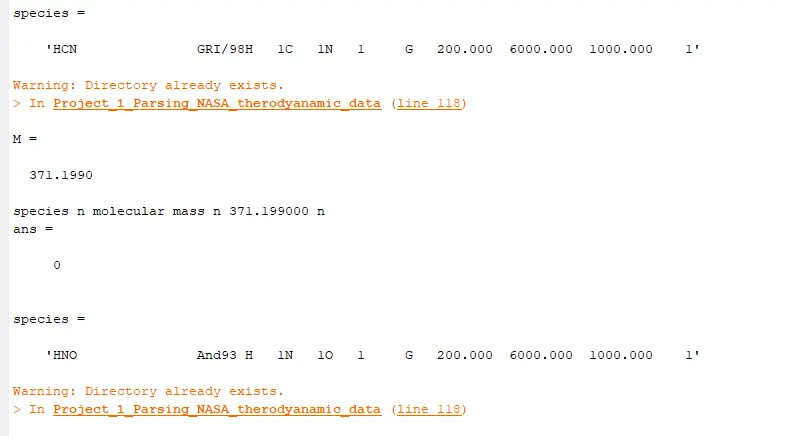
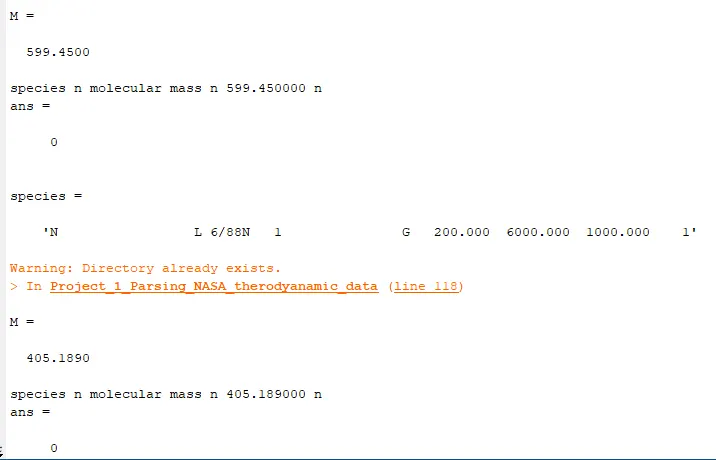
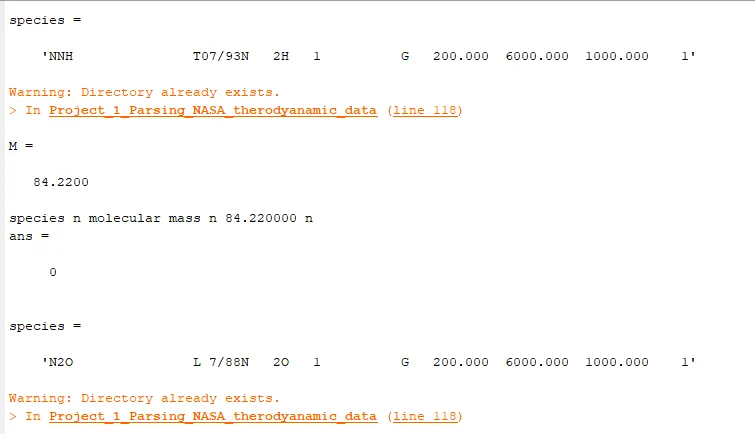
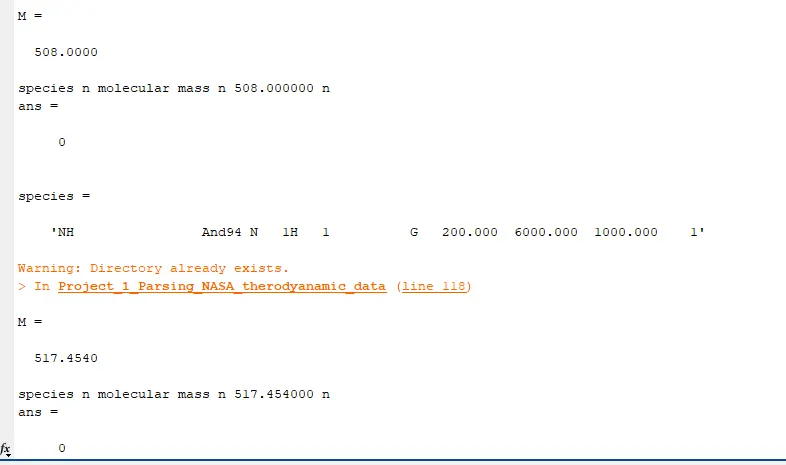
OUTPUT:-
GRAPHS:-