Project 1 - Parsing NASA thermodynamic data
AIM: To write a program in MATLAB for parsing NASA thermodynamics data.
OBJECTIVE:
1. To write a function that extracts the 14 coefficients and calculate the enthalpy, entropy and specific heats for all species in the data file.
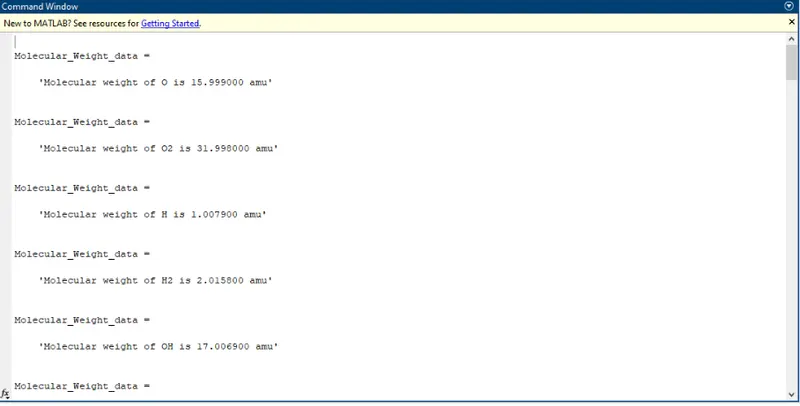
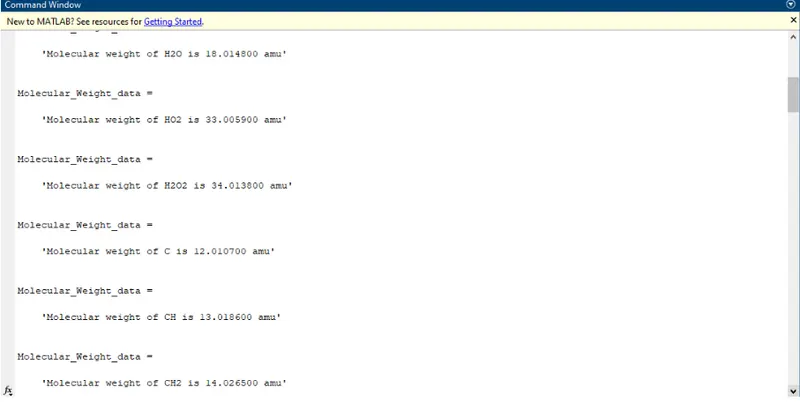
2. To calculate the molecular weight of each species and display it in the command window.
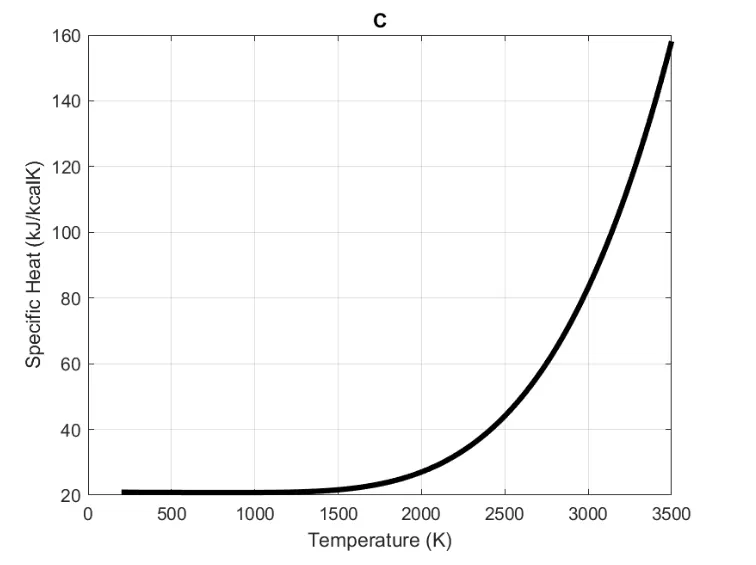
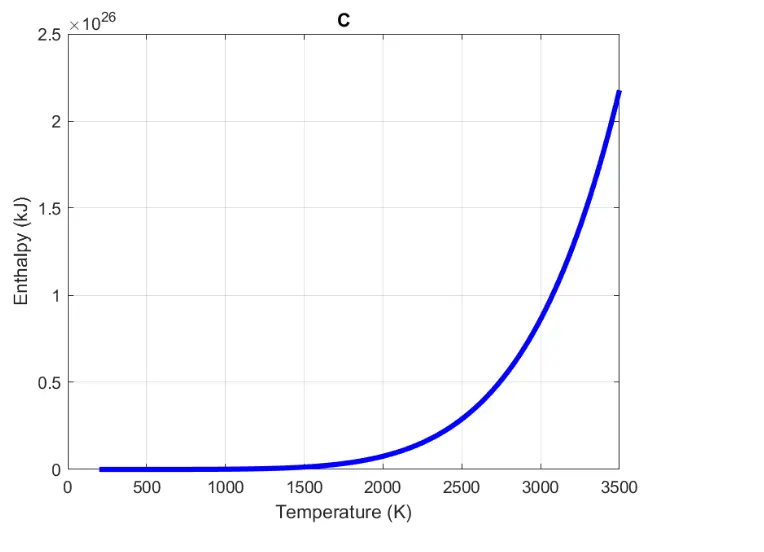
3. To plot the cp, Enthalpy and Entropy for the local temperature range specific for each species save the plots as images with appropriate names and dump them in separate folders for each species with suitable name.
THEORY: Thermodynamic data for individuals species are necessary for performing equillibrium chemistry and finite-rate chemical kinetics calculations. these data typically provide the thermodynamic properties of a species as a function of temperature. Thermodynamic data for individual species are required in many application involving chamical reactions.For over 50 year the NASA lewis reserch center has been compiling and disseminating thermodynamic data for used in chemical equillibrium program. These data, widely used by the thermodynamic community,have growth from 42 species to the current 2000. for calculation purpose the use of thermodynamic data in the form of simple empirical equations has some obvious advantages. first it make tabular interpolation unnecessary second it permit analytical integration and third it condenses all the tabulated information into a few constant that accurately reproduce the many thermodynamic data points.
- Enthalpy is the sum of the internal energy of system plus the product of pressure of gas in the system and its volume. H= U+PV. therefore, enthalpy of a gas decreases with pressure at constant temperature. Enthalpy of liquid phase at constant temperature remain constant for moderate pressure. for a process at constant pressure, the change of enthalpy is,
`H=intT1T2 CpdT`
- Entropy s is a nonconserved and extensive property of a system in any state and its value is part of the state of system.any change of state is associated with a change in entropy. Entropy change is determined by the following equation,
`delq_rev`
where qrev is the reversible heat flow.when a fluid system changes from state A to state B by an irreversible process, then the change of its entropy is be SB-SA
- The specific heat is the amount of heat per unit mass required to raise the temperature by one degree celcius. The specific heat of water is 1 calories/gram degree which is higher than any other common substance.
GOVERNING EQUATION USED:
Here R is the universal gas constant, T is the temperature, The first 7 coefficient are high temperature coefficient and second 7 coefficient are low-temperature coefficients:
BODY OF THE CONTENT:
solution steps-
1. To read the given data file, fopen command was used and fgetl command was used to read the subsequent line, which were headers, comments and numerical entries.
2. To extract the numerical value of global and local temperatures which were stored as string by using fgetl,strsplit command was used to split the given line according to spaces provided in between of them and were converted from string to double datatype using str2double command and were stored in respective variables.
3. The total number of species present in the given data file was 53, so a far loop was initiated from 1 to 53 times for reading each species and 14 coefficients were again extracted and converted from string to double datatype.
4. Two separate functions for molecular weight and specific heat,enthalpy,entropy were created which stores the required data and formulas for calculation.
5. The functions created were called in main program for further calculations and respective graphs were plotted for each species and stored in individual folders using cd and mkdir command.
6. when the program is executed molecular weight for each species were displayed in the command window and plots of specific heat,enthalpy,entropy w.r.t time for each species were obtained.
Matlab code:
% A program for parsing the given data and calculate various thermodynamics
% parameters
close all
clear all
clc
% Reading the given file
mainfile_1 = fopen('THERMO.dat','r');
Header_1 = fgetl(mainfile_1);
tline_1 = fgetl(mainfile_1);
a = strsplit(tline_1,' ');
global_low_temp = str2double(a{2}); %% converting the global temperature data,
global_mid_temp = str2double(a{3}); %% from string to integer/double,
global_high_temp = str2double(a{4}); %% numerical
comment_line_1 = fgetl(mainfile_1); %% reading the comment line
comment_line_2 = fgetl(mainfile_1); %% reading the comment line
comment_line_3 = fgetl(mainfile_1); %% reading the comment line
for i =1:53 %% there are 53 species of element present
species_data=fgetl(mainfile_1);
ss = strsplit(species_data,' ');
species_name = (ss{1});
local_low_temp = str2double(ss{end-3}); %% converting the local temperature of each,
local_mid_temp = str2double(ss{end-1}); %% species data from string to integer/double,
local_high_temp = str2double(ss{end-2}); %% numerical
line_1 = fgetl(mainfile_1);
line_2 = fgetl(mainfile_1);
line_3 = fgetl(mainfile_1);
x_1 = strfind(line_1,'E'); %% finding the unique character(E)in each line
x_2 = strfind(line_2,'E'); %% in the string and storing it in different
x_3 = strfind(line_3,'E'); %% variable
a01 = str2double(line_1(1:x_1(1)+3)); %% converting the string data into numerical
a02 = str2double(line_1(x_1(1)+4:x_1(2)+3)); %% according to their places in the data given
a03 = str2double(line_1(x_1(2)+4:x_1(3)+3));
a04 = str2double(line_1(x_1(3)+4:x_1(4)+3));
a05 = str2double(line_1(x_1(4)+4:x_1(5)+3));
a06 = str2double(line_2(1:x_2(1)+3));
a07 = str2double(line_2(x_2(1)+4:x_2(2)+3));
a08 = str2double(line_2(x_2(2)+4:x_2(3)+3));
a09 = str2double(line_2(x_2(3)+4:x_2(4)+3));
a10 = str2double(line_2(x_2(4)+4:x_2(5)+3));
a11 = str2double(line_3(1:x_3(1)+3));
a12 = str2double(line_3(x_3(1)+4:x_3(2)+3));
a13 = str2double(line_3(x_3(2)+4:x_3(3)+3));
a14 = str2double(line_3(x_3(3)+4:x_3(3)+3));
% creating a function of Cp,h,s for storing formulas and to calculate
% it
[Cp,h,s] = chs(a01,a02,a03,a04,a05,a06,a07,a08,a09,a10,a11,a12,a13,a14,T,local_mid_temp);
% creating a function of mol_wt for storing molecular formulaand
% calculate it
[mol_wt] = molecular_weight(species_name);
Molecular_weight_data = sprintf('Molecular weight of %s is %f amu',species_name,mol_wt)
% Identifing current folder and changing the current folder to a local
% folder
% and store the path(creating a new folder after each iteration)
currentFolder = pwd;
mkdir(species_name);
cd(species_name);
% Plotting Cp vs T graph
figure(1)
plot(T,Cp,'linewidth',3,'color','black')
xlabel('Temperature (k)')
ylabel('Specific Heat (KJ/kcalk)')
title(species_name)
grid on
% Plotting h vs T graph
figure(2)
plot(T,h,'color','blue','linewidth',3)
xlabel('Temperature (K)')
ylabel('Enthalpy (KJ)')
title(species_name)
grid on
% Plotting s vs T graph
figure(3)
plot(T,s,'color','m','linewidth',3)
xlabel('Temperature (K)')
ylabel('Entropy (KJ/k)')
title(species_name)
grid on
% Saving the images of graph of each species in individual folders
saveas(1,'Cp.png')
saveas(2,'enthalpy.png')
saveas(3,'entropy.png')
cd(currentFolder)
end
fclose(mainfile_1)
close all
clear all
clc
mainfile_1 = fopen('THERMO.dat');
n = {};
while -feof(mainfile_1)
n{end+1,1} = fgetl(mainfile_1);
end
fclose(mainfile_1);
number_of_lines_in_file = numel(n)
A = n(6:4:end)
Total_species_including_footer = numel(A)
%% Here total species are 53 and one end and one footer and the name of species from line 6 with 4 lines of data between them.
function [Cp,h,s] = chs(a01,a02,a03,a04,a05,a06,a07,a08,a09,a10,a11,a12,a13,a14,T,local_mid_temp)
R = 8.314 %% Universal gas constant(J/molk)
for i = 1:length(T)
if (i>local_mid_temp)
Cp(i) = (a01 + a02.*T(i) + a03.*T(i).^2 + a04.*T(i).^3 + a05.*T(i).^4)*R;
h(i) = (a01 +(a02.*T(i)./2)+(a03.*T(i).^2./3)+(a04.*T(i).^3./4)+(a05.*T(i).^4./5)+(a06.*T(i).^5./6)).*R.*T(i);
s(i) = (a01.*log(T(i)) + a02.*T(i) + (a03.*T(i).^2)/2 + (a04.*T(i).^3)/3 + (a05.*T(i).^4)/4 + a07)*R;
else
Cp(i) = (a08 + a09.*T(i) + a10.*T(i).^2 + a11.*T(i).^3 + a12.*T(i).^4)*R;
h(i) = (a08 + (a09.*T(i)./2)+(a10.*T(i).^2./3) +(a04.*T(i).^3./4) + (a12.*T(i).^4./5)+(a13.*T(i).^5./6)).*R.*T(i);
s(i) = ((a08.*log(T(i))) + (a09.*T(i)) + (a10.*T(i).^2)/2 + (a11.*T(i).^3)/3 + (a12.*T(i).^4)/4 + a14)*R;
end
end
%% given in the challenge statement- a01,a02,a03,a04,a05,a06,a07 are high temperature coefficients
%% and a08,a09,a10,a11,a12,a13,a14 are low temperature coefficients
function [mol_wt] = molecular_weight(species_name)
name_of_elements = {'H','C','N','O','AR'};
Atomic_weight_of_elements = [1.0079,12.0107,14.007,15.999,39.948];
[mol_wt] = 0
for i = 1:length(species_name)
for j = 1:length(name_of_elements)
if (strcmp(species_name(i),name_of_elements(j)))
mol_wt = (mol_wt + Atomic_weight_of_elements(j));
pos = j;
end
end
x = str2num(species_name(i));
if (x>1)
mol_wt = mol_wt + Atomic_weight_of_elements(pos)*(x-1);
end
end
end
RESULTS:
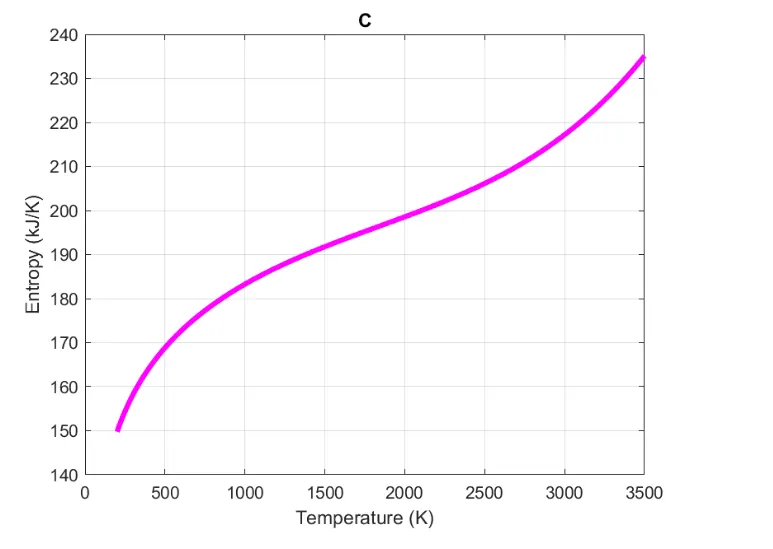
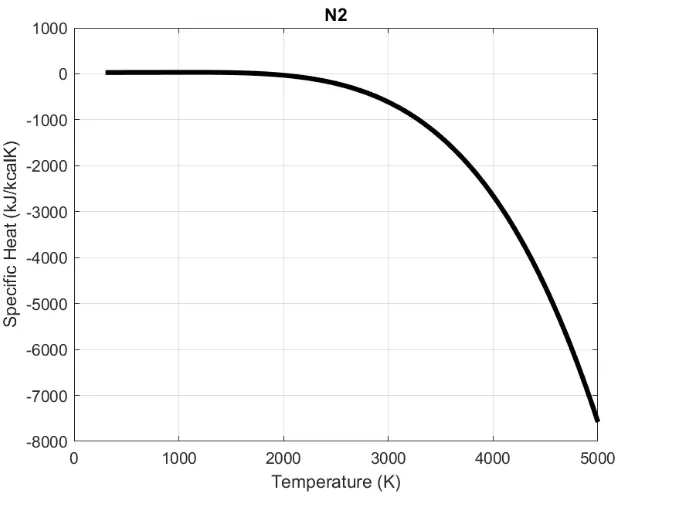
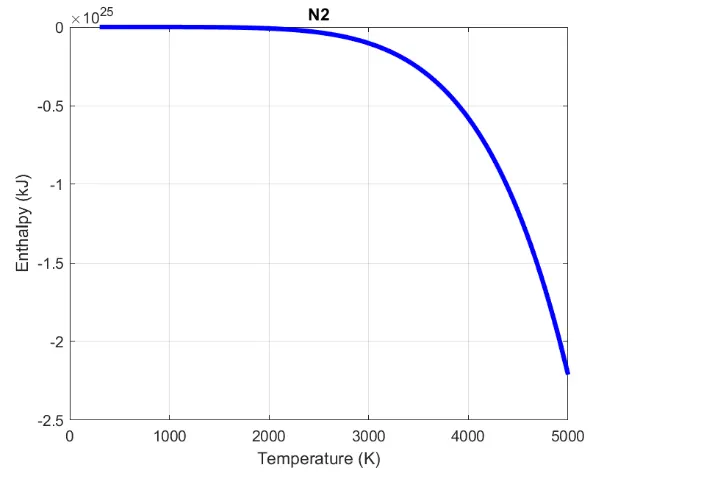
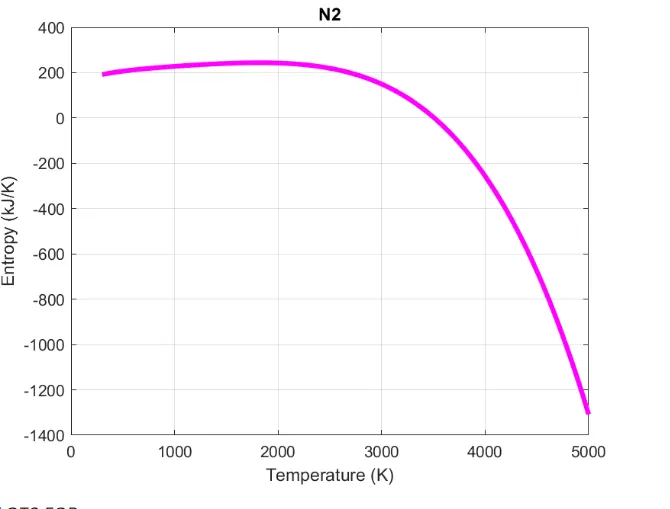
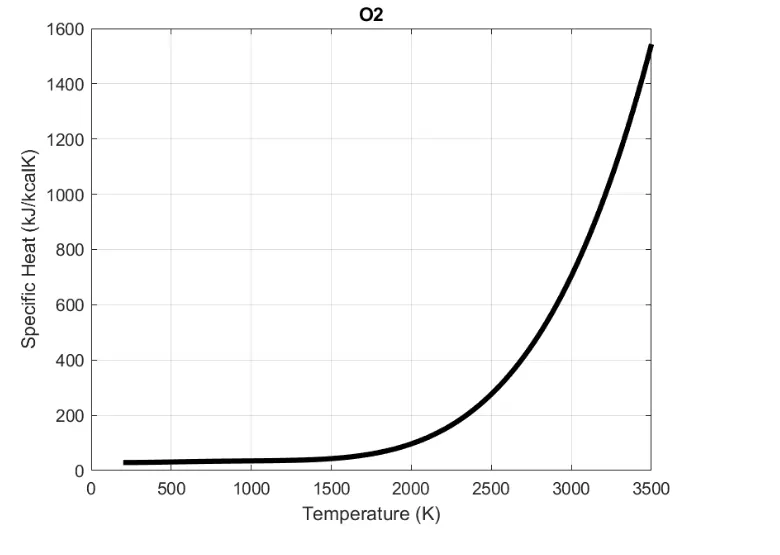
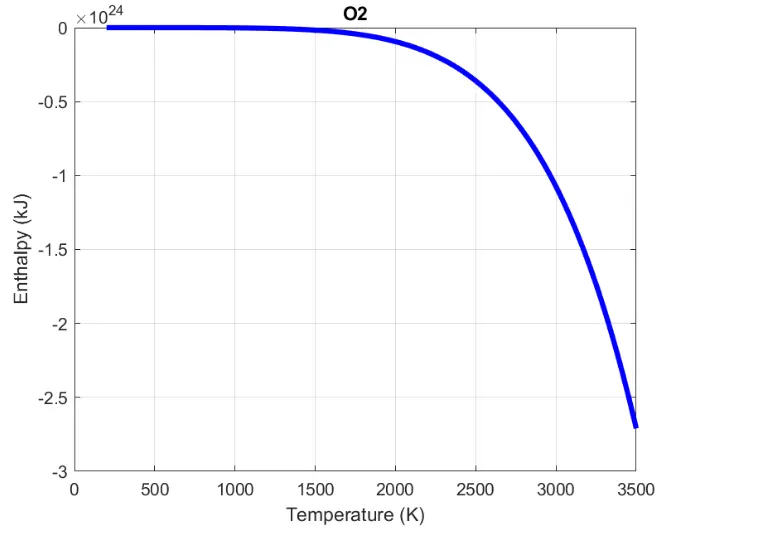
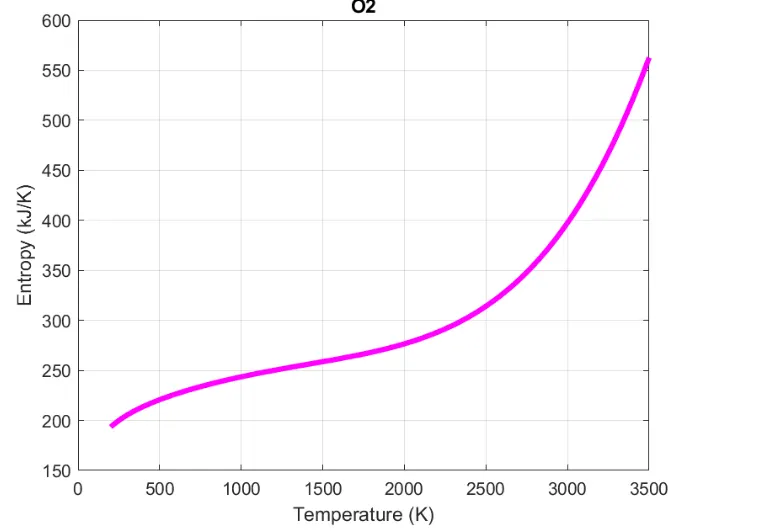
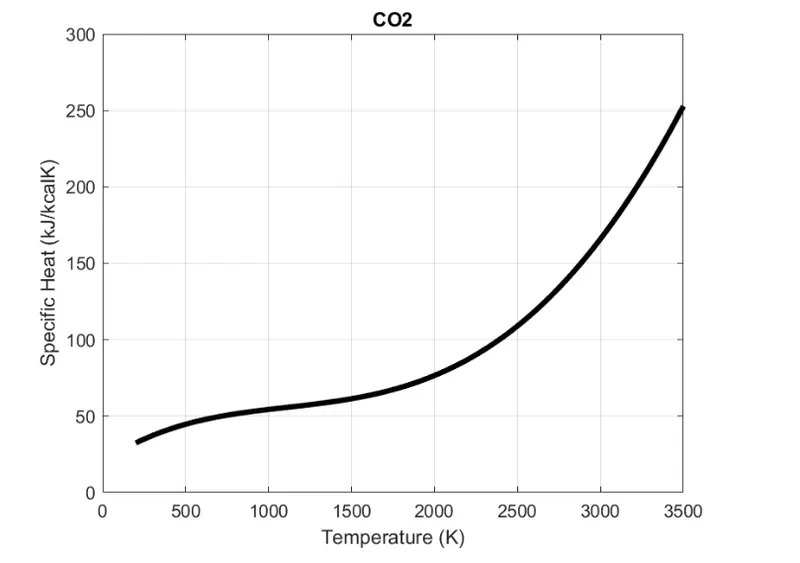
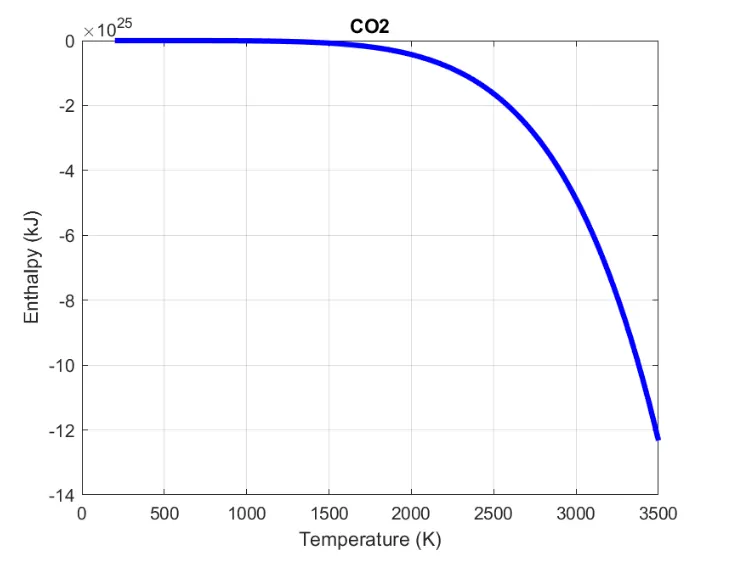
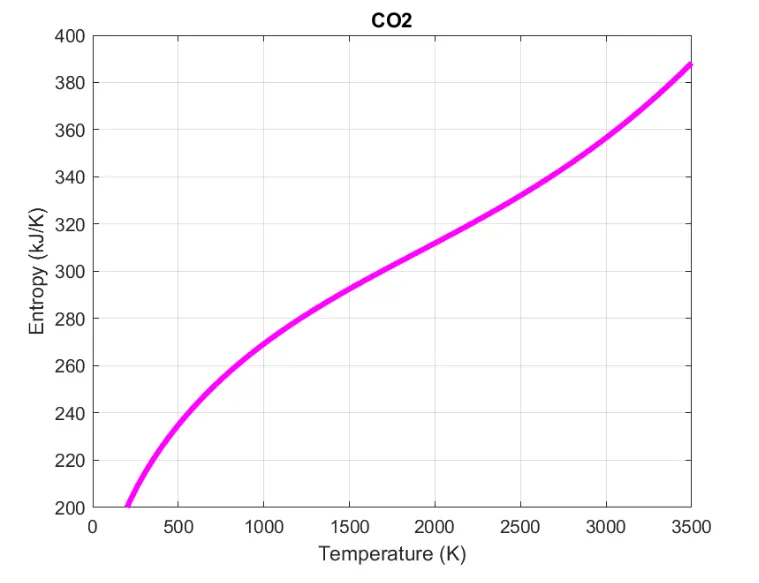
Molecular weight of each species were calculated and displayed in command window. similarly plots of specific heat,enthalpy,entropy vs time were stored in their respective folders. some snapshots of the output are shown here-and similarly rest of the results will be obtained in the command window.
PLOTS FOR
C
PLOTS FOR
N_2
PLOTS FOR
O_2
PLOTS FOR
CO_2
CONCLUSION: Through MATLAB,we can read a file and make use of important data from it.